Abstract
The extension and retraction of filopodia in response to extracellular cues is thought to be an important initial step that determines the direction of growth cone advance. We sought to understand how the dynamic behavior of the actin cytoskeleton is regulated to produce extension or retraction. By observing the movement of fiduciary marks on actin filaments in growth cones of a neuroblastoma cell line, we found that filopodium extension and retraction are governed by a balance between the rate of actin cytoskeleton assembly at the tip and retrograde flow. Both assembly and flow rate can vary with time in a single filopodium and between filopodia in a single growth cone. Regulation of assembly rate is the dominant factor in controlling filopodia behavior in our system.
Keywords: actin, growth cone, filopodia, photobleaching, photoactivation
Wiring of the nervous system depends on the correct navigation of nerve growth cones along stereotyped pathways during development. Filopodia are slender protrusions of the actin cytoskeleton present in the periphery of nerve growth cones that have been implicated in growth cone pathfinding. Filopodium extension and retraction are initial events in the steering of growth cones, and disruption of filopodia disturbs pathfinding in situ (Keshishian and Bentley 1983; Bentley and Toroian-Raymond 1986). In vitro studies have shown that growth cones subjected to gradients of soluble factors extend filopodia toward the source of an attractive cue before movement of the growth cone body (Gundersen and Barrett 1980; Zheng et al. 1996). Filopodia may steer growth cones in several different ways by exerting mechanical force (Heidemann et al. 1990), acting as conduits for signals from distal sites (Davenport et al. 1993), and by dilating into axoplasm after microtubule invasion (Sabry et al. 1991). For all these reasons, it is clear that understanding the mechanisms by which filopodia extend and retract will be an important step in understanding how extracellular cues guide growth cone.
Extension and retraction of filopodia is thought to be determined by dynamics of the underlying actin cytoskeleton. Typical neuronal filopodia are comprised of a bundle of 15–20 actin filaments oriented with their barbed (fast growing) ends toward the filopodium tip (Lewis and Bridgman 1992). These actin filament bundles extend well into the body of the growth cone. Individual filaments within the bundles are thought to be relatively long (many micrometers), though exact lengths are difficult to measure. Evidence accumulated from a variety of cell types has shown that the actin cytoskeleton is assembled near the leading edge and transported backward over time by a phenomenon known as retrograde flow (Forscher and Smith 1988; Welch et al. 1997; Katoh et al. 1999). Although actin dynamics have been less studied in filopodia than other leading edge structures such as fibroblast lamellipodia, there is good evidence that both polymerization onto barbed ends at filopodium tips and retrograde flow can occur in filopodia (Okabe and Hirokawa 1991; Lin et al. 1996). Filopodium length was hypothesized to be regulated by the balance between tip assembly and flow (Mitchison and Kirschner 1988), but there have been no systematic studies of how these two processes are regulated during filopodium length change under conditions where filopodia spontaneously extend and retract. For example, we do not know whether a change in filopodium behavior from extending to retracting is caused by a decrease in actin polymerization at the tip, an increase in retrograde flow, or a combination of both factors. The elegant studies of Aplysia growth cones by Forscher and colleagues (1988) have focused on an experimental system where assembly occurs at a relatively constant rate, and extension of the leading edge is caused by decreases in retrograde flow. Flow can be inhibited artificially with myosin inhibitors (Lin et al. 1996) or physiologically by local increases in adhesion (Suter et al. 1998). In the Aplysia experiments reported in the literature, filopodia tend to either remain at constant length or extend, and retraction has not been analyzed in this system. In this paper, we characterize actin dynamics in filopodia in growth cones of cultured neuroblastoma cells under conditions where the filopodia make frequent, unpredictable length changes, as do the filopodia of many growth cones in embryos (Myers and Bastiani 1993).
A variety of optical signals have been used to follow actin dynamics in living cells, including variations in phase-contrast (Forscher and Smith 1988) and birefringence (Katoh et al. 1999), photobleaching of fluorochrome-labeled actin (Wang 1985), photoactivation of caged resorufin (Theriot and Mitchison 1991), and speckle imaging (Waterman-Storer et al. 1998). The photoactivation method provides direct information on actin flow and turnover, but its application has been limited by poor photostability of caged probes based on fluorescein and resorufin. To address this problem, we synthesized a series of caged derivatives of rhodamine, the most useful of which for actin labeling is the α-carboxy-dimethoxy-caged-Q-rhodamine derivative used in this paper (Mitchison et al. 1998). In this paper, we use caged-rhodamine actin photoactivation and the complementary approach of green fluorescent protein (GFP)–actin photobleaching to probe actin dynamics in filopodia. We find that both cytoskeleton assembly at filopodium tips and retrograde flow can vary temporally within a single filopodium and spatially within single growth cones. The major regulated parameter in our system is the assembly rate.
Materials and Methods
NG108-15 cells (gifts of Drs. David Julius and Neil Smalheiser, University of California San Francisco) were cultured in GIBCO BRL DME H21 cell culture media supplemented with 10% FCS, penicillin/streptomycin, and 1× H.A.T. at 37°C and 5% CO2. 4–5 d before microinjection, the media was supplemented with 1 mM dibutyryl cyclic AMP, an agent that induces formation of axons and growth cones in these cells (Furuya and Furuya 1983). In preparation for microinjection, cells were briefly trypsinized (0.05% in 1 mM EDTA) and replated on a 25-mm-circular glass coverslip attached with silicone grease to the bottom of a 35-mm polystyrene tissue culture dish in which we had drilled a hole. These coverslips were precoated with poly-d-lysine and coated with matrigel (a mixture of extracellular matrix proteins, primarily collagen and laminin) just before plating cells, essentially as described (Tanaka and Kirschner 1991). Cells were transferred to coverslips 24–48 h before microinjection and incubated in 1 ml of media without phenol red. 30 min before microinjection, the media was supplemented with 25 mM sodium-Hepes, pH 7.4. On the microscope, the culture dishes were placed in a water-heated machine chamber maintained at 38°C. The temperature near the cells was close to 30°C because of loss of heat through contact with the microscope objective.
For photoactivation, we labeled rabbit muscle actin on its reactive thiol with the caged rhodamine derivative α-carboxy-dimethoxy-C2CQRd-IA (caged Q-rhodamine)1 as described (Mitchison et al. 1998). This actin derivative has been shown to form filaments in vitro and to localize to actin-containing structures (Mitchison et al. 1998). Caged Q-rhodamine is the rhodamine derived from 7-hydroxy-quinoline, caged as a bis-carbamate with two α-carboxy-dimethoxy-nitrobenzyl groups. None of the other caged fluorochromes we have worked with were satisfactory for actin labeling because of either poor photostability of the final fluorochrome (fluorescein and resorufin derivatives) or slow uncaging (caged rhodamines without α-carboxy substitution on the nitrobenzyl caging group). Caged Q-rhodamine actin was stored at 4–5 mg/ml in G buffer (5 mM Tris-HCl, pH 8.0, 0.2 mM CaCl2, 1 mM ATP, 5 mM glutathione) in 5-μl aliquots at −80°C. For microinjection, it was diluted twofold with a solution of Cy5-conjugated dextran in G buffer. Injection was verified, and cells found after stage movement, using the Cy5 signal. Gerrard Marriot (Max Planck Institute, Martinsried, Germany) provided us with a plasmid encoding Dictyostelium discoideum actin fused to GFP (Choidas et al. 1998). Cells were transfected using a standard calcium phosphate method (Maniatis et al. 1989).
A Zeiss Axiovert inverted microscope with a bottom port was modified for photoactivation and photobleaching experiments. A mercury arc lamp illuminating a slit in a conjugate focal plane was used to generate a bar of 360-nm light for photoactivation experiments. An argon ion laser focused through a cylindrical lens was used to generate a bar of 488-nm light for GFP photobleaching experiments. Descriptions of our photoactivation microscopes have been published elsewhere (Mitchison et al. 1998).
Phase and fluorescence images were acquired through a 100× objective to cooled CCD cameras from Princeton Instruments (http://www.prinst. com). For photoactivation experiments, we used a Kodak KAF1400 chip with 6.9-μm pixels cooled to −40°C. For phase images, we used 2 × 2 binning and for fluorescence images, 4 × 4 binning. For photobleaching experiments, we used a Sony 768x512 interline chip with 8.3-μm pixels cooled to –10°C. Phase images were collected without binning, and fluorescence images were collected with 2 × 2 binning. In both cases, we typically used 200–400-ms exposures with 100 W Hg illumination and standard fluorescence filters.
Images were acquired with Princeton Instrument's WinView software with additional home-written software to control image acquisition. Delay between phase and fluorescence images was typically <2 s. Negligible changes occur in NG108 filopodia over this time-scale, so these image pairs effectively represent a single time point for our purposes.
Locations of filopodium tips and photo-marks were determined by measuring the position of each with respect to the substrate along the axis of the filopodium. In practice, a single reference line was overlaid on the phase image of each filopodium, and tip distances were calculated with respect to the end of the line for each time point in the sequence. Filopodia were sometimes observed to pivot about an axis located in the growth cone body, as previously reported (Bray and Chapman 1985). Only filopodia that rotated <15° were included in our study. Generally, filopodia that exhibited minor pivoting behavior rotated smoothly from one position to another. Reference lines were drawn to bisect the angle of filopodium rotation and intersect with the axis of rotation. The position of the tip was projected via a perpendicular onto the reference line. Subsequently, an identical reference line was generated in the fluorescence channel, and similar measurements of the mark were taken. When we generated distance versus time plots of this data, all measurements were normalized with respect to the position or length recorded at t = 0, the time the mark was made.
Results
Actin Assembly at the Tip and Retrograde Flow of Filaments
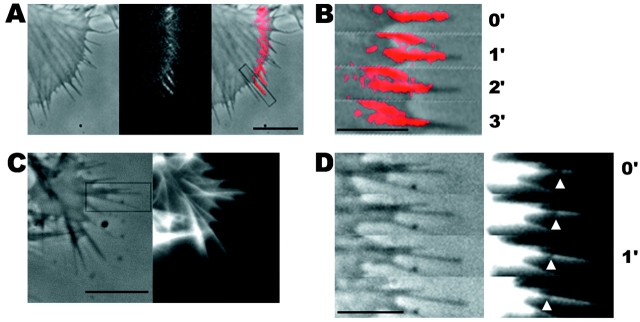
Fig. 1A and Fig. B, shows a typical growth cone photoactivation experiment. A differentiated NG108 mouse neuroblastoma cell was microinjected with actin derivatized with caged Q-rhodamine. 30 min after microinjection, the rhodamine actin had incorporated into existing cytoskeletal structures and a fluorescent mark was made on the actin filaments in a growth cone near the tips of filopodia by brief irradiation with a bar of 360-nm light. This allowed us to track the movement of a population of actin filaments in single filopodia over time (Fig. 1 B). The photoactivation mark made at the tip of a filopodium maintained a constant intensity as it moved backward, consistent with tip assembly followed by retrograde flow. Fig. 1B and Fig. C, shows a typical growth cone photobleaching experiment. NG108 cells were transfected with a plasmid expressing a GFP-actin chimera that has been shown to incorporate into the actin cytoskeleton (Choidas et al. 1998). Photobleaching also allowed us to track movement of a population of actin filaments in single filopodia over time (Fig. 1C and Fig. D).
Figure 1.
Imaging actin dynamics in filopodia. A and B show a caged Q-rhodamine actin photoactivation experiment. C and D show a GFP-actin photobleaching experiment. (A) Three lower magnification views of a section of a growth cone are presented. From left to right these are the phase-contrast image, an image of the fluorescent mark, and a combined image in which the fluorescent mark appears as a red overlay on the phase image. B shows a detailed view of a photoactivation mark made on a filopodium (box in A) at successive time points. (C) Image of a whole growth cone containing GFP-actin is presented as it appears by phase-contrast (left) and epifluorescence (right). D shows a detailed view of a photobleach mark made on one filopodium (gray box in C). Arrows indicate the location of a photobleach mark near the filopodium tip. Bars: (A and C), 10 μm; (B and D) 5 μm.
Marks made using photoactivation and photobleaching techniques were qualitatively and quantitatively similar in terms of their direction and rate of movement. In both cases, behavior of marked filopodia, as observed by phase-contrast microscopy, was similar to that of filopodia in untreated cells as well as unmarked filopodia in the same cell. Thus, both techniques appear to provide a nonperturbing probe of cytoskeletal dynamics. It is difficult to conclusively rule out the possibility that photodamage influenced our results, but two arguments suggest it was not a significant problem. First, the behavior of marked and unmarked filopodia by phase-contrast imaging is similar; second, the behavior of Q-rhodamine activation marks and GFP-actin bleach marks is similar since the photochemistry is different for these two probes. Photodamage can occur with long 360-nm irradiations. Increasing the duration of the 360-nm photoactivation pulse 10-fold over our experimental protocol caused freezing or breaking of filopodia, but we never observed such behavior in the experiments reported here. 490-nm illumination of GFP-actin appeared to cause very little perturbation, even when the fluorochrome was significantly bleached. Where our results or conclusions apply equally to photoactivation or photobleaching experiments, we use the term mark to refer to both types of mark interchangeably. Photobleaching experiments were technically easier since they did not require microinjection, whereas photoactivation experiments allowed us to track movements of actin filaments from filopodium tips deep into the growth cone as well as estimate the rate of actin filament turnover.
Marks made at or near filopodium tips moved backward at rates ranging from −3.3 to 0 μm/min; measurements of mark and tip movement are made with respect to the direction of filopodium extension, so positive values indicate forward movement and negative values indicate backward (retrograde) movement. We never observed forward movement of marks made at filopodium tips (n = 75 sequences). Also, we never observed splitting or broadening of marks. These data suggest that the actin filaments in filopodium bundles under our conditions assemble at the tip and flow rearward as a single unit, with extension or retraction resulting from the difference between the assembly and flow rates. If a small fraction of actin filaments moved at a different speed, they would have to have comprised <15% of total actin, or else not have exchanged with injected or expressed actin over the time course of our experiments, to have avoided detection.
From images of the type shown in Fig. 1 we determined two parameters: cytoskeleton assembly rate, measured as the change in distance between the filopodium tip and the mark as a function of time; and retrograde flow rate, determined as the change in position of the mark with respect to the substrate as a function of time, measured along the vector defined by the filopodium. Measuring retrograde flow with respect to the substrate restricted us to measurements in filopodia whose angle with respect to the substrate did not change greatly during the time course of observation. This was the case for most of the filopodia in our images. Small angular changes were corrected as described in Materials and Methods.
Directional Switching of Filopodia Because of Changes in Actin Dynamics
We first sought to determine how cytoskeleton dynamics changed in filopodia whose extension rate changed. Of the 75 filopodia observed in photo-marking experiments, 11 extending filopodia switched to either stationary (n = 3) or retracting (n = 8), 2 stationary filopodia switched to either extending (n = 1) or retracting (n = 1), and 6 retracting filopodia switched to extending (n = 4) or stationary (n = 2). For each of these, we asked how the rates of cytoskeleton assembly or retrograde flow changed from one phase of movement to another.
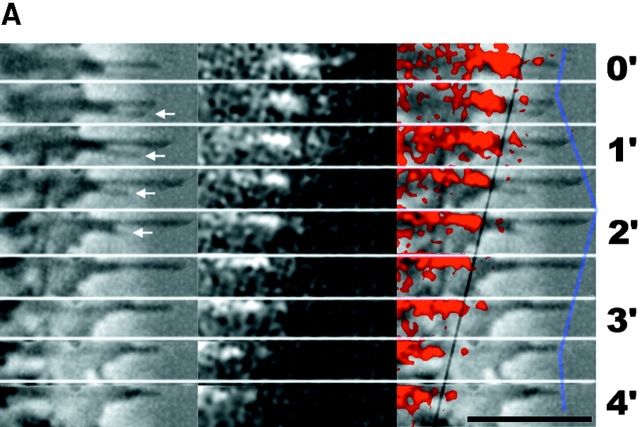
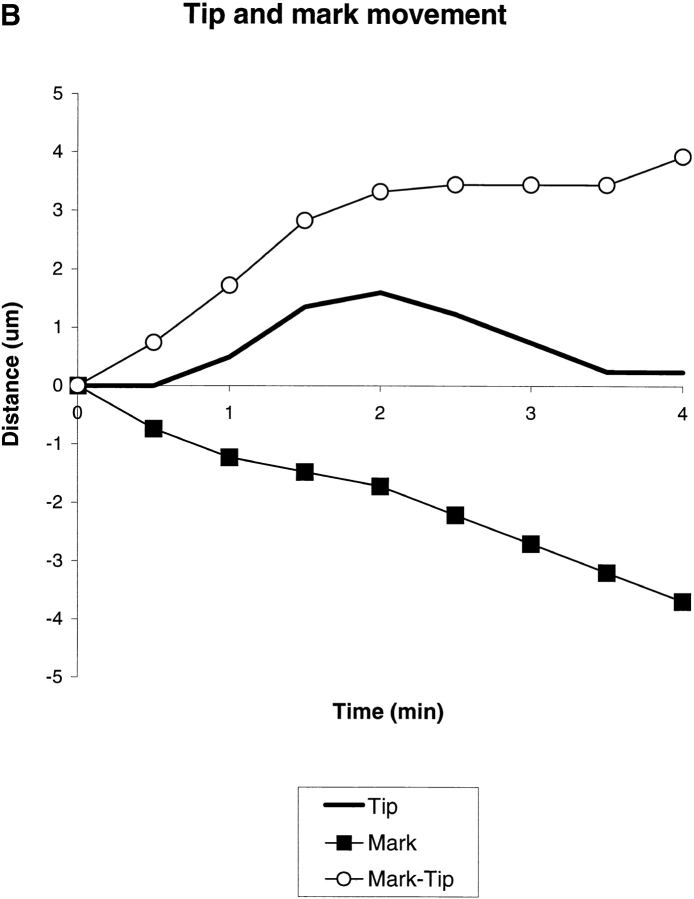
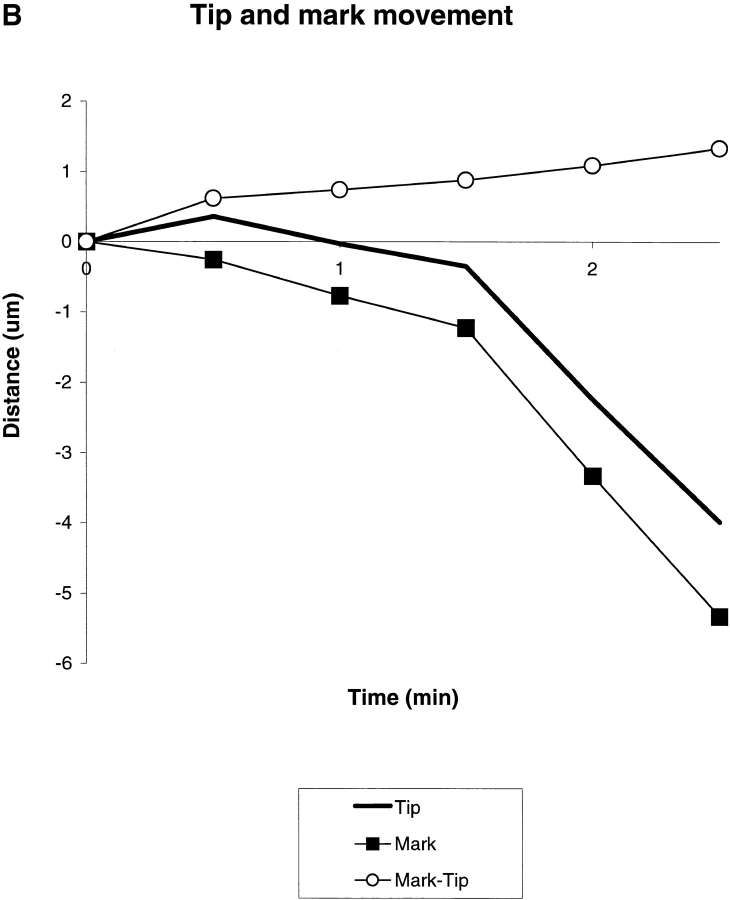
Fig. 2 A shows an example in which a filopodium switched from extension to retraction. In Fig. 2 B, we plot the changing distance of the mark (black squares) and filopodium tip (solid line) with respect to substrate as a function of time. From this graph, we see that the switch in filopodium tip movement is accompanied by an abrupt change in the cytoskeleton assembly rate. This type of regulation, where a change from extension to retraction or vice versa was caused primarily by a change in assembly rate while the flow rate remained constant, was observed most frequently (14/19).
Figure 2.
Example of regulation by cytoskeleton assembly rate. Q rhodamine photoactivation experiment. (Left) Phase-contrast; (middle) epi-fluorescence; and (right) combined image. The black line indicates the mark and the purple line the filopodium tip. Arrows denote a filopodium that retracts while the one above it extends. B, the mark, tip and mark to tip distances for the longest filopodium in A plotted as a function of time. Note that switching of this filopodium from extending to retracting is coincident with a change in the cytoskeleton assembly rate from ∼1.8 to ∼0 μm/min with flow approximate constant. Bar, 5 μm.
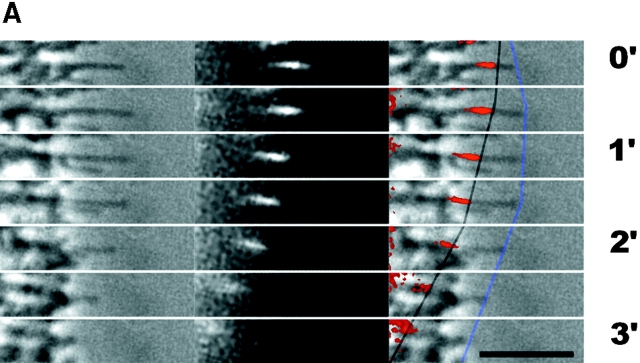
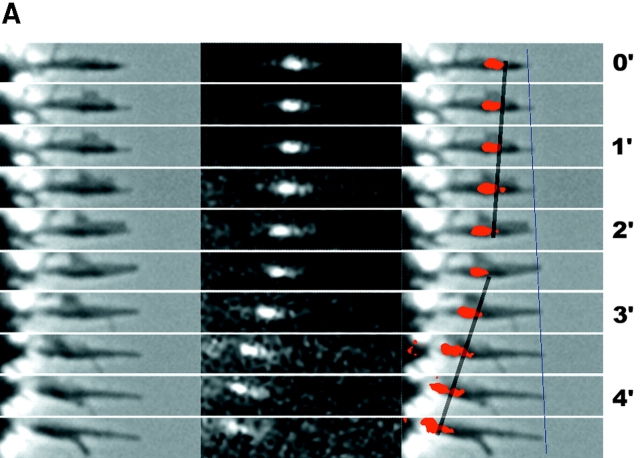
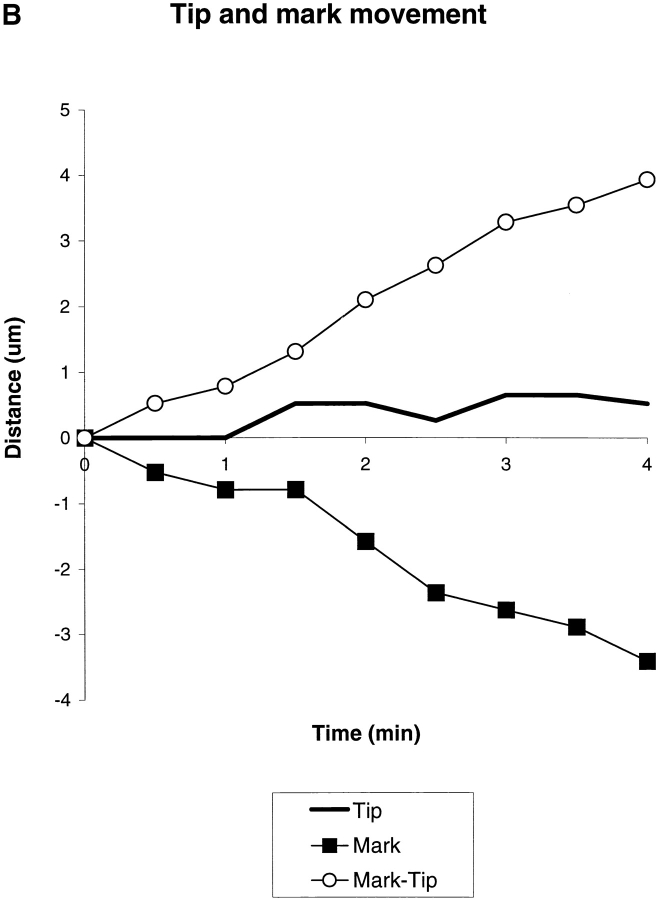
We also found a smaller number of examples in which changes in retrograde flow alone (n = 2), or both parameters (n = 3) contributed to a switch in filopodium tip movement. In Fig. 3 A, a filopodium changes from a stationary to retracting movement. Here, switches in movement of the tip (Fig. 3 A, blue lines) coincide primarily with changes in the rate of retrograde flow (dark lines). The plot in Fig. 3 B shows that the rate of cytoskeleton assembly (white circles) remains relatively constant over the course of the experiment. In Fig. 4, assembly and flow rates changed in equal and opposite directions, resulting in little change in the rate of filopodium movement. These results show that assembly and retrograde flow rates can vary independently of each other.
Figure 3.
Example of regulation by retrograde flow. This figure follows the layout of Fig. 2. Note that the change from slow retraction to fast retraction at 1.5 min in this example is coincident with an increase in flow rate while assembly remains approximately constant.
Figure 4.
Example of simultaneous regulation of assembly and flow rates. This figure follows the layout of Fig. 2. Note that the filopodium tip remains relatively stationary while both retrograde flow and actin assembly rate increase at 1.5 min.
The Predominant Determinant of Filopodium Movement Is Assembly Rate
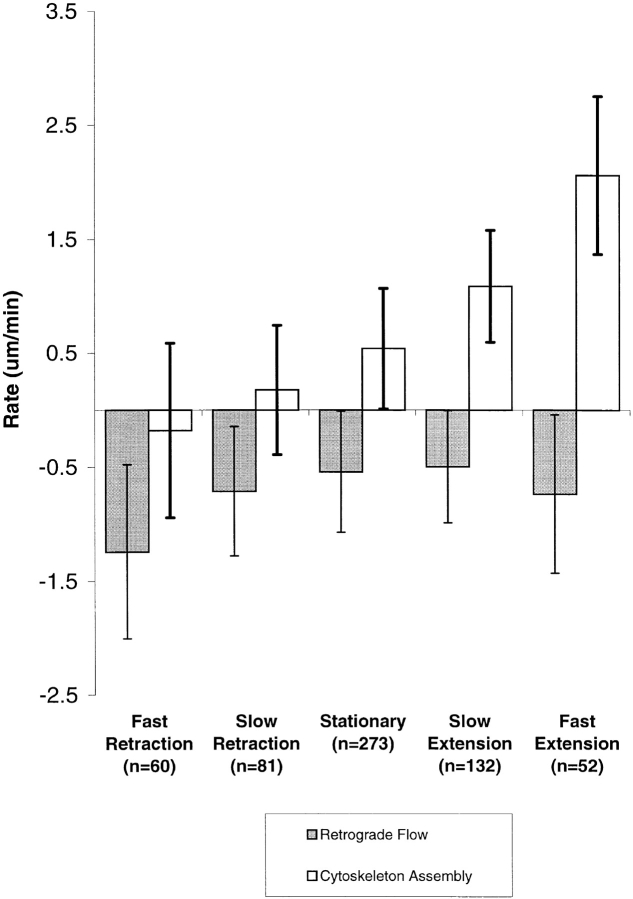
The results presented above demonstrate that cytoskeleton assembly and retrograde flow rates can vary within a single filopodium over time, and that the two parameters can be regulated independently. However, the cases where the filopodium tip switched from one consistent direction of movement to another during the experiment represent only a subset (19/75) of the filopodia studied. In most cases, the filopodium under observation extended or retracted continuously, though the rate might fluctuate. To summarize the contribution of assembly and flow rates to the direction and rate of filopodium tip movement for all our experiments, we grouped all our data by filopodium tip velocity and calculated average assembly and flow rates for each group (Fig. 5). An approximately linear relationship can be discerned between average actin assembly rate and tip velocity. In contrast, average flow rate was relatively constant for different tip velocities. The only exception was a significant change in flow rate to more negative values in rapidly retracting filopodia. Thus, on average for the data collected in this study, most of the variations in filopodium motility could be attributed to differences in the rates of actin cytoskeleton assembly while the flow rate was relatively constant.
Figure 5.
Average assembly and flow rates grouped by rates of filopodium movement. Tip movement, assembly, and flow rates were determined for individual bouts of filopodia movement for all observations, and arbitrarily grouped on the basis of tip movement as follows. Rapidly retracting: retracting at greater than −1 μm/min. Slowly retracting: between −1 and −0.3 μm/min. Stationary: between −0.3 and +0.3 μm/min. Slowly extending: between +0.3 and +1 μm/min. Rapidly extending: extending at any rate above +1 μm/min. Error bars are SD of the mean values in each group. For analysis, the rates of tip movement, assembly, and flow were measured between each time point (every 30 s) for each filopodium and grouped. Different periods of movement of a single filopodium might contribute to several different categories. The plot pools 587 individual time point measurements taken from 75 separate filopodia from 18 different sequences. 14 were Q-rhodamine photoactivation experiments and 4 were GFP-photobleaching experiments. We were unable to detect differences between these two groups of data examined separately.
We occasionally observed small decreases in the distance between the mark and the filopodium tip for rapidly retracting filopodia, as is apparent from the left in Fig. 5. This may indicate the occurrence of actin cytoskeleton disassembly at filopodium tips, or throughout the structure, in rapidly retracting filopodia. However, the average cytoskeleton assembly rate in rapidly retracting filopodia was not significantly different from zero, and individual sequences were ambiguous with respect to the question of tip disassembly because of limitations of spatial or temporal resolution.
The Rates of Actin Assembly and Retrograde Flow Vary Within a Single Growth Cone
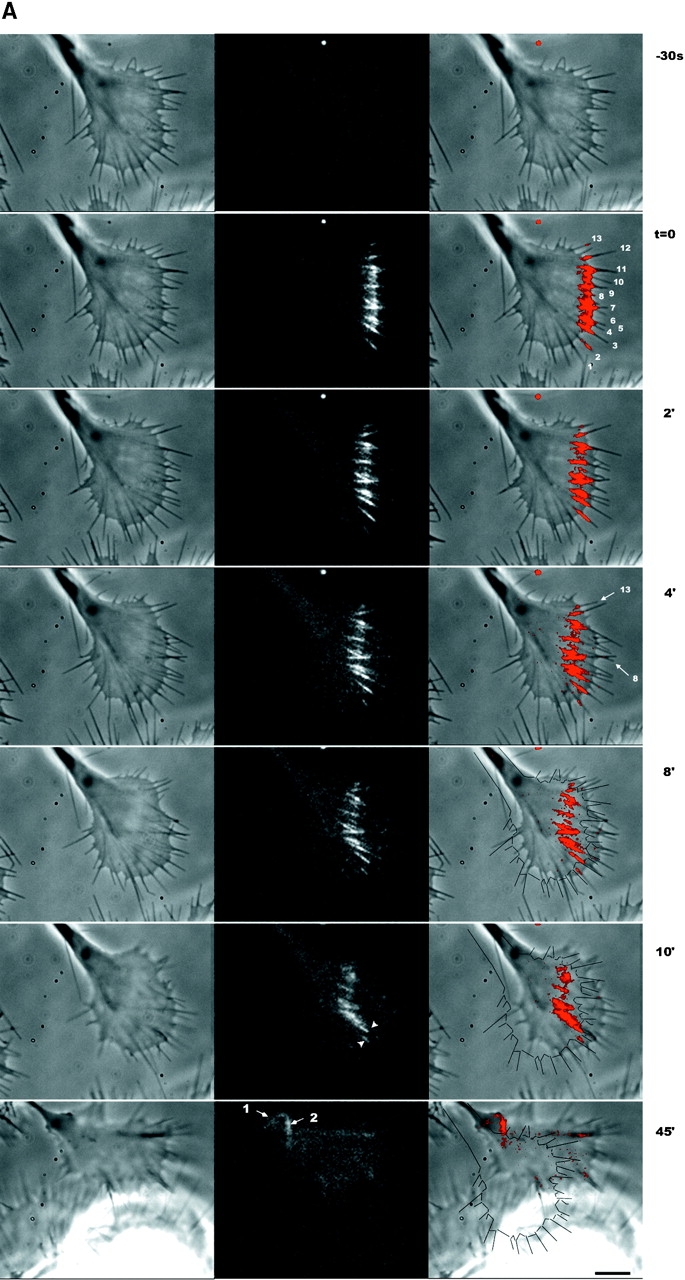
Growth cone turning requires differential regulation of motile or adhesive activities across a single growth cone, and it is well known that individual filopodia can behave differently within a single growth cones (Bray and Chapman, 1986; Myers and Bastiani 1993; Fig. 2 A, arrows). We sought to determine whether cytoskeleton assembly and retrograde flow could be regulated differently within a single growth cone. Fig. 6 A shows a growth cone in which several filopodia were marked simultaneously. Visual inspection of this sequence shows that retrograde flow rates vary between different filopodium bundles; marks on filopodia at the lower edge of the growth cone have moved a shorter distance than the marks above them (Fig. 6 A, arrowheads, middle, 10 min). Similarly, the change in distance between mark and tip varies between different filopodia, indicating different rates of cytoskeleton assembly; compare marks on filopodia 8 and 13 at t = 0 and 4 min.
Figure 6.
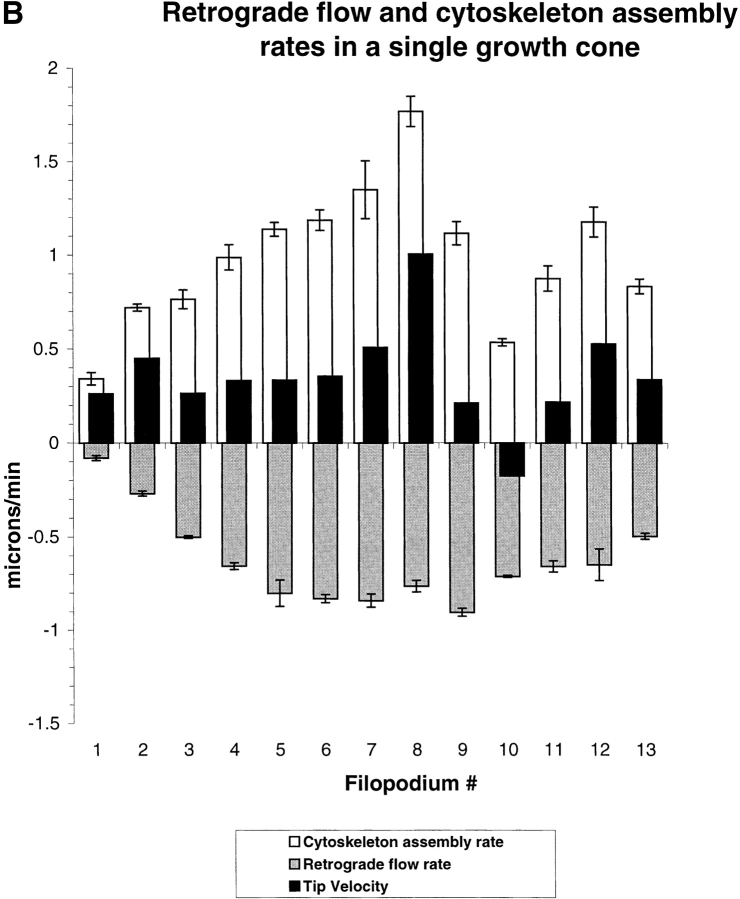
Actin dynamics vary between filopodia in a single growth cone. By following photoactivation marks on multiple filopodia in single growth cones we measured spatial variation in dynamics parameters. (A) Phase-contrast (left), fluorescence (middle), and combined (right) images. The outline of the growth cone at t = 0 are drawn on the combined image at 8–45 min. Photoactivation marks were made at t = − 0.3 min and again at t = 15 min. Arrows in t = 45 min indicate the remaining zones of marked actin from the first (1) and second (2) marking. Note that marks made near the top of the growth cone flow backward faster than marks made near the bottom. Arrowheads at 10 min indicate a zone of slow relatively slow flow. A typical feature of long sequences, apparent here, is the coalescing of filopodium actin bundles as they flow toward the neck of the growth cone. At t = 45 min, actin filaments marked at the tip are still visible and have been transported to the neck of the growth cone where they undergo lateral compression. From this sequence, we tracked mark and tip movements for 13 individual filopodia (indicated with numbers at t = 0, right column) over the course of 10 min and determined average assembly and flow rates by linear regression. (B) Average tip movement (black bars), assembly (white bars), and flow (gray bars) rates for the individual filopodia numbered as in A. Error bars indicate the SD of the regression coefficients, a measure dominated by temporal variation in dynamics. Bar, 5 μM.
We determined assembly and flow rates for 13 filopodia in this growth cone, labeled in Fig. 6 A, t = 0, right column. The bar chart in Fig. 6 B compares cytoskeleton assembly and retrograde flow rates for these filopodia. Cytoskeleton assembly rate varied between 0.34 and 1.77 μm/min (average = 1.0 μm/min). Retrograde flow rates varied between −0.08 and −0.90 μm/min (average = 0.63 μm/min). We performed a similar analysis on six other cells in which we had created marks on multiple filopodia, and each of these showed variable flow and assembly rates across the growth cone.
Filopodium Actin Bundles Are Unusually Stable
One striking feature of our data that is readily apparent in Fig. 6 A is the long lifetime of photoactivation marks in filopodia. The remarkable stability of filaments in these bundles allowed us to observe the rearward transport of filaments deep into the growth cone body where they coalesced with filaments from other bundles (Fig. 6 A, arrows, 45 min). We estimated the half-life of actin filaments generated in filopodia to be at least 25 min in our experiments. This contrasts sharply with actin filaments in lamellipodia of other cell types that have been reported to display a half-life on the order of 0.5–3 min using rhodamine bleaching (Wang 1985) and resorufin photoactivation (Theriot and Mitchison 1991, Theriot and Mitchison 1992). To assay turnover in lamellipodia with the same probe we used for filopodia, we marked caged Q-rhodamine actin in fan-shaped lamellipodial of our cells (Fig. 7 A). Lamellipodia were identified by their lack of filopodia, and active ruffling behavior in phase-contrast. Such lamellipodia occur frequently in NG108 cells under our conditions, and we often observed spontaneous transitions between filopodial and lamellipodial growth cones morphologies. Rapid actin filament turnover, with a half-life in the range of 1–3 min, was observed in lamellipodia (n = 3). Similar results were obtained using GFP-actin photobleaching. Indeed, photobleached marks were very difficult to follow in lamellipodia because of rapid turnover (not shown). Thus, the stability of the filopodium bundles in the growth cones we imaged is due to cellular factors that stabilize actin filaments and not to an artifact of the new probe used in this study.
Figure 7.
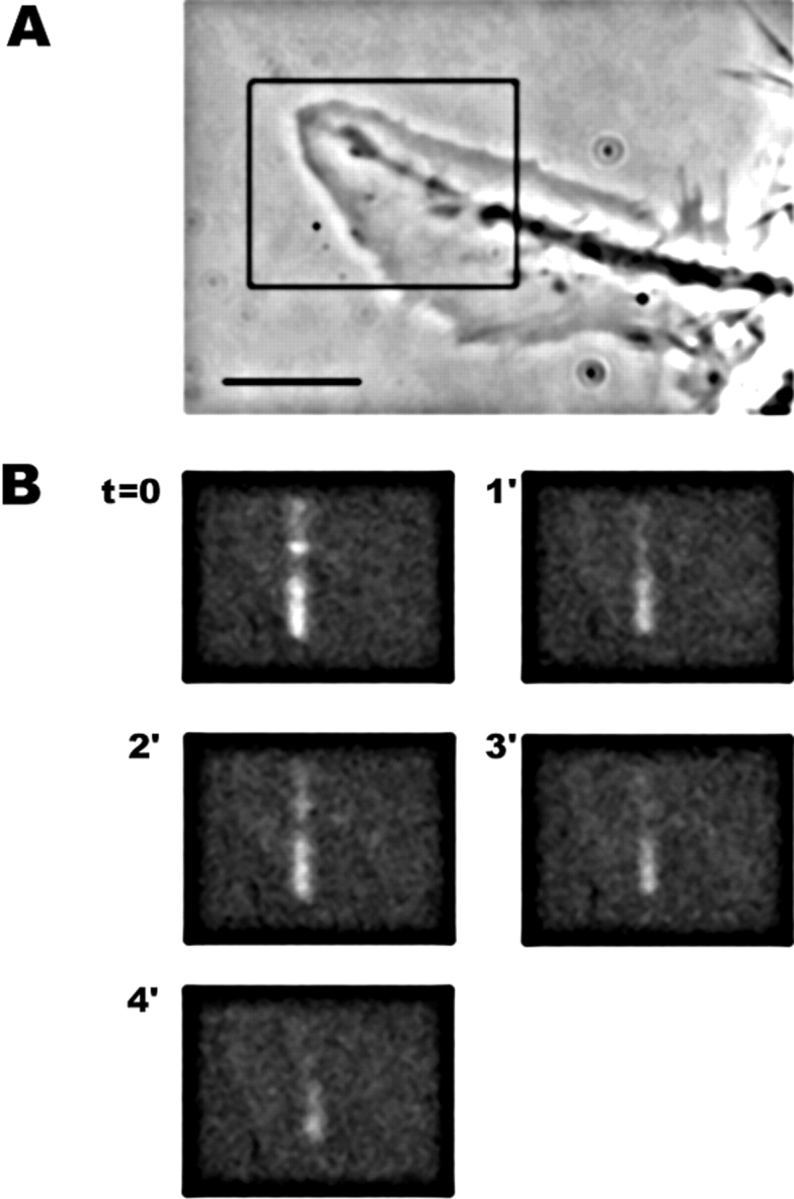
Photoactivation of a lamellipodium. (A) Phase-contrast and (B) fluorescence. NG108 cells often formed lamellipodia, characterized by lack of long filopodia and ruffling behavior. Photoactivation marks on lamellipodia disappeared quickly, indicating fast actin filament turnover compared with filopodia.
Discussion
Our results support a model for filopodium dynamics (Fig. 8) in which cytoskeleton assembly at the tip and retrograde flow are regulated independently, with filopodium extension/retraction resulting from the difference between the two rates. Within the error of our measurements, we found that marks in filopodia always moved rearward or were static, and that they remained of constant length and constant or slowly diminishing intensity. Thus, we strongly disfavor models for filopodium extension involving forward transport or outward telescoping of filaments and models for filopodium retraction involving inward telescoping. Our data are ambiguous on models for retraction involving cytoskeleton disassembly at tips and/or crumbling of the whole filament bundle. Most retraction in our study is accounted for by the action of retrograde flow with zero or slow assembly, but not disassembly, at the tip. Systematic studies of actin dynamics in rapidly retracting filopodia, for example in growth cones responding to collapsing factors (Fan and Raper 1995), are needed to test whether tip disassembly and/or crumbling are important physiological retraction mechanisms.
Figure 8.
Model for regulation of actin dynamics in filopodia. Chevrons indicate actin monomers, with filaments oriented barbed end distal. Assembly is driven by actin polymerization at the tip, presumably regulated by factors that influence polymerization rate. Flow is driven by motors pulling on the filaments, though the precise identity of the motors, and what they pull relative to, is unknown. Flow is presumably regulated by direct regulation of the motors and/or coupling of actin filaments to the substrate via adhesion systems. Assembly and flow can be regulated independently: temporally within a single filopodium and spatially between filopodia within a growth cone. In our data set, assembly rate varied frequently while the flow rate was more constant (Fig. 5). Thus, the direction and rate of filopodium tip movement was governed primarily by assembly rate.
We observed instances in which changes in the extension rate of an individual filopodium were governed by changes in either assembly or flow rates and some cases where both parameters changed concurrently. However on average (Fig. 5), we found that regulation of assembly was the dominant influence on filopodium extension rate in our study. It is not clear whether flow or assembly regulation will dominate during pathfinding in embryos. Most likely both will be important, with their relative contribution varying according to the specific situation.
Although assembly and flow can be regulated independently, they may be coupled under conditions where the filopodium maintains constant length (Forscher and Smith 1988; Katoh et al. 1999). Many of the filopodia in our data set were stationary with assembly exactly balancing flow (Fig. 5). Such coupling most likely results from unknown molecular mechanisms that make flow rate limiting for assembly or vice versa.
Molecular Regulation of Filopodium Dynamics
Cytoskeleton assembly and retrograde flow represent distinct molecular processes, and, thus, are likely to be regulated by distinct mechanisms. Independent regulation of assembly and flow allows for considerable flexibility in control of growth cone behavior by signaling and adhesion pathways. What are the likely mechanisms for regulating the two processes? Cytoskeleton assembly is thought to be driven by actin polymerization, though whether polymerization itself generates the force to extend the membrane forward is controversial (Mitchison and Cramer 1996). Cytoskeleton assembly is, thus, likely to be regulated by molecules that affect the rate of actin polymerization, such as barbed end cappers, polymerization factors, or actin monomer sequestering agents (Pollard and Cooper 1986). We think that regulators of nucleation and pointed end dynamics, notably the arp2/3 complex, are less likely to be involved (discussed below). Since actin polymerization occurs right at the tip of the filopodium, the signaling pathways regulating polymerization may also be localized to the tip. One intriguing piece of evidence supporting this view is the finding that stationary and extending filopodia are differentiated by the presence of a phosphotyrosine epitope at their tips (Wu and Goldberg 1993). Flow is thought to be generated by myosin activity (Lin et al. 1996), though in other cell types flowlike behavior may not be myosin driven (Cramer and Mitchison 1997) and in general flow is poorly understood. Flow is known to be regulated by adhesion molecules that couple the cytoskeleton to the substrate (Suter et al. 1998), and it is also likely that the motors that cause flow can be regulated directly.
There is now great interest in the mechanisms by which signaling pathways influence growth cone motility. Our experiments suggest that different pathways may control cytoskeleton assembly and retrograde flow. Obvious candidates for assembly regulation are the small GTPases cdc42 and rac since these two molecules are known to regulate actin polymerization in leading edge structures (Tapon and Hall 1997) and cdc42 is known to induce de novo filopodia formation via NWASP (Miki et al. 1998). NWASP is thought to function at least in part by activating Arp2/3 complex (Rohatgi et al. 1999), which in turn nucleates actin filaments and stabilizes pointed ends (Machesky and Gould 1999). Since actin filaments in filopodia are thought to be relatively long (Lewis and Bridgman 1992) and do not turn over rapidly (as shown here), we suspect that continued assembly at filopodium tips is regulated by control of elongation rather than nucleation. Thus, we favor a model in which arp2/3 functions in initiating new filopodia, a process recently described in detail in growth cones (Katoh et al. 1999), and not in regulating extension. Continuous action of arp2/3 is likely to be of more importance in lamellipodia, where filaments turn over rapidly and must be re-nucleated, than in filopodia. Factors that regulate actin filament elongation, such as capping factors (Heiss and Cooper, 1988; Matsuoka et al. 1998), and bundling/stability, such as filamin (Ohta et al. 1999), may regulate cytoskeleton assembly at filopodium tips. Candidates for flow regulation include cell adhesion molecules (Suter et al. 1998) and the small GTPase rho since the latter is thought to regulate myosin II activity in growth cones (Amano et al. 1998).
Implications for Growth Cone Turning
Growth cone turning is likely to be a complex process involving microtubule and membrane dynamics as well as actin dynamics, and it is likely that there are multiple ways of making a turn. Our data allow limited new conclusions about the role of actin dynamics in filopodia in turning growth cones. Differential extension/retraction of individual filopodia within a single growth is known to play a key role in turning (Bentley and O'Connor 1994). We can add that differential extension/retraction can be caused by differential regulation of both cytoskeleton assembly and flow by mechanisms that can act autonomously in single filopodia. Assembly regulation in particular seems to vary widely between filopodia within a single growth cone (Fig. 5 and Fig. 6). Since assembly occurs right at the tip, the signals that regulate it autonomously in individual filopodia also may well be generated at or near the filopodium tip. Control of assembly at the tip will influence the stability and mechanics of the whole filopodium, and can, thus, transmit a mechanical signal back to the growth cone. During axonal pathfinding, a single filopodium whose tip contacts a distant guidance cue can induce turning of the whole growth cone (O'Connor et al. 1990). Dissection of the molecular pathways that can act autonomously within a single filopodium in response to guidance cues to govern cytoskeleton assembly rate at the tip, presumably through regulating actin polymerization onto existing barbed ends, should be informative about physiological guidance mechanisms.
Acknowledgments
We thank Justin Yarrow (Harvard Medical School) for his participation in the GFP-photobleaching experiments, Jim Horne (Harvard Medical School) and Dave McVay (University of California San Francisco) for machining, Gerard Marriott (Max Planck Institute, Martinsried, Germany) for the GFP-actin plasmid, David Julius and Neil Smalheiser (both from University of California San Francisco) for NG108 cells, and Rebecca Ward for help in writing.
This work was supported by National Institutes of Health GM48027 to T.J. Mitchison.
Footnotes
1.used in this paper: caged Q-rhodamine; α-carboxy-dimethoxy-C2QRD-IA; GFP, green fluorescent protein
References
- Amano M., Chihara K., Nakamura N., Fukata Y., Yano T., Shibata M., Ikebe M., Kaibuchi K. Myosin II activation promotes neurite retraction during the action of Rho and Rho-kinase. Genes Cells. 1998;3:177–188. doi: 10.1046/j.1365-2443.1998.00181.x. [DOI] [PubMed] [Google Scholar]
- Bentley D., Toroian-Raymond A. Disoriented pathfinding by pioneer neuron growth cone deprived of filopodia by cytochalasin treatment. Nature. 1986;323:712–715. doi: 10.1038/323712a0. [DOI] [PubMed] [Google Scholar]
- Bentley D., O'Connor T.P. Cytoskeletal events in growth cone steering. Curr. Opin. Neurobiol. 1994;4:43–48. doi: 10.1016/0959-4388(94)90030-2. [DOI] [PubMed] [Google Scholar]
- Bray D., Chapman K. Analysis of microspike movements on the neuronal growth cone. J. Neurosci. 1985;5:3204–3213. doi: 10.1523/JNEUROSCI.05-12-03204.1985. [DOI] [PMC free article] [PubMed] [Google Scholar]
- Choidas A., Jungbluth A., Sechi A., Murphy J., Ullrich A., Marriott G. The suitability and application of a GFP-actin fusion protein for long-term imaging of the organization and dynamics of the cytoskeleton in mammalian cells. Eur. J. Cell Biol. 1998;77:81–90. doi: 10.1016/S0171-9335(98)80075-7. [DOI] [PubMed] [Google Scholar]
- Cramer L.P., Mitchison T.J. Investigation of the mechanism of retraction of the cell margin and rearwards flow of nodules during mitotic cell rounding. Mol. Biol. Cell. 1997;8:109–119. doi: 10.1091/mbc.8.1.109. [DOI] [PMC free article] [PubMed] [Google Scholar]
- Davenport R.W., Dou P., Rehder V., Kater S.B. A sensory role for neuronal growth cone filopodia. Nature. 1993;361:721–724. doi: 10.1038/361721a0. [DOI] [PubMed] [Google Scholar]
- Fan J., Raper J.A. Localized collapsing cues can steer growth cones without inducing their full collapse. Neuron. 1995;14:263–274. doi: 10.1016/0896-6273(95)90284-8. [DOI] [PubMed] [Google Scholar]
- Forscher P., Smith S.J. Actions of cytochalasins on the organization of actin filaments and microtubules in a neuronal growth cone. J. Cell Biol. 1988;107:1505–1516. doi: 10.1083/jcb.107.4.1505. [DOI] [PMC free article] [PubMed] [Google Scholar]
- Furuya S., Furuya K. Ultrastructural changes in differentiating neuroblastoma X glioma hybrid cells. Tissue Cell. 1983;15:903–919. doi: 10.1016/0040-8166(83)90057-5. [DOI] [PubMed] [Google Scholar]
- Gundersen R.W., Barrett J.N. Characterization of the turning response of dorsal root neurites toward nerve growth factor. J. Cell Biol. 1980;87:546–554. doi: 10.1083/jcb.87.3.546. [DOI] [PMC free article] [PubMed] [Google Scholar]
- Heidemann S.R., Lamoureux P., Buxbaum R.E. Growth cone behavior and production of traction force. J. Cell Biol. 1990;111:1949–1957. doi: 10.1083/jcb.111.5.1949. [DOI] [PMC free article] [PubMed] [Google Scholar]
- Heiss S.G., Cooper J.A. Regulation of CapZ, an actin capping protein of chicken muscle, by anionic phospholipids. Biochemistry. 1990;30:8753–8758. doi: 10.1021/bi00100a006. [DOI] [PubMed] [Google Scholar]
- Katoh K., Hammer K., Smith P.J.S., Oldenbourg R. Birefringence imaging directly reveals architectural dynamics of filamentous actin in living growth cones. Mol. Biol. Cell. 1999;10:197–210. doi: 10.1091/mbc.10.1.197. [DOI] [PMC free article] [PubMed] [Google Scholar]
- Keshishian H., Bentley D. Embryogenesis of peripheral nerve pathways in grasshopper legs. I. The initial nerve pathway to the CNS. Dev. Biol. 1983;96:89–102. doi: 10.1016/0012-1606(83)90314-7. [DOI] [PubMed] [Google Scholar]
- Lewis A.K., Bridgman P.C. Nerve growth cone lamellipodia contain two populations of actin filaments that differ in organization and polarity. J. Cell Biol. 1992;119:1219–1243. doi: 10.1083/jcb.119.5.1219. [DOI] [PMC free article] [PubMed] [Google Scholar]
- Lin C.H., Espreafico E.M., Mooseker M.S., Forscher P. Myosin drives retrograde F-actin flow in neuronal growth cones. Neuron. 1996;16:769–782. doi: 10.1016/s0896-6273(00)80097-5. [DOI] [PubMed] [Google Scholar]
- Machesky L.M., Gould K.L. The Arp2/3 complexa multifunctional actin organizer. Curr. Opin. Cell Biol. 1999;11:117–121. doi: 10.1016/s0955-0674(99)80014-3. [DOI] [PubMed] [Google Scholar]
- Maniatis J., Fritsch E.F., Maniatis T. Molecular Cloning. A Laboratory Manual. Vol. 3 1989. Cold Spring Harbor Press; Cold Spring Harbor, NY: 33–16.36 . pp. 16 [Google Scholar]
- Matsuoka Y., Li X., Bennett V. Adducin is an in vivo substrate for protein kinase Cphosphorylation in the MARCKS-related domain inhibits activity in promoting spectrin–actin complexes and occurs in many cells, including dendritic spines of neurons. J. Cell Biol. 1998;142:485–497. doi: 10.1083/jcb.142.2.485. [DOI] [PMC free article] [PubMed] [Google Scholar]
- Miki H., Sasaki T., Takai Y., Takenawa T. Induction of filopodium formation by a WASP-related actin-depolymerizing protein N-WASP. Nature. 1998;391:93–96. doi: 10.1038/34208. [DOI] [PubMed] [Google Scholar]
- Mitchison T., Kirschner M. Cytoskeletal dynamics and nerve growth. Neuron. 1988;1:761–772. doi: 10.1016/0896-6273(88)90124-9. [DOI] [PubMed] [Google Scholar]
- Mitchison T.J., Cramer L.P. Actin-based cell motility and cell locomotion. Cell. 1996;84:371–379. doi: 10.1016/s0092-8674(00)81281-7. [DOI] [PubMed] [Google Scholar]
- Mitchison T.J., Sawin K.E., Theriot J.A., Gee K., Mallavarapu A. Caged fluorescent probes. Methods Enzymol. 1998;291:63–78. doi: 10.1016/s0076-6879(98)91007-2. [DOI] [PubMed] [Google Scholar]
- Myers P.Z., Bastiani M.J. Growth cone dynamics during the migration of an identified commissural growth cone. J. Neurosci. 1993;13:127–143. doi: 10.1523/JNEUROSCI.13-01-00127.1993. [DOI] [PMC free article] [PubMed] [Google Scholar]
- O'Connor T.P., Duerr J.S., Bentley D. Pioneer growth cone steering decisions mediated by single filopodium contacts in situ. J. Neurosci. 1990;10:3935–3946. doi: 10.1523/JNEUROSCI.10-12-03935.1990. [DOI] [PMC free article] [PubMed] [Google Scholar]
- Ohta Y., Suzuki N., Nakamura S., Hartwig J.H., Stossel T.P. The small GTPase RalA targets filamin to induce filopodia. Proc. Natl. Acad. Sci. USA. 1999;96:2122–2128. doi: 10.1073/pnas.96.5.2122. [DOI] [PMC free article] [PubMed] [Google Scholar]
- Okabe S., Hirokawa N. Actin dynamics in growth cones. J. Neurosci. 1991;11:1918–1929. doi: 10.1523/JNEUROSCI.11-07-01918.1991. [DOI] [PMC free article] [PubMed] [Google Scholar]
- Pollard T.D., Cooper J.A. Actin and actin-binding proteins. A critical evaluation of mechanisms and functions. Annu. Rev. Biochem. 1986;55:987–1035. doi: 10.1146/annurev.bi.55.070186.005011. [DOI] [PubMed] [Google Scholar]
- Rohatgi R., Ma L., Miki H., Lopez M., Kirchhausen T., Takenawa T., Kirschner M.W. The interaction between N-WASP and the Arp2/3 complex links Cdc42-dependent signals to actin assembly. Cell. 1999;97:221–231. doi: 10.1016/s0092-8674(00)80732-1. [DOI] [PubMed] [Google Scholar]
- Sabry J.H., O'Connor T.P., Evans L., Toroian-Raymond A., Kirschner M., Bentley D. Microtubule behavior during guidance of pioneer neuron growth cones in situ. J. Cell Biol. 1991;115:381–395. doi: 10.1083/jcb.115.2.381. [DOI] [PMC free article] [PubMed] [Google Scholar]
- Suter D.M., Errante L.D., Belotserkovsky V., Forscher P. The Ig superfamily cell adhesion molecule, apCAM, mediates growth cone steering by substrate–cytoskeletal coupling. J. Cell Biol. 1998;141:227–240. doi: 10.1083/jcb.141.1.227. [DOI] [PMC free article] [PubMed] [Google Scholar]
- Tanaka E.M., Kirschner M.W. Microtubule behavior in the growth cones of living neurons during axon elongation. J. Cell Biol. 1991;115:345–363. doi: 10.1083/jcb.115.2.345. [DOI] [PMC free article] [PubMed] [Google Scholar]
- Tapon N., Hall A. Rho, Rac and Cdc42 GTPases regulate the organization of the actin cytoskeleton. Curr. Opin. Cell Biol. 1997;9:86–92. doi: 10.1016/s0955-0674(97)80156-1. [DOI] [PubMed] [Google Scholar]
- Theriot J.A., Mitchison T.J. Actin microfilament dynamics in locomoting cells. Nature. 1991;352:126–131. doi: 10.1038/352126a0. [DOI] [PubMed] [Google Scholar]
- Theriot J.A., Mitchison T.J. Comparison of actin and cell surface dynamics in motile fibroblasts. J. Cell Biol. 1992;118:367–377. doi: 10.1083/jcb.119.2.367. [DOI] [PMC free article] [PubMed] [Google Scholar]
- Wang Y.L. Exchange of actin subunits at the leading edge of living fibroblastspossible role of treadmilling. J. Cell Biol. 1985;101:597–602. doi: 10.1083/jcb.101.2.597. [DOI] [PMC free article] [PubMed] [Google Scholar]
- Waterman-Storer C.M., Desai A., Bulinski J.C., Salmon E.D. Fluorescent speckle microscopy, a method to visualize the dynamics of protein assemblies in living cells. Curr. Biol. 1998;8:1227–1230. doi: 10.1016/s0960-9822(07)00515-5. [DOI] [PubMed] [Google Scholar]
- Welch M.D., Mallavarapu A., Rosenblatt J., Mitchison T.J. Actin dynamics in vivo. Curr. Opin. Cell Biol. 1997;9:54–61. doi: 10.1016/s0955-0674(97)80152-4. [DOI] [PubMed] [Google Scholar]
- Wu D.Y., Goldberg D.J. Regulated tyrosine phosphorylation at the tips of growth cone filopodia. J. Cell Biol. 1993;123:653–664. doi: 10.1083/jcb.123.3.653. [DOI] [PMC free article] [PubMed] [Google Scholar]
- Zheng J.Q., Wan J.J., Poo M.M. Essential role of filopodia in chemotropic turning of nerve growth cone induced by a glutamate gradient. J. Neurosci. 1996;16:1140–1149. doi: 10.1523/JNEUROSCI.16-03-01140.1996. [DOI] [PMC free article] [PubMed] [Google Scholar]


