

Abstract
Functional magnetic resonance imaging is widely used to detect and delineate regions of the brain that change their level of activation in response to specific stimuli and tasks. Simple activation maps depict only the average level of engagement of different regions within distributed systems. FMRI potentially can reveal additional information about the degree by which components of large-scale neural systems are functionally coupled together to achieve specific tasks. In order to better understand how brain regions contribute to functionally connected circuits, it is necessary to record activation maps either as a function of different conditions, at different times or in different subjects. Data obtained under different conditions may then be analyzed by a variety of techniques to infer correlations and couplings between nodes in networks. Several different multivariate statistical methods have been adapted and applied to analyze the variations within such data. An approach of particular interest that is suited to studies of connectivity within single subjects makes use of acquisitions of runs of MRI images obtained while the brain is in a so-called steady state, either at rest (i.e. without any specific stimulus or task) or in a condition of continuous activation. The interregional correlations between fluctuations of MRI signal potentially reveal functional connectivity. Recent studies have established that interregional correlations between different components of circuits in each of the visual, language, motor and working memory systems can be detected in the resting state. The correlations at baseline are changed during the performance of a continuous task. In this review the various methods available for assessing connectivity are described and evaluated.
Introduction
Functional magnetic resonance imaging (fMRI) is well established as a method for the detection and delineation of regions of the brain that change their level of activation in response to specific experimental conditions. FMRI studies typically use “snapshot” imaging methods such as echo-planar sequences that are sensitive to changes in the blood oxygenation level dependent (BOLD) signal that reflects neuronal activation, albeit indirectly [1]. FMRI studies produce activation maps which typically depict the average level of engagement during a specific task or in response to a specific stimulus, of different regions in the brain. These may be compared between conditions or between subjects to evaluate the relative magnitudes of different responses. This is the basis of using fMRI for brain mapping and for comparing the activation patterns produced by different stimuli or between groups. However, appropriate fMRI data may also be analyzed in greater depth to reveal how components of large-scale distributed neural systems are coupled together in performing specific functions. The organization, inter-relationship and integrated performance of these different regions is generally described by the term “functional connectivity.”
For this review we will restrict our use of “functional connectivity” to mean the quantification of the operational interactions of multiple spatially-distinct brain regions that are engaged simultaneously in a task. We will further restrict our discussion to connectivity measures derived from fMRI activation data alone. Currently, there is no consensus on the most accurate or efficient method of detecting or measuring functional connectivity using fMRI [2], though there is considerable interest and activity in this field. However, while specific analytic techniques vary, a common feature of multiple fMRI assessments of connectivity is the use of correlations or covariances of activities derived from BOLD data. The objectives of this article are to introduce and explain several types of analyses that have been proposed that attempt to quantify connectivity using such statistical properties. In addition, we will discuss the origins and nature of three primary sources of variance in these data; inter-subject variance, task-related variance and intrinsic or steady-state variance. Finally, we will identify some confounding factors in the measurement of functional connectivity that may obfuscate conclusions in practical applications. We postulate that the ultimate value of fMRI in studies of brain function will depend not only on our ability to map activity patterns to reveal neural functional architecture, but also on our ability to understand how brain regions work together to accomplish specific tasks and behaviors. Methods for assessing functional connectivity are key for obtaining such insights.
Statistical Methods for the Analysis of Connectivity
Methodological approaches to the study of connectivity using BOLD data may be broadly divided into those that are more data-driven and attempt to map connectivity in the whole brain (Figure 1), and those that use prior knowledge or hypotheses to limit analysis to a restricted set of regions (Figure 2). The first category of methods includes seed-voxel correlation maps, Granger causality maps derived from bivariate autoregressive models [3], and psychophysiological interaction maps [4]. Other mapping techniques such as principal components analysis and some applications of partial least squares analysis create whole-brain maps of functional networks in which regions share some feature of interest. The alternative to these mapping techniques is to use a model that attempts to describe the relationships between a number of selected regions of interest, wherein region-specific measurements such as MRI time series are extracted from whole-brain data prior to the connectivity modeling stage. This category includes structural equation modeling [5] as well as multivariate autoregressive modeling [6]. Correlation, principal components analysis, and partial least squares methods may be applied in this way as well, but these are less common approaches.
Figure 1.

Several methods of mapping connectivity in the whole brain using fMRI time series data. Partial least squares is not shown; while it is also correlation or covariance-based, it typically uses a different and often more complex data matrix.
Figure 2.

Modeling effective connectivity between several regions identified on the basis of prior analysis or hypotheses. Conceptually, the procedure is similar for structural equation modeling (SEM) and multivariate autoregressive modeling (MAR). The most important difference is that directionality of the influences is an assumption of the model for SEM, but can potentially be determined from the data with MAR because of MAR's use of temporal information.
A second distinction may be made between methods that consider only correlation, and ignore issues of causation and influence, and those that attempt to describe or make inferences about the direction of influence between regions. These two categories of analysis are often referred to as functional and effective connectivity, respectively [7]. Techniques in the first group that consider only correlations between regions include mapping using seed voxel correlations, principal components analysis, and partial least squares methods. Techniques in the second group use more elaborate models and additional assumptions applied to calculated correlations or covariances to address questions about directional influences, and include mapping based on psychophysiological interactions, structural equation modeling, Granger causal mapping, and multivariate autoregressive modeling.
Seed-voxel correlation mapping is one of the simplest techniques for studying functional connectivity: the correlation coefficient between the fMRI signal at different times and measurements of the activation in a seed region is calculated separately for each voxel in the brain, and may be displayed as a parametric image. This approach has most commonly been applied to steady-state time series data, where the experimental condition does not change during an imaging run. It is possible to perform the seed voxel analysis iteratively, so that connectivity maps made using one seed region can be used to identify other regions to be used as subsequent seeds, after which the entire process can be started again [8]. This iterative approach can reveal networks of functionally connected regions that would otherwise remain unidentified.
The method of structural equation modeling (SEM) in essence takes a step beyond simply calculating correlations and allows the development of estimates of the directions of influences between variables. These estimates are typically calculated via a maximum likelihood procedure which iteratively adjusts the parameters of the assumed causal model until the predicted correlations match the correlations in the measured data as closely as possible. In a typical fMRI application, interconnections are specified between regions of interest based on prior anatomical knowledge or hypotheses, and the strengths of those connections are then estimated from the region time series data. The connection strengths, or path coefficients, can then be compared across experimental groups or conditions using a variety of statistical approaches. It is important to note that SEM cannot generally answer questions about the direction of influences between regions, but rather gives the strengths of influences assuming the specified causal structure is correct. Multiple regression models involving several regions, but with only a single dependent variable [9], are actually a special case of SEM. SEM has been used with fMRI data from a wide variety of experiments, including studies of visual attention [10-12], visual learning [12; 13], grammar learning [14], tone listening [15], semantic and episodic memory [16], working memory [17], reading [18], and finger movement [19; 20]. A number of variations of the technique have appeared, many differing in the precise method used for calculation of the correlation matrix (see [2] for a discussion). Some of these are intended to address specific weaknesses of the approach such as the mathematical constraints on the number of free parameters [18], or the failure of some models to account for the time dependence of fMRI data [21].
A psychophysiological interaction (PPI; [4]) is a stimulus- or context-dependent change in the influence of one brain region on another. A PPI can be identified using a linear regression model wherein a voxel's data are predicted by an influencing region's data, a predictor of stimulus-related signal changes, and the product of the two terms (the interaction). If the contribution of the interaction term to the voxel measurements is significant, that implies that the contribution of the influencing region depends on the experimental context – or alternatively, that the response of the voxel to the experimental stimuli depends on the activity in the influencing region. A PPI regression model is actually a special case of a structural equation model with only one dependent variable. Because only a single voxel is treated as dependent, statistical parametric maps of the significance of the interaction term may be constructed, allowing a whole-brain search for voxels that exhibit a context-dependent response to a particular influencing region. For example, PPIs have been used to identify abnormal changes of anterior cingulate connectivity during language experiments in schizophrenic patients [22], to clarify the role of putamen during self-initiated and externally-provoked finger movements [23], and to examine the role of the amygdala in response to fear signals [24].
Principal components analysis (PCA) decomposes a matrix of imaging data into a series of components. PCA may be applied within subject, where the data are repeated fMRI scans during an experimental run; or across subjects, where the data are subject summary measures such as average BOLD signal change for specific experimental conditions. The direction of maximal variance in the data is collected into the first principal component, where the spatial variation in signal is represented by an image called the eigenimage and the temporal or across-subject variation is represented in an associated vector, the eigenvector. Successively less prominent directions of variance are collected in subsequent components. PCA is thus a transformation of the data to a new coordinate system defined by the directions of largest variance of the data. The eigenimages can appear similar to standard fMRI activation maps, but the analysis is data-driven in that they do not depend on any model of the effects of stimulus on the signal. Instead the eigenimages capture intrinsic features of the data that are expressed in multiple regions that may constitute a widespread functional network (e.g. [25]). Each component's eigenvector shows how the common activity of the network varies over time, experimental condition, subject, or group. PCA is covariance-driven, because the eigenimages are produced through a singular value decomposition of the image data covariance matrix. Andersen et al [26] have outlined the underlying mathematics of PCA applied to fMRI in the context of primate pharmacological studies. PCA has been used with fMRI for a variety of investigations, including to differentiate visual processing and semantic analysis [27]; to study interacting areas responsible for the processing of metaphorical speech [28]; and to classify networks responsible for different aspects of visuospatial processing [29]. Two disadvantages of the approach are the difficulty of interpreting the many eigenimage/time course pairs that can be produced from fMRI data, typically one per time point; and the propensity of a single feature of interest to be “split” across multiple components, complicating interpretation further (see [26] for an example of this).
Partial least squares (PLS) is mathematically very similar to PCA, in that it also uses a singular value decomposition of a covariance or correlation matrix. But instead of looking at the covariance of the data with itself as PCA does, PLS examines the correlations of image data values with some other variables of interest (the “feature variables”). The feature variables are typically either dummy variables describing differences between experimental conditions; behavioral measures; or image data from specific seed regions. PLS produces images (the singular images, analogous to the eigenimages of PCA) and associated vectors of scores for each image; these are collectively called the latent variables (LVs). The image of each LV demarcates the brain regions whose common activity is represented in the score vectors. The particular interpretation of the scores depends on the feature variables used. When the feature variables are seed region data values, the singular images have the specific interpretation of brain areas functionally connected with the seed region. If behavioral measures or dummy variables are included also, examination of the score vectors will reveal how functional connectivity depends on task condition or behavior. PLS was introduced to neuroimaging in the context of PET rCBF brain imaging experiments by McIntosh et al. [30], and the extension to functional connectivity measurement was described soon after [31]. PLS has been used for PET functional connectivity studies of episodic memory [32], sensory learning [33; 34], and amygdala function [35], among others. A spatiotemporal variant of PLS has been developed for fMRI time series data [36] and applied to studies of autobiographical memory [37] and motion processing [38], for example.
Multivariate autoregressive models (MAR models) incorporate the cross-covariances between regions (covariances at multiple lags), and exploit the temporal relationships between different scans to permit conclusions about the predominant directions of influence between regions as well as their strength. For this reason the models are applied specifically to time series data. When a bivariate model is used, the influences of each individual voxel with a seed region can be summarized with three whole-brain maps: the strengths of the influences in both directions and a third component that cannot be assigned a directionality because of the lack of temporal resolution in the data. This is the Granger causality mapping approach of Goebel, Roebroeck and collaborators [3; 39]; the Granger causality measure is derived from the estimated parameters of the autoregressive model and summarizes the amount of variance in one region that is explained by the signal history of another region. In other words, when past values from voxel Y explain a portion of the signal in seed region X or vice versa, the temporal precedence suggests a causal relationship. An important caveat is the possibility of a common input or unmodeled factors which preclude a strictly causal interpretation of a directed influence discovered this way. If time series from more than two regions are included in a single multivariate AR model, rather than considering individual pairs of voxels in separate bivariate models, entire cognitive networks can be investigated in terms of the Granger causality or other measures of directed influence between regions (e.g. [6]; [40]). This approach can reduce but not eliminate the problem of unmodeled common inputs; there have been efforts to apply MAR modeling to all voxels at once, reducing the common input problem even further and using more of the acquired data [41; 42].
A few methods do not fit easily into the framework described above. Independent component analysis as a functional connectivity technique is somewhat similar to PCA in terms of results and interpretation, but assumes that the sources of the resulting features are statistically independent, not merely uncorrelated [43-45]. Dynamic causal modeling [46] incorporates a complete physical model for the underlying neural and hemodynamic physiology instead of considering correlations statistically. The data-driven Bayesian technique of [47] does take advantage of scan-to-scan changes in the data, but assigns each voxel a binary state (active or not active) at each point in time, then models the joint probability of activation for pairs of voxels; time series correlations are not considered directly.
Sources of Variance
The common feature of most of the above techniques is a dependence on the data underlying the calculation of correlation or covariance matrices. The results of a connectivity analysis in general will depend on the sources of variance used [48; 49]. The underlying variance may be a function of the deviation of a given measure across subjects, or the deviation of a repeated measurement within a subject across time. This temporal variance may be task-related or intrinsic in its nature. In practice, most studies by accident or design have actually included variance from multiple sources.
Inter-subject variance
The earliest studies of neural connectivity with hemodynamic imaging data used fluoro-deoxyglucose (FDG) autoradiographic measurements in rats, capitalizing on animal-to-animal variance: for each region of interest, FDG measurements for all animals were concatenated into a vector. The correlation matrix of all regions' vectors became the basis of connectivity calculations [5; 30; 50; 51]. The same method was later extended to PET data in humans, using subject-to-subject variance (e.g. [50]). This has been most used when only a limited number of samples could be taken from each subject, as when using a small number of PET scans. However, the subject-to-subject variance sometimes enters as a factor in an fMRI connectivity analysis along with task-related variance (e.g. [9; 52]) or intrinsic variance (e.g. [53]).
Task-related variance
Within-subject task-related variance may be explicitly included in several ways. Perhaps the most common for fMRI is to use time series data that include scans taken during more than one experimental condition. Rogers et al. [20] used finger-tapping and rest in a block design to study supplementary motor area connectivity during finger movement: connectivity measures were calculated separately for left and right hand conditions, in each case using data that included movement versus rest variation. A similar procedure has been used to study prefrontal connectivity during different levels of attention to movement [19; 54] and different types of free selection [55], using interaction terms in a structural equation model to quantify connectivity changes. A limitation of the approach is that connectivity is assumed to be constant within each of the two conditions; in other words, it is the average connectivity during both conditions that is measured. The related difficulties of interpretation can be ameliorated somewhat by using event-related designs where cognitive set is expected to be constant over time, even though stimuli change (e.g. [3; 56]). Within-subject trial-to-trial changes in the BOLD response have also been used for connectivity measurements (e.g. [57]), under the premise that two regions that exhibit similar changes from trial to trial in stimulus-related signal are acting as part of the same functional network.
Intrinsic variance
Procedures that use inter-subject, task-related, and trial-to-trial variations all in some way take advantage of changes in signal directly related to experimental stimuli changing across acquisitions. Another source of variance is intrinsic hemodynamic fluctuations that are not the result of specific stimuli. Covariance in these temporal BOLD signal fluctuations between brain regions has been interpreted as a marker of functional connectivity. Here, the oxygenation state of hemoglobin acts as a neurophysiological index reflecting common neural activity of different brain regions. Work with near infra-red spectroscopy techniques has confirmed that this fluctuation is not specific to fMRI [58; 59], and simultaneous measurement of fMRI and EEG data in subjects at rest has suggested that the oscillations arise from underlying spontaneous neuronal activity [60].
It was first demonstrated by Biswal et al. [61] that fluctuations in the BOLD signal are correlated between regions of the motor network, both within and across hemispheres of the brain at rest. A blocked design finger tapping task was performed to map regions used to execute the motor task, and it was between these regions that correlations were then evaluated using data acquired without task performance. This established the idea that co-incident increases in activity during task performance could correspond to significant correlations in the resting state. It has been shown that these networks exhibit covariance concentrated in the low temporal frequency spectrum around 0.1 Hz and below [62; 63] that arises more from changes in blood oxygenation and T2* than from changes in blood flow [64; 65]. Recently, Fox et al. [66] showed that regions with anti-correlated responses to a stimulus or cognitive task also exhibit anti-correlated BOLD signals in the resting state, which suggests that the intrinsic fluctuations reflect the same functional networks that become engaged during task performance.
This general technique has been used to map other networks. Hampson et al. used a similar approach to measure connectivity between Broca's and Wernicke's area in the language system [8] as well as connectivity to MT/V5 in the visual system [67]. Biswal's original inter-hemispheric results in motor cortex were reproduced by Lowe et al. [68], and a variety of image acquisition parameters were investigated for their effect on the interregional correlations. Connectivity to primary motor cortex measured throughout the brain showed similar results to other anatomical, histochemical, and physiological techniques, as shown by Xiong et al. [69]. This technique has been applied to other systems and regions, including subcortical nuclei [70].
Functional connectivity determined by the intrinsic temporal correlations may be affected by task conditions, as one brain region may perform a variety of functions. To investigate this intrinsic variance in BOLD signals, connectivity has been measured during steady-state performance of a task. In practice, the task is performed constantly and consistently over the course of time in which the images are acquired. This method attempts to minimize the variance introduced by individual trial to trial performance of the task itself. Several means have also been used to minimize task-related variance so as to study the intrinsic variations in block design or event-related experiments. A common technique, particularly for structural equation modeling studies, is to trim time series from block-design experiments by keeping only the volumes scanned during the condition of interest (e.g. [17; 71; 72]). An alternative is to use an entire time series after removing task-related components by some means such as independent component analysis [73] or linear regression – that is, calculating connectivity measures on the residuals after removing stimulus-related effects.
Lowe et al. [74] showed that measuring connectivity to a dorso-lateral prefontal cortex seed region can reveal different connectivity maps depending on the steady-state task performed during imaging. Using SEM-based techniques, Büchel and Friston [10] showed that connectivity can be modulated by attention. Fox et al. [75] showed that ventral and dorsal attention systems can be distinguished based on their low frequency correlations, though both are shown to correlate with regions in the prefrontal cortex. Morgan et al. [76] investigated the effect of steady-state task performance by analyzing interregional correlations in the motor system at rest as well as during steady-state sequential finger motion, and found no increase and perhaps a slight reduction of connectivity during task performance. [76]. However, other studies have found that engaging a network in a steady-state task may lead to increased correlations between regions [8; 67; 77].
Task load may affect functional connectivity measured using intrinsic variance. Increasing the rate of finger tapping can result in an increase in connectivity in the motor system [77], and working memory load affects connectivity to the anterior cingulate and prefrontal cortex (Figure 3, [78]). In studies of the areas engaged during working memory tasks, some data indicate that negatively correlated regions may become more negatively correlated as load increases [66; 78], suggesting that negative correlations may nonetheless correspond to some functional involvement in task performance. The relationship between changes in mean activity and changes in interregional correlations remains unclear.
Figure 3.
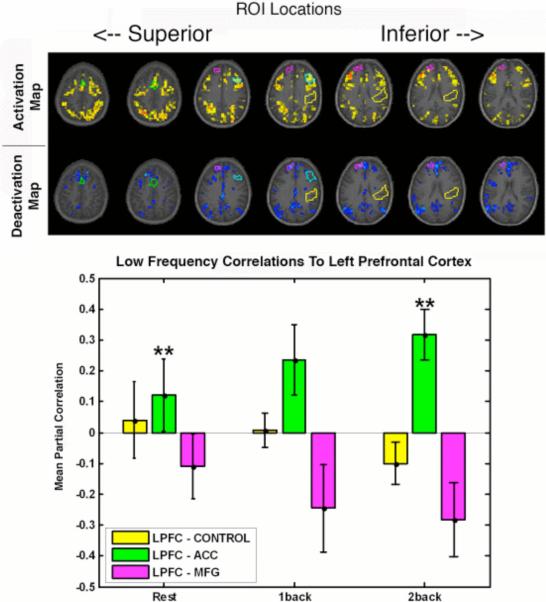
Regions of interest in the working memory system exhibit intrinsic connectivity that depends on memory load. In this example, regions were defined from working memory activation maps (top) and applied to data from continuous performance of the N-back task at different loads. Steady-state correlations with left prefrontal cortex (bottom) increased with load for anterior cingulate (ACC); decreased with load for a region in the medial frontal gyrus (MFG); and were unaffected by load in a control region. The MFG represents a region commonly appearing in deactivation maps and hypothesized to form part of a “default mode” network.
Functional connectivity assessed from interregional correlations of BOLD signal fluctuations appear to be correlated with behavioral measures and indicate skill or performance. Specifically, correlations have been found between the reading abilities of subjects and their functional connectivity between Broca's area and Brodmann's area 39 [79]. Similar work has been performed to track developmental neuroanatomical trajectories in boys and girls, showing correlations with IQ that differ between genders and between age ranges. [80], as well as to study dyslexia, where differences in the spatial extent of some networks were found in patients verses controls [81]. There is considerable potential value in measures of interregional functional connectivity if they can be related to specific cognitive abilities.
Functional connectivity measured using intrinsic variance has also been used to map cognitive systems in patient populations to reveal underlying mechanisms or side-effects of their pathology. It has been suggested that changes in functional connectivity can be used as an early marker of some diseases. Decreased correlations have been reported involving the hippocampus of patients with Alzheimer's disease [82; 83], the motor cortices and frontal regions of multiple sclerosis patients [84; 85], and the left hemisphere language network of left temporal lobe epilepsy patients [86]. Changes in functional connectivity have been detected in patients with schizophrenia [87; 88] and attention deficit hyperactivity disorder [89]. Some studies have found that connectivity changes can be associated with specific symptoms of disease, such as Lawrie et al. [90] who related reduced frontotemporal functional connectivity and severity of auditory hallucinations. Connectivity has even been associated with specific genotypes in a small population of depressed patients [91], and has shown drug treatment response [92]. However, normal-appearing functional connectivity does not necessarily mean that normal coupling between regions exists. For example, lesion studies where there is a known disruption in the physical connections between regions have shown that normal functional connectivity can still be measured between affected regions [93].
Functional connectivity can also be used to determine networks of regions that are not associated with known cognitive functions. The default-mode network of the brain described by Raichle et al [94], which includes the posterior cingulate cortex, the ventral anterior cingulate cortex, the hippocampus and the bilateral inferior parietal cortex, is postulated to support the baseline state of the brain at rest. Although the default network was first observed as decreases in BOLD activation during stimulus presentation compared to rest, it has subsequently been more extensively studied using functional connectivity methods. Greicius et al. [95] used two seed regions defined by working memory related deactivations to locate the network in resting data and during passive sensory processing using low frequency correlations. Interestingly, the network was not deactivated during the resting blocks, and therefore could not have been detected using this manner. The default-mode network has also been identified in stage 1 and stage 2 sleep conditions using functional connectivity to a seed region [96].
Confounding Factors
It is important to note potentially confounding factors that are known to affect connectivity measures. An example of this is the change in apparent functional connectivity in response to hypercapnia, where decreasing the oxygen content of inspired gases can decrease spontaneous low frequency fluctuations, which then return to normal as oxygen is restored [97]. Inter-regional correlations have also been modulated by anesthesia [98; 99].
One prominent confound in functional connectivity measurements is physiological noise in the BOLD signal, which can influence correlation measurements; in fact it dominates the signal at 3T [100]. This noise originates mainly from fluctuations in cerebral metabolism and blood flow as well as cardiac and respiratory [101] pulsatility. There has been much debate as to whether the correlations detected in functional connectivity were the direct result of this correlated noise rather than real indications of individual networks (e.g. [102; 103]). The use of short repetition times (TR) has been suggested to critically sample the large cardiac and respiratory noise for its removal [104]. However, this impedes the acquisition of full brain data and also may increase the noise in CSF regions where steady-state free precession variation artifacts are possible [105]. The choice of a TR longer than the cardiac rate, though, can result in cardiac signals being aliased into the low-frequencies investigated in functional connectivity. Kiviniemi et al. proposed the combined use of two image sampling rates to separate the aliased (noise) and the non-aliased (connectivity) signals [106]. Simultaneous monitoring of cardiac and respiratory signals allows the implementation of retrospective K-space based [107] and image-based methods [108] of noise correction at any TR. If those signals are not available, the time course from an artery has been successfully substituted for direct sampled physiological data [109]. These retrospective methods can be effective in handling the physiological noise, but it is important to consider signal changes for which adjustments cannot easily be made (e.g. [102; 110]). When any correction method is applied it is important that any signals of interest be asynchronous with the physiological noise.
The elusive concept of steady-state is also a confounding factor in these measurements. Even in a steady-state experiment with rapid repeated actions or stimuli, some component of the stimulus-related variance may survive the hemodynamic filter; for finger tapping, fatigue may have an effect over time, and for an N-back experiment the different responses to foils and targets may contribute. During the resting-state, of course, cognitive function is even less controlled. Measured hemodynamic variations are perhaps more reflective of the individual's baseline state of function, but likely include many components such as changes in arousal, visual imagery, internal dialogue, and so forth [111; 112].
Any effects that can create global signal changes can also artificially modulate measures of functional connectivity. These include gross head motions, physiological pulsations, and scanner drift [113]. Several methods for removing global effects have been proposed. Most of these methods assume a signal change of the same pattern in the same magnitude across the brain including the simple subtraction of average time course, partial correlations using the average global time course, to more complex methods using singular value decomposition [114]. However, Macey et al. developed a technique in which a linear model of the global signal is determined and removed from each voxel individually [115]. This method only assumes the same signal change pattern across the brain, not the same magnitude.
The confounds discussed here are only some of the many potential modulators of fMRI functional connectivity. The propensity for certain study designs to be more or less susceptible to each of these issues should be carefully considered prior to image acquisition. Strategies for the minimization of these artifacts may require prospective implementation such as measurements of heart rate and respiration; while others, like global effects removal, can be performed in the post-processing.
Conclusions
In this review, we have described and compared a number of analysis techniques that have been developed to probe the function of cognitive networks using the inter-subject, task-related, or intrinsic variations in BOLD fMRI signals. The specific experimental hypotheses and the appropriateness of various assumptions will drive the choice of methodology for any particular experiment. Functional MRI's unique contribution to the investigation and understanding of neural connectivity is its combined spatial and temporal resolution in a non-invasive technique. Although fMRI has temporal resolution less than the true speed of neural interactions, it provides whole-brain coverage at spatial resolutions of millimeters, and is an ideal tool for measuring the intrinsic, steady-state hemodynamic fluctuations within single subjects in particular. Evidence continues to accumulate that connectivity measures based on the hemodynamic fluctuations measurable by fMRI reflect meaningful aspects of cognitive processing in terms of task, load, behavior, and pathology or psychiatric diagnosis.
Footnotes
Publisher's Disclaimer: This is a PDF file of an unedited manuscript that has been accepted for publication. As a service to our customers we are providing this early version of the manuscript. The manuscript will undergo copyediting, typesetting, and review of the resulting proof before it is published in its final citable form. Please note that during the production process errors may be discovered which could affect the content, and all legal disclaimers that apply to the journal pertain.
References
- 1.Ogawa S, Lee TM, Kay AR, Tank DW. Brain magnetic resonance imaging with contrast dependent on blood oxygenation. Proc Natl Acad Sci U S A. 1990;87(24):9868–72. doi: 10.1073/pnas.87.24.9868. [DOI] [PMC free article] [PubMed] [Google Scholar]
- 2.Horwitz B. The elusive concept of brain connectivity. Neuroimage. 2003;19(2 Pt 1):466–70. doi: 10.1016/s1053-8119(03)00112-5. [DOI] [PubMed] [Google Scholar]
- 3.Goebel R, Roebroeck A, Kim DS, Formisano E. Investigating directed cortical interactions in time-resolved fMRI data using vector autoregressive modeling and Granger causality mapping. Magn Reson Imaging. 2003;21(10):1251–61. doi: 10.1016/j.mri.2003.08.026. [DOI] [PubMed] [Google Scholar]
- 4.Friston KJ, Buechel C, Fink GR, Morris J, Rolls E, Dolan RJ. Psychophysiological and modulatory interactions in neuroimaging. Neuroimage. 1997;6(3):218–29. doi: 10.1006/nimg.1997.0291. [DOI] [PubMed] [Google Scholar]
- 5.Gonzalez-Lima F, McIntosh AR. Structural equation modeling and its application to network analysis in functinoal brain imaging. Human Brain Mapping. 1994;2:2–22. [Google Scholar]
- 6.Harrison L, Penny WD, Friston K. Multivariate autoregressive modeling of fMRI time series. Neuroimage. 2003;19(4):1477–91. doi: 10.1016/s1053-8119(03)00160-5. [DOI] [PubMed] [Google Scholar]
- 7.Friston K, Frith CD, Frackowiak RS. TIme-Dependent Changes in Effective Connectivity Measured With PET. Hum Brain Mapp. 1993;(1):69–79. [Google Scholar]
- 8.Hampson M, Peterson BS, Skudlarski P, Gatenby JC, Gore JC. Detection of functional connectivity using temporal correlations in MR images. Hum Brain Mapp. 2002;15(4):247–62. doi: 10.1002/hbm.10022. [DOI] [PMC free article] [PubMed] [Google Scholar]
- 9.Pugh KR, Mencl WE, Shaywitz BA, Shaywitz SE, Fulbright RK, Constable RT, Skudlarski P, Marchione KE, Jenner AR, Fletcher JM. The angular gyrus in developmental dyslexia: task-specific differences in functional connectivity within posterior cortex. Psychol Sci. 2000;11(1):51–6. doi: 10.1111/1467-9280.00214. others. [DOI] [PubMed] [Google Scholar]
- 10.Buchel C, Friston KJ. Modulation of connectivity in visual pathways by attention: cortical interactions evaluated with structural equation modelling and fMRI. Cereb Cortex. 1997;7(8):768–78. doi: 10.1093/cercor/7.8.768. [DOI] [PubMed] [Google Scholar]
- 11.Chaminade T, Fonlupt P. Changes of effective connectivity between the lateral and medial parts of the prefrontal cortex during a visual task. Eur J Neurosci. 2003;18(3):675–9. doi: 10.1046/j.1460-9568.2003.02787.x. [DOI] [PubMed] [Google Scholar]
- 12.Buchel C, Coull JT, Friston KJ. The predictive value of changes in effective connectivity for human learning. Science. 1999;283(5407):1538–41. doi: 10.1126/science.283.5407.1538. [DOI] [PubMed] [Google Scholar]
- 13.Toni I, Rowe J, Stephan KE, Passingham RE. Changes of cortico-striatal effective connectivity during visuomotor learning. Cereb Cortex. 2002;12(10):1040–7. doi: 10.1093/cercor/12.10.1040. [DOI] [PubMed] [Google Scholar]
- 14.Fletcher P, Buchel C, Josephs O, Friston K, Dolan R. Learning-related neuronal responses in prefrontal cortex studied with functional neuroimaging. Cereb Cortex. 1999;9(2):168–78. doi: 10.1093/cercor/9.2.168. [DOI] [PubMed] [Google Scholar]
- 15.Goncalves MS, Hall DA, Johnsrude IS, Haggard MP. Can meaningful effective connectivities be obtained between auditory cortical regions? Neuroimage. 2001;14(6):1353–60. doi: 10.1006/nimg.2001.0954. [DOI] [PubMed] [Google Scholar]
- 16.Maguire EA. Neuroimaging, memory and the human hippocampus. Rev Neurol (Paris) 2001;157(8−9 Pt 1):791–4. [PubMed] [Google Scholar]
- 17.Honey GD, Fu CH, Kim J, Brammer MJ, Croudace TJ, Suckling J, Pich EM, Williams SC, Bullmore ET. Effects of verbal working memory load on corticocortical connectivity modeled by path analysis of functional magnetic resonance imaging data. Neuroimage. 2002;17(2):573–82. [PubMed] [Google Scholar]
- 18.Mechelli A, Penny WD, Price CJ, Gitelman DR, Friston KJ. Effective connectivity and intersubject variability: using a multisubject network to test differences and commonalities. Neuroimage. 2002;17(3):1459–69. doi: 10.1006/nimg.2002.1231. [DOI] [PubMed] [Google Scholar]
- 19.Rowe J, Friston K, Frackowiak R, Passingham R. Attention to action: specific modulation of corticocortical interactions in humans. Neuroimage. 2002;17(2):988–98. [PubMed] [Google Scholar]
- 20.Rogers BP, Carew JD, Meyerand ME. Hemispheric asymmetry in supplementary motor area connectivity during unilateral finger movements. Neuroimage. 2004;22(2):855–9. doi: 10.1016/j.neuroimage.2004.02.027. [DOI] [PubMed] [Google Scholar]
- 21.Kim J, Zhu W, Chang L, Bentler PM, Ernst T. Unified structural equation modeling approach for the analysis of multisubject, multivariate functional MRI data. Hum Brain Mapp. 2006 doi: 10.1002/hbm.20259. [DOI] [PMC free article] [PubMed] [Google Scholar]
- 22.Boksman K, Theberge J, Williamson P, Drost DJ, Malla A, Densmore M, Takhar J, Pavlosky W, Menon RS, Neufeld RW. A 4.0-T fMRI study of brain connectivity during word fluency in first-episode schizophrenia. Schizophr Res. 2005;75(2−3):247–63. doi: 10.1016/j.schres.2004.09.025. [DOI] [PubMed] [Google Scholar]
- 23.Taniwaki T, Okayama A, Yoshiura T, Nakamura Y, Goto Y, Kira J, Tobimatsu S. Reappraisal of the motor role of basal ganglia: a functional magnetic resonance image study. J Neurosci. 2003;23(8):3432–8. doi: 10.1523/JNEUROSCI.23-08-03432.2003. [DOI] [PMC free article] [PubMed] [Google Scholar]
- 24.Das P, Kemp AH, Liddell BJ, Brown KJ, Olivieri G, Peduto A, Gordon E, Williams LM. Pathways for fear perception: modulation of amygdala activity by thalamo-cortical systems. Neuroimage. 2005;26(1):141–8. doi: 10.1016/j.neuroimage.2005.01.049. [DOI] [PubMed] [Google Scholar]
- 25.Friston KJ, Frith CD, Liddle PF, Frackowiak RS. Functional connectivity: the principal-component analysis of large (PET) data sets. J Cereb Blood Flow Metab. 1993;13(1):5–14. doi: 10.1038/jcbfm.1993.4. [DOI] [PubMed] [Google Scholar]
- 26.Andersen AH, Gash DM, Avison MJ. Principal component analysis of the dynamic response measured by fMRI: a generalized linear systems framework. Magn Reson Imaging. 1999;17(6):795–815. doi: 10.1016/s0730-725x(99)00028-4. [DOI] [PubMed] [Google Scholar]
- 27.Bullmore ET, Rabe-Hesketh S, Morris RG, Williams SC, Gregory L, Gray JA, Brammer MJ. Functional magnetic resonance image analysis of a large-scale neurocognitive network. Neuroimage. 1996;4(1):16–33. doi: 10.1006/nimg.1996.0026. [DOI] [PubMed] [Google Scholar]
- 28.Mashal N, Faust M, Hendler T. The role of the right hemisphere in processing nonsalient metaphorical meanings: application of principal components analysis to fMRI data. Neuropsychologia. 2005;43(14):2084–100. doi: 10.1016/j.neuropsychologia.2005.03.019. [DOI] [PubMed] [Google Scholar]
- 29.Sugiura M, Watanabe J, Maeda Y, Matsue Y, Fukuda H, Kawashima R. Different roles of the frontal and parietal regions in memory-guided saccade: a PCA approach on time course of BOLD signal changes. Hum Brain Mapp. 2004;23(3):129–39. doi: 10.1002/hbm.20049. [DOI] [PMC free article] [PubMed] [Google Scholar]
- 30.McIntosh AR, Gonzalez-Lima F. Network analysis of functional auditory pathways mapped with fluorodeoxyglucose: associative effects of a tone conditioned as a Pavlovian excitor or inhibitor. Brain Res. 1993;627(1):129–40. doi: 10.1016/0006-8993(93)90756-d. [DOI] [PubMed] [Google Scholar]
- 31.McIntosh AR, Nyberg L, Bookstein FL, Tulving E. Differential functional connectivity of prefrontal and medial temporal cortices during episodic memory retrieval. Human Brain Mapping. 1997;5(4):323–7. doi: 10.1002/(SICI)1097-0193(1997)5:4<323::AID-HBM20>3.0.CO;2-D. [DOI] [PubMed] [Google Scholar]
- 32.Nyberg L, Persson J, Habib R, Tulving E, McIntosh AR, Cabeza R, Houle S. Large scale neurocognitive networks underlying episodic memory. J Cogn Neurosci. 2000;12(1):163–73. doi: 10.1162/089892900561805. [DOI] [PubMed] [Google Scholar]
- 33.McIntosh AR, Rajah MN, Lobaugh NJ. Interactions of prefrontal cortex in relation to awareness in sensory learning. Science. 1999;284(5419):1531–3. doi: 10.1126/science.284.5419.1531. [DOI] [PubMed] [Google Scholar]
- 34.McIntosh AR, Rajah MN, Lobaugh NJ. Functional connectivity of the medial temporal lobe relates to learning and awareness. Journal of Neuroscience. 2003;23(16):6520–8. doi: 10.1523/JNEUROSCI.23-16-06520.2003. [DOI] [PMC free article] [PubMed] [Google Scholar]
- 35.Kilpatrick LA, Zald DH, Pardo JV, Cahill LF. Sex-related differences in amygdala functional connectivity during resting conditions. Neuroimage. 2006;30(2):452–61. doi: 10.1016/j.neuroimage.2005.09.065. [DOI] [PubMed] [Google Scholar]
- 36.McIntosh AR, Chau WK, Protzner AB. Spatiotemporal analysis of event-related fMRI data using partial least squares. Neuroimage. 2004;23(2):764–75. doi: 10.1016/j.neuroimage.2004.05.018. [DOI] [PubMed] [Google Scholar]
- 37.Addis DR, McIntosh AR, Moscovitch M, Crawley AP, McAndrews MP. Characterizing spatial and temporal features of autobiographical memory retrieval networks: a partial least squares approach. Neuroimage. 2004;23(4):1460–71. doi: 10.1016/j.neuroimage.2004.08.007. [DOI] [PubMed] [Google Scholar]
- 38.Caplan JB, Luks TL, Simpson GV, Glaholt M, McIntosh AR. Parallel networks operating across attentional deployment and motion processing: a multi-seed partial least squares fMRI study. Neuroimage. 2006;29(4):1192–202. doi: 10.1016/j.neuroimage.2005.09.010. [DOI] [PubMed] [Google Scholar]
- 39.Roebroeck A, Formisano E, Goebel R. Mapping directed influence over the brain using Granger causality and fMRI. Neuroimage. 2005;25(1):230–42. doi: 10.1016/j.neuroimage.2004.11.017. [DOI] [PubMed] [Google Scholar]
- 40.Kaminski M, Ding M, Truccolo WA, Bressler SL. Evaluating causal relations in neural systems: granger causality, directed transfer function and statistical assessment of significance. Biol Cybern. 2001;85(2):145–57. doi: 10.1007/s004220000235. [DOI] [PubMed] [Google Scholar]
- 41.Valdes-Sosa PA. Spatio-temporal autoregressive models defined over brain manifolds. Neuroinformatics. 2004;2(2):239–50. doi: 10.1385/NI:2:2:239. [DOI] [PubMed] [Google Scholar]
- 42.Valdes-Sosa PA, Sanchez-Bornot JM, Lage-Castellanos A, Vega-Hernandez M, Bosch-Bayard J, Melie-Garcia L, Canales-Rodriguez E. Estimating brain functional connectivity with sparse multivariate autoregression. Philos Trans R Soc Lond B Biol Sci. 2005;360(1457):969–81. doi: 10.1098/rstb.2005.1654. [DOI] [PMC free article] [PubMed] [Google Scholar]
- 43.Kiviniemi V, Kantola JH, Jauhiainen J, Hyvarinen A, Tervonen O. Independent component analysis of nondeterministic fMRI signal sources. Neuroimage. 2003;19(2 Pt 1):253–60. doi: 10.1016/s1053-8119(03)00097-1. [DOI] [PubMed] [Google Scholar]
- 44.van de Ven VG, Formisano E, Prvulovic D, Roeder CH, Linden DE. Functional connectivity as revealed by spatial independent component analysis of fMRI measurements during rest. Hum Brain Mapp. 2004;22(3):165–78. doi: 10.1002/hbm.20022. [DOI] [PMC free article] [PubMed] [Google Scholar]
- 45.Beckmann CF, DeLuca M, Devlin JT, Smith SM. Investigations into resting-state connectivity using independent component analysis. Philos Trans R Soc Lond B Biol Sci. 2005;360(1457):1001–13. doi: 10.1098/rstb.2005.1634. [DOI] [PMC free article] [PubMed] [Google Scholar]
- 46.Friston KJ, Harrison L, Penny W. Dynamic causal modelling. Neuroimage. 2003;19(4):1273–302. doi: 10.1016/s1053-8119(03)00202-7. [DOI] [PubMed] [Google Scholar]
- 47.Patel RS, Bowman FD, Rilling JK. A Bayesian approach to determining connectivity of the human brain. Hum Brain Mapp. 2006;27(3):267–76. doi: 10.1002/hbm.20182. [DOI] [PMC free article] [PubMed] [Google Scholar]
- 48.Caclin A, Fonlupt P. Effect of initial fMRI data modeling on the connectivity reported between brain areas. Neuroimage. 2006;33(2):515–21. doi: 10.1016/j.neuroimage.2006.07.019. [DOI] [PubMed] [Google Scholar]
- 49.Horwitz B, Warner B, Fitzer J, Tagamets MA, Husain FT, Long TW. Investigating the neural basis for functional and effective connectivity. Application to fMRI. Philos Trans R Soc Lond B Biol Sci. 2005;360(1457):1093–108. doi: 10.1098/rstb.2005.1647. [DOI] [PMC free article] [PubMed] [Google Scholar]
- 50.McIntosh AR, Grady CL, Ungerleider LG, Haxby JV, Rapoport SI, Horwitz B. Network analysis of cortical visual pathways mapped with PET. J Neurosci. 1994;14(2):655–66. doi: 10.1523/JNEUROSCI.14-02-00655.1994. [DOI] [PMC free article] [PubMed] [Google Scholar]
- 51.McIntosh AR, Gonzalez-Lima F. Structural modeling of functional visual pathways mapped with 2-deoxyglucose: effects of patterned light and footshock. Brain Res. 1992;578(1−2):75–86. doi: 10.1016/0006-8993(92)90232-x. [DOI] [PubMed] [Google Scholar]
- 52.Zhuang J, LaConte S, Peltier S, Zhang K, Hu X. Connectivity exploration with structural equation modeling: an fMRI study of bimanual motor coordination. Neuroimage. 2005;25(2):462–70. doi: 10.1016/j.neuroimage.2004.11.007. [DOI] [PubMed] [Google Scholar]
- 53.Au Duong MV, Boulanouar K, Audoin B, Treseras S, Ibarrola D, Malikova I, Confort-Gouny S, Celsis P, Pelletier J, Cozzone PJ. Modulation of effective connectivity inside the working memory network in patients at the earliest stage of multiple sclerosis. Neuroimage. 2005;24(2):533–8. doi: 10.1016/j.neuroimage.2004.08.038. others. [DOI] [PubMed] [Google Scholar]
- 54.Rowe J, Stephan KE, Friston K, Frackowiak R, Lees A, Passingham R. Attention to action in Parkinson's disease: impaired effective connectivity among frontal cortical regions. Brain. 2002;125(Pt 2):276–89. doi: 10.1093/brain/awf036. [DOI] [PubMed] [Google Scholar]
- 55.Rowe JB, Stephan KE, Friston K, Frackowiak RS, Passingham RE. The prefrontal cortex shows context-specific changes in effective connectivity to motor or visual cortex during the selection of action or colour. Cereb Cortex. 2005;15(1):85–95. doi: 10.1093/cercor/bhh111. [DOI] [PubMed] [Google Scholar]
- 56.Abler B, Roebroeck A, Goebel R, Hose A, Schonfeldt-Lecuona C, Hole G, Walter H. Investigating directed influences between activated brain areas in a motor-response task using fMRI. Magn Reson Imaging. 2006;24(2):181–5. doi: 10.1016/j.mri.2005.10.022. [DOI] [PubMed] [Google Scholar]
- 57.Rissman J, Gazzaley A, D'Esposito M. Measuring functional connectivity during distinct stages of a cognitive task. Neuroimage. 2004;23(2):752–63. doi: 10.1016/j.neuroimage.2004.06.035. [DOI] [PubMed] [Google Scholar]
- 58.Elwell CE, Springett R, Hillman E, Delpy DT. Oscillations in cerebral haemodynamics. Implications for functional activation studies. Adv Exp Med Biol. 1999;471:57–65. [PubMed] [Google Scholar]
- 59.Obrig H, Neufang M, Wenzel R, Kohl M, Steinbrink J, Einhaupl K, Villringer A. Spontaneous low frequency oscillations of cerebral hemodynamics and metabolism in human adults. Neuroimage. 2000;12(6):623–39. doi: 10.1006/nimg.2000.0657. [DOI] [PubMed] [Google Scholar]
- 60.Hoshi Y, Kosaka S, Xie YX, Kohri S, Tamura M. Relationship between fluctuations in the cerebral hemoglobin oxygenation state and neuronal activity under resting conditions in man. Neuroscience Letters. 1998;245(3):147–50. doi: 10.1016/s0304-3940(98)00197-9. [DOI] [PubMed] [Google Scholar]
- 61.Biswal B, Yetkin FZ, Haughton VM, Hyde JS. Functional connectivity in the motor cortex of resting human brain using echo-planar MRI. Magn Reson Med. 1995;34(4):537–41. doi: 10.1002/mrm.1910340409. [DOI] [PubMed] [Google Scholar]
- 62.Cordes D, Haughton VM, Arfanakis K, Carew JD, Turski PA, Moritz CH, Quigley MA, Meyerand ME. Frequencies contributing to functional connectivity in the cerebral cortex in “resting-state” data. AJNR Am J Neuroradiol. 2001;22(7):1326–33. [PMC free article] [PubMed] [Google Scholar]
- 63.Cordes D, Haughton VM, Arfanakis K, Wendt GJ, Turski PA, Moritz CH, Quigley MA, Meyerand ME. Mapping functionally related regions of brain with functional connectivity MR imaging. AJNR Am J Neuroradiol. 2000;21(9):1636–44. [PMC free article] [PubMed] [Google Scholar]
- 64.Biswal BB, Van Kylen J, Hyde JS. Simultaneous assessment of flow and BOLD signals in resting-state functional connectivity maps. NMR Biomed. 1997;10(4−5):165–70. doi: 10.1002/(sici)1099-1492(199706/08)10:4/5<165::aid-nbm454>3.0.co;2-7. [DOI] [PubMed] [Google Scholar]
- 65.Peltier SJ, Noll DC. T(2)(*) dependence of low frequency functional connectivity. Neuroimage. 2002;16(4):985–92. doi: 10.1006/nimg.2002.1141. [DOI] [PubMed] [Google Scholar]
- 66.Fox MD, Snyder AZ, Vincent JL, Corbetta M, Van Essen DC, Raichle ME. The human brain is intrinsically organized into dynamic, anticorrelated functional networks. Proc Natl Acad Sci U S A. 2005;102(27):9673–8. doi: 10.1073/pnas.0504136102. [DOI] [PMC free article] [PubMed] [Google Scholar]
- 67.Hampson M, Olson IR, Leung HC, Skudlarski P, Gore JC. Changes in functional connectivity of human MT/V5 with visual motion input. Neuroreport. 2004;15(8):1315–9. doi: 10.1097/01.wnr.0000129997.95055.15. [DOI] [PubMed] [Google Scholar]
- 68.Lowe MJ, Mock BJ, Sorenson JA. Functional connectivity in single and multislice echoplanar imaging using resting-state fluctuations. Neuroimage. 1998;7(2):119–32. doi: 10.1006/nimg.1997.0315. [DOI] [PubMed] [Google Scholar]
- 69.Xiong J, Parsons LM, Gao JH, Fox PT. Interregional connectivity to primary motor cortex revealed using MRI resting state images. Hum Brain Mapp. 1999;8(2−3):151–6. doi: 10.1002/(SICI)1097-0193(1999)8:2/3<151::AID-HBM13>3.0.CO;2-5. [DOI] [PMC free article] [PubMed] [Google Scholar]
- 70.Stein T, Moritz C, Quigley M, Cordes D, Haughton V, Meyerand E. Functional connectivity in the thalamus and hippocampus studied with functional MR imaging. AJNR Am J Neuroradiol. 2000;21(8):1397–401. [PMC free article] [PubMed] [Google Scholar]
- 71.Bokde AL, Tagamets MA, Friedman RB, Horwitz B. Functional interactions of the inferior frontal cortex during the processing of words and word-like stimuli. Neuron. 2001;30(2):609–17. doi: 10.1016/s0896-6273(01)00288-4. [DOI] [PubMed] [Google Scholar]
- 72.Homae F, Yahata N, Sakai KL. Selective enhancement of functional connectivity in the left prefrontal cortex during sentence processing. Neuroimage. 2003;20(1):578–86. doi: 10.1016/s1053-8119(03)00272-6. [DOI] [PubMed] [Google Scholar]
- 73.Arfanakis K, Cordes D, Haughton VM, Moritz CH, Quigley MA, Meyerand ME. Combining independent component analysis and correlation analysis to probe interregional connectivity in fMRI task activation datasets. Magn Reson Imaging. 2000;18(8):921–30. doi: 10.1016/s0730-725x(00)00190-9. [DOI] [PubMed] [Google Scholar]
- 74.Lowe MJ, Dzemidzic M, Lurito JT, Mathews VP, Phillips MD. Correlations in low-frequency BOLD fluctuations reflect cortico-cortical connections. Neuroimage. 2000;12(5):582–7. doi: 10.1006/nimg.2000.0654. [DOI] [PubMed] [Google Scholar]
- 75.Fox MD, Corbetta M, Snyder AZ, Vincent JL, Raichle ME. Spontaneous neuronal activity distinguishes human dorsal and ventral attention systems. Proc Natl Acad Sci U S A. 2006;103(26):10046–51. doi: 10.1073/pnas.0604187103. [DOI] [PMC free article] [PubMed] [Google Scholar]
- 76.Morgan VL, Price RR. The effect of sensorimotor activation on functional connectivity mapping with MRI. Magn Reson Imaging. 2004;22(8):1069–75. doi: 10.1016/j.mri.2004.07.002. [DOI] [PubMed] [Google Scholar]
- 77.Newton A, Morgan VL, Gore JC. Task Demand Induced Modulation of Steady-State Functional Connectivity to Primary Motor Cortex. Human Brain Mapping. 2006 doi: 10.1002/hbm.20294. [DOI] [PMC free article] [PubMed] [Google Scholar]
- 78.Newton A, Morgan VL, Gore JC. Steady State Functional Connectivity Modulated by Demand in Working Memory. Fourteenth Annual Meeting of the International Society for Magnetic Resonance in Medicine; Seattle, Wa. 2006.p. 35. [Google Scholar]
- 79.Hampson M, Tokoglu F, Sun Z, Schafer RJ, Skudlarski P, Gore JC, Constable RT. Connectivity-behavior analysis reveals that functional connectivity between left BA39 and Broca's area varies with reading ability. Neuroimage. 2006;31(2):513–9. doi: 10.1016/j.neuroimage.2005.12.040. [DOI] [PubMed] [Google Scholar]
- 80.Schmithorst VJ, Holland SK. Functional MRI evidence for disparate developmental processes underlying intelligence in boys and girls. Neuroimage. 2006;31(3):1366–79. doi: 10.1016/j.neuroimage.2006.01.010. [DOI] [PubMed] [Google Scholar]
- 81.Stanberry LI, Richards TL, Berninger VW, Nandy RR, Aylward EH, Maravilla KR, Stock PS, Cordes D. Low-frequency signal changes reflect differences in functional connectivity between good readers and dyslexics during continuous phoneme mapping. Magn Reson Imaging. 2006;24(3):217–29. doi: 10.1016/j.mri.2005.12.006. [DOI] [PubMed] [Google Scholar]
- 82.Li SJ, Li Z, Wu G, Zhang MJ, Franczak M, Antuono PG. Alzheimer Disease: evaluation of a functional MR imaging index as a marker. Radiology. 2002;225(1):253–9. doi: 10.1148/radiol.2251011301. [DOI] [PubMed] [Google Scholar]
- 83.Wang L, Zang YF, He Y, Liang M, Zhang XQ, Tian LX, Wu T, Jiang TZ, Li KC. Changes in hippocampal connectivity in the early stages of Alzheimer's disease: Evidence from resting state fMRI. Neuroimage. 2006;31(2):496–504. doi: 10.1016/j.neuroimage.2005.12.033. [DOI] [PubMed] [Google Scholar]
- 84.Lowe MJ, Phillips MD, Lurito JT, Mattson D, Dzemidzic M, Mathews VP. Multiple sclerosis: low-frequency temporal blood oxygen level-dependent fluctuations indicate reduced functional connectivity initial results. Radiology. 2002;224(1):184–92. doi: 10.1148/radiol.2241011005. [DOI] [PubMed] [Google Scholar]
- 85.Cader S, Cifelli A, Abu-Omar Y, Palace J, Matthews PM. Reduced brain functional reserve and altered functional connectivity in patients with multiple sclerosis. Brain. 2006;129(Pt 2):527–37. doi: 10.1093/brain/awh670. [DOI] [PubMed] [Google Scholar]
- 86.Waites AB, Briellmann RS, Saling MM, Abbott DF, Jackson GD. Functional connectivity networks are disrupted in left temporal lobe epilepsy. Ann Neurol. 2006;59(2):335–43. doi: 10.1002/ana.20733. [DOI] [PubMed] [Google Scholar]
- 87.Whalley HC, Simonotto E, Marshall I, Owens DG, Goddard NH, Johnstone EC, Lawrie SM. Functional disconnectivity in subjects at high genetic risk of schizophrenia. Brain. 2005;128(Pt 9):2097–108. doi: 10.1093/brain/awh556. [DOI] [PubMed] [Google Scholar]
- 88.Liang M, Zhou Y, Jiang T, Liu Z, Tian L, Liu H, Hao Y. Widespread functional disconnectivity in schizophrenia with resting-state functional magnetic resonance imaging. Neuroreport. 2006;17(2):209–13. doi: 10.1097/01.wnr.0000198434.06518.b8. [DOI] [PubMed] [Google Scholar]
- 89.Tian LX, Jiang TZ, Wang YF, Zang YF, He Y, Liang M, Sui MQ, Cao QJ, Hu SY, Peng M. Altered resting-state functional connectivity patterns of anterior cingulate cortex in adolescents with attention deficit hyperactivity disorder. Neuroscience Letters. 2006;400(1−2):39–43. doi: 10.1016/j.neulet.2006.02.022. others. [DOI] [PubMed] [Google Scholar]
- 90.Lawrie SM, Buechel C, Whalley HC, Frith CD, Friston KJ, Johnstone EC. Reduced frontotemporal functional connectivity in schizophrenia associated with auditory hallucinations. Biol Psychiatry. 2002;51(12):1008–11. doi: 10.1016/s0006-3223(02)01316-1. [DOI] [PubMed] [Google Scholar]
- 91.Anand A, Li Y, Wang Y, Gao S, Wu JW, Lowe MJ, Talavage T, Nurnberger JI, Goldman D, Murrell J. Genetic correlates of cortico-limbic activity and connectivity in major depression. Neuropsychopharmacology. 2005;30:S159–S. [Google Scholar]
- 92.Anand A, Li Y, Wang Y, Wu J, Gao S, Bukhari L, Mathews VP, Kalnin A, Lowe MJ. Antidepressant effect on connectivity of the mood-regulating circuit: an FMRI study. Neuropsychopharmacology. 2005;30(7):1334–44. doi: 10.1038/sj.npp.1300725. [DOI] [PubMed] [Google Scholar]
- 93.Quigley M, Cordes D, Wendt G, Turski P, Moritz C, Haughton V, Meyerand ME. Effect of focal and nonfocal cerebral lesions on functional connectivity studied with MR imaging. AJNR Am J Neuroradiol. 2001;22(2):294–300. [PMC free article] [PubMed] [Google Scholar]
- 94.Raichle ME, MacLeod AM, Snyder AZ, Powers WJ, Gusnard DA, Shulman GL. A default mode of brain function. Proc Natl Acad Sci U S A. 2001;98(2):676–82. doi: 10.1073/pnas.98.2.676. [DOI] [PMC free article] [PubMed] [Google Scholar]
- 95.Greicius MD, Krasnow B, Reiss AL, Menon V. Functional connectivity in the resting brain: a network analysis of the default mode hypothesis. Proc Natl Acad Sci U S A. 2003;100(1):253–8. doi: 10.1073/pnas.0135058100. [DOI] [PMC free article] [PubMed] [Google Scholar]
- 96.Horovitz S, M F, de Zwart J, van Geldern P, Fulton S, Balkin T, Duyn J. BOLD fMRI resting state activity and the network of default mode brain function. International Society of Magnetic Resonance in Medicine; Seattle, WA, USA. 2006.p. 531. [Google Scholar]
- 97.Biswal B, Hudetz AG, Yetkin FZ, Haughton VM, Hyde JS. Hypercapnia reversibly suppresses low-frequency fluctuations in the human motor cortex during rest using echo-planar MRI. J Cereb Blood Flow Metab. 1997;17(3):301–8. doi: 10.1097/00004647-199703000-00007. [DOI] [PubMed] [Google Scholar]
- 98.Kiviniemi V, Jauhiainen J, Tervonen O, Paakko E, Oikarinen J, Vainionpaa V, Rantala H, Biswal B. Slow vasomotor fluctuation in fMRI of anesthetized child brain. Magn Reson Med. 2000;44(3):373–8. doi: 10.1002/1522-2594(200009)44:3<373::aid-mrm5>3.0.co;2-p. [DOI] [PubMed] [Google Scholar]
- 99.Kiviniemi VJ, Haanpaa H, Kantola JH, Jauhiainen J, Vainionpaa V, Alahuhta S, Tervonen O. Midazolam sedation increases fluctuation and synchrony of the resting brain BOLD signal. Magn Reson Imaging. 2005;23(4):531–7. doi: 10.1016/j.mri.2005.02.009. [DOI] [PubMed] [Google Scholar]
- 100.Kruger G, Glover GH. Physiological noise in oxygenation-sensitive magnetic resonance imaging. Magn Reson Med. 2001;46(4):631–7. doi: 10.1002/mrm.1240. [DOI] [PubMed] [Google Scholar]
- 101.Birn RM, Diamond JB, Smith MA, Bandettini PA. Separating respiratory-variation-related fluctuations from neuronal-activity-related fluctuations in fMRI. Neuroimage. 2006;31(4):1536–48. doi: 10.1016/j.neuroimage.2006.02.048. [DOI] [PubMed] [Google Scholar]
- 102.Lund TE. fcMRI--mapping functional connectivity or correlating cardiac-induced noise? Magn Reson Med. 2001;46(3):628–9. doi: 10.1002/mrm.1238. [DOI] [PubMed] [Google Scholar]
- 103.Maldjian JA. Functional connectivity MR imaging: fact or artifact? AJNR Am J Neuroradiol. 2001;22(2):239–40. [PMC free article] [PubMed] [Google Scholar]
- 104.Bhattacharyya PK, Lowe MJ. Cardiac-induced physiologic noise in tissue is a direct observation of cardiac-induced fluctuations. Magn Reson Imaging. 2004;22(1):9–13. doi: 10.1016/j.mri.2003.08.003. [DOI] [PubMed] [Google Scholar]
- 105.Zhao X, Bodurka J, Jesmanowicz A, Li SJ. B(0)-fluctuation-induced temporal variation in EPI image series due to the disturbance of steady-state free precession. Magn Reson Med. 2000;44(5):758–65. doi: 10.1002/1522-2594(200011)44:5<758::aid-mrm14>3.0.co;2-g. [DOI] [PubMed] [Google Scholar]
- 106.Kiviniemi V, Ruohonen J, Tervonen O. Separation of physiological very low frequency fluctuation from aliasing by switched sampling interval fMRI scans. Magn Reson Imaging. 2005;23(1):41–6. doi: 10.1016/j.mri.2004.09.005. [DOI] [PubMed] [Google Scholar]
- 107.Hu X, Le TH, Parrish T, Erhard P. Retrospective estimation and correction of physiological fluctuation in functional MRI. Magn Reson Med. 1995;34(2):201–12. doi: 10.1002/mrm.1910340211. [DOI] [PubMed] [Google Scholar]
- 108.Glover GH, Li TQ, Ress D. Image-based method for retrospective correction of physiological motion effects in fMRI: RETROICOR. Magn Reson Med. 2000;44(1):162–7. doi: 10.1002/1522-2594(200007)44:1<162::aid-mrm23>3.0.co;2-e. [DOI] [PubMed] [Google Scholar]
- 109.Lowe MJ, Sakaie KE. A Bootstrap Method for Removing Aliased Cardiac and Respiratory Effects in VOlumetric Resting State Connectivity Data. ISMRM; Seatle, WA. 2006.p. 543. [Google Scholar]
- 110.Li SJ, Biswal B, Li Z, Risinger R, Rainey C, Cho JK, Salmeron BJ, Stein EA. Cocaine administration decreases functional connectivity in human primary visual and motor cortex as detected by functional MRI. Magn Reson Med. 2000;43(1):45–51. doi: 10.1002/(sici)1522-2594(200001)43:1<45::aid-mrm6>3.0.co;2-0. [DOI] [PubMed] [Google Scholar]
- 111.Stark CE, Squire LR. When zero is not zero: the problem of ambiguous baseline conditions in fMRI. Proc Natl Acad Sci U S A. 2001;98(22):12760–6. doi: 10.1073/pnas.221462998. [DOI] [PMC free article] [PubMed] [Google Scholar]
- 112.Gonzalez-Hernandez JA, Cespedes-Garcia Y, Campbell K, Scherbaum WA, Bosch-Bayard J, Figueredo-Rodriguez P. A pre-task resting condition neither ‘baseline’ nor ‘zero’. Neurosci Lett. 2005;391(1−2):43–7. doi: 10.1016/j.neulet.2005.08.027. [DOI] [PubMed] [Google Scholar]
- 113.Smith AM, Lewis BK, Ruttimann UE, Ye FQ, Sinnwell TM, Yang Y, Duyn JH, Frank JA. Investigation of low frequency drift in fMRI signal. Neuroimage. 1999;9(5):526–33. doi: 10.1006/nimg.1999.0435. [DOI] [PubMed] [Google Scholar]
- 114.Andersson JL, Ashburner J, Friston K. A global estimator unbiased by local changes. Neuroimage. 2001;13(6 Pt 1):1193–206. doi: 10.1006/nimg.2001.0763. [DOI] [PubMed] [Google Scholar]
- 115.Macey PM, Macey KE, Kumar R, Harper RM. A method for removal of global effects from fMRI time series. Neuroimage. 2004;22(1):360–6. doi: 10.1016/j.neuroimage.2003.12.042. [DOI] [PubMed] [Google Scholar]