Abstract
One approach to apply precision agriculture to optimize crop production and environmental quality is identifying management zones. In this paper, the variables of soil electrical conductivity (EC) data, cotton yield data and normalized difference vegetation index (NDVI) data in an about 15 ha field in a coastal saline land were selected as data resources, and their spatial variabilities were firstly analyzed and spatial distribution maps constructed with geostatistics technique. Then fuzzy c-means clustering algorithm was used to define management zones, fuzzy performance index (FPI) and normalized classification entropy (NCE) were used to determine the optimal cluster numbers. Finally one-way variance analysis was performed on 224 georeferenced soil and yield sampling points to assess how well the defined management zones reflected the soil properties and productivity level. The results reveal that the optimal number of management zones for the present study area was 3 and the defined management zones provided a better description of soil properties and yield variation. Statistical analyses indicate significant differences between the chemical properties of soil samples and crop yield in each management zone, and management zone 3 presented the highest nutrient level and potential crop productivity, whereas management zone 1 the lowest. Based on these findings, we conclude that fuzzy c-means clustering approach can be used to delineate management zones by using the given three variables in the coastal saline soils, and the defined management zones form an objective basis for targeting soil samples for nutrient analysis and development of site-specific application strategies.
Keywords: Management zones, Fuzzy clustering, Spatial variability, Saline land, Precision agriculture
INTRODUCTION
Precision agriculture seeks to identify, analyze, and manage spatial and temporal variability within fields in order to optimize profitability, sustainability, and environmental protection (Robert et al., 1996; Duffera et al., 2007). At present, the use of site-specific management zones, rather than the traditional whole field approach, is a popular approach for farm managers to manage field variability on a site-specific basis. Management zones (MZ) are defined as sub-regions of a field that has a relatively homogeneous combination of yield-limiting factors, for which a single rate of a specific crop input is appropriate to attain maximum efficiency of farm inputs (Doerge, 1999; Vrindts et al., 2005). Besides representing areas of equal production potential, within-field management zones have many other uses. Several studies have indicated that homogenous management zones could be used as an alternative to grid soil sampling and to develop nutrient maps for variable rate fertilizer application (Khosla and Alley, 1999; Fleming et al., 2000a). Spatially coherent areas within fields may also be useful in relating yield to soil and topographic parameters for crop-modeling evaluation (Fraisse et al., 2001a).
While methods for delineating management zones vary widely in the information used, usually they are based on soil and yield information possibly over several years (Fraisse et al., 2001b; Fleming et al., 2000b). Many researches used the soil and/or relief information to define management zones. For example, Fraisse et al.(2001b) used a combination of topographic attributes and soil electrical conductivity (EC) to delineate management zones. Schepers et al. (2004) aggregated the landscape attributes into management zones to characterize spatial variability in soil chemical properties and corn yields. Ortega and Santibáňez (2007) determined the management zones in corn on the basis of soil fertility. Since the variability in soil EC reflects the cumulative variability in multiple soil properties, it is one of the criteria for defining management zones (Sudduth et al., 1995). For some soils, EC mapping appears to integrate soil parameters related to productivity to produce a template of potential yield (Kitchen et al., 1999). Johnson et al.(2001) found that management zones based on EC mapping provided a useful framework for soil sampling to reflect spatial heterogeneity and could potentially be applied to assess temporal impacts of management on soil conditions. Ferguson et al.(2003) compared management zones based on slope and surface soil texture with those based on soil EC, and concluded that the management zones based on easily obtained soil EC measurements were preferable and had the potential for use in the site-specific management of nitrification inhibitors. Kitchen et al.(2005) concluded that EC and elevation measurements could be reliably used for creating management zones on claypan soil fields.
The second approach is based on yield maps, combining data from several seasons. Stafford et al.(1998) used yield maps to identify generalized management zones of low, medium and high yield productivities. Blackmore (2000) used a series of yield maps to classify the management zones with different relative yield and yield stability within a field. Other published researches delineated filed zones into different yield potential as a function of soil and topography characteristics caused by erosion (Reyniers et al., 2006).
The third approach integrates the soil information with yield data to delineate subfield management zones. Franzen and Kitchen (1999) utilized a variety of data resources such as topography, soil EC, crop yield maps and intensive soil survey data to construct management zones for N fertilizer management. Hornung et al.(2003) determined the optimal N-management strategy by coupling the grain yield with soil parameters. Vrindts et al.(2005) compared the management zones defined based on soil data only with the ones on soil information and crop, and found that the latter provided a better description of the yield variation. In addition, current information on crop status, for example by remote sensing, can be considered as a valuable tool which enables the management zones to be adjusted to the current growing season (Godwin et al., 2003; Vrindts et al., 2005). Long et al.(1994) concluded that aerial photographs of growing crops were the most accurate for classifying a field into management units to predict grain yield. Boydell and McBratney (2002) found that imagery of a growing crop and yield data collected in the same year would be highly correlated and thus an accurate representation of crop production potential for that specific year.
The combination of the different layers of information can be performed using different algorithms. The most common is the use of cluster analysis. This can be used to identify areas that have similar landscape attributes, soil properties and plant parameters, to quantify patterns of variability and to reduce the empirical nature of defined management zones (Fraisse et al., 2001b). Stafford et al.(1998) used fuzzy clustering of combined yield monitor data to divide a field into potential management zones. Fridgen et al.(2000) found approximately 54% of the yield variation was explained by the identified management zones using cluster analysis of apparent EC, elevation, and slope information in Missouri. Jaynes et al.(2005) applied cluster analysis of multi-year soybean yield to partition a field into a few clusters with similar temporal yield patterns.
The objectives of this study in a coastal saline field are to: (1) map the soil EC, crop reflection and crop yield to examine the effect of soil EC on the crop in a coastal saline field; (2) investigate the effectiveness of management zones defined by using fuzzy cluster analysis of soil EC measurements, yield and crop data.
MATERIALS AND METHODS
Study areas
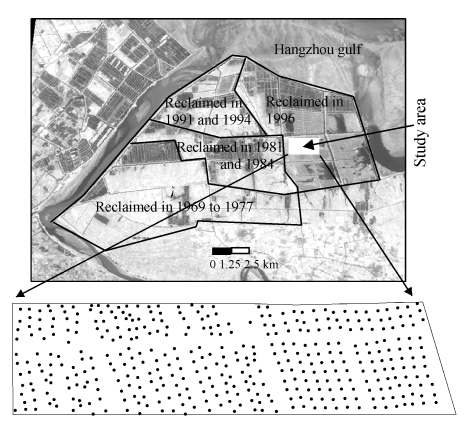
The study was conducted on a 15 ha cotton field in a coastal saline region which is located in the northern region of Shangyu City, Zhejiang Province, China, and covers an area of 26 061 ha (30°04′00″~30°13′47″ N, 120°38′32″~120°51′53″ E). The region is subtropical with evergreen broadleaf vegetation, an average annual temperature of 16.5 °C, and an average annual precipitation of 1 300 mm. Modern marine and fluvial deposits form the dominant soils having light loam or sandy loam soil textures with a sand content of 592 g/kg and high concentrations of Na- and Mg-salts (>1%). Over the past 30 years, many coastal tideland areas have been successively enclosed and reclaimed for agricultural land uses under a series of reclamation projects. The field used in the present study was reclaimed in 1996 (Fig.1).
Fig. 1.
The study area and spatial distribution of sampling points
Data collection and sampling design
A grid-sampling scheme was imposed on the field with 396 composite bulk electrical conductivity (ECb) measurements for the soil profile (0~20 cm) using a portable WET (W stands for water, E electrical conductivity and T temperature) sensor in November 2003. At each grid point, one representative sample was collected. At each sampling grid point, the WET sensor probes were inserted into the soil and 5 soil EC measurements were made within a 1 m diameter circle. The average reading for each grid point was computed as an ECb datum point. Each ECb measurement was geo-referenced using a trimble global positioning system (GPS) (with differential correction). The GPS receiver accuracy was within 2 m of horizontal accuracy. When performing ECb measurements in the open, 224 soil samples were collected and taken back to the laboratory where their chemical properties (pH, EC1:5 (measured by a conventional conductivity meter in a 1:5 soil/water suspension), available P (AP), available K (AK), organic matter (OM), available N (AN), total N (TN) and cation exchange capacity (CEC)) were analyzed with conventional methods. Normalized difference vegetation index (NDVI) values were calculated from SPOT5 satellite imagery acquired on Sept. 27, 2003, to reflect the way crop was growing. During the harvest period in 2003, 396 cotton yield samples were also collected at the corresponding grid-point locations with ECb samples. Five cotton plants at each grid point were harvested and the average seed cotton yield computed.
Geostatistics analysis
To characterize the spatial distribution of the soil parameters in the optimum regression model, semi-variance analyses were carried out on these selected soil variables using a geostatistical software package (GS+7.0) to determine the type of spatial structure. In the present study, isotropic sphericals were fitted to the experimental semi-variograms using the method of least squares. The fitted models were then used in an ordinary punctual kriging procedure to estimate the values of these selected soil properties at unsampled locations, and smoothed contour maps of each soil property were then constructed using the interpolated value.
Fuzzy c-means clustering algorithm
The fuzzy c-means clustering algorithm was used for the purpose of partitioning n data observations in feature space into c-groups or clusters based on a fuzzy c-means partition.
There are three primary matrices involved in the clustering process. First, there is the data matrix X we want to classify, consisting of n observations with p classification variables each. The second is the cluster centroid matrix V, consisting of c cluster centroids located in the feature space defined by the p classification variables. Finally, there is the fuzzy membership matrix U, consisting of membership values to every cluster in V for each observation in X, bounded by the constraints for all i=1 to c and all k=1 to n that:
 |
and
 . .
|
(1) |
An optimal fuzzy c partition is defined as the minimization of the generalized least-squared errors function, Jm, which is a weighted measure of the squared distance between pixels and class centroids:
 |
(2) |
where m is fuzziness weighting exponent, and controls the relative weights placed on each of the squared errors. Increasing m tends to increase the degree of fuzziness, and hard clusters occur as m approaches to a value of 1. There is no theoretical or computational evidence to distinguish an optimal m.
(dik)2 is the squared distance in feature space between xk and vi, which can be computed in the following manner:
| (dik)2=║xk−vi║2=(xk−vi)TA(xk−vi), | (3) |
where xk is the data observation k in the data matrix X, vi is the centroid of cluster i in the cluster centroid matrix V, and A is positive-define (p×p) weight matrix that determines the norm used that controls the shape of the classes.
Optimal fuzzy clusterings of X are obtained from pairs (U, v) that may be locally optimal for only if
 |
(4) |
 |
(5) |
The several types of cluster validity functions are usually calculated on each U produced by fuzzy c-means since the local minima of Jm are not consistent with the visually acceptable clustering patterns of the data. For this study, the fuzziness performance index (FPI) (Odeh et al., 1992; Boydell and McBratney, 2002) and normalized classification entropy (NCE) (Bezdek, 1981) were used for determining the optimal number of clusters:
 |
(6) |
 |
(7) |
where logarithmic base a is any positive integer.
FPI is a measure of the degree of separation (i.e., fuzziness) between fuzzy c-partitions of X. Values of FPI may range from 0 to 1. Values approaching 0 indicate distinct classes with little membership sharing, while values near 1 indicate nondistinct classes with a large degree of membership sharing. The NCE models the amount of disorganization of a fuzzy c-partition of X (Odeh et al., 1992; Lark and Stafford, 1997). The optimal number of clusters for each computed index is when the index is at the minimum, representing the least membership sharing and the greatest amount of organization as a result of the clustering process (Fridgen et al., 2004).
Conventional statistics was performed with SPSS 12.0. GS+7.0 program was used for geostatistics analysis. Image analysis and display were done with ERDAS8.6 and ArcGIS8.3. MatLab6.5 was used in implementing the fuzzy c-means clustering algorithm.
RESULTS AND DISCUSSION
Conventional statistics of soil properties and crop yield
Descriptive statistics including means, standard deviation (SD), coefficient of variation (CV), the maximum values, minimum values, skewness and kurtosis for soil ECb (before and after interpolation) and cotton yield (before and after interpolation) from 396 sampling points are summarized in Table 1.
Table 1.
Descriptive statistics of physical properties and crop yield
| Variables | Type of distribution | Mean | SD | CV (%) | Min. | Max. | Skewness | Kurtosis |
| ECb (before interpolation) | Normal | 86.18 | 70.34 | 82 | 10.00 | 371.50 | 1.54 | 2.46 |
| ECb (after interpolation) | Normal | 83.96 | 55.46 | 66 | 15.40 | 300.60 | 1.79 | 3.16 |
| Cotton yield (before interpolation) | Normal | 100.50 | 74.05 | 74 | 11.00 | 518.00 | 2.65 | 9.79 |
| Cotton yield (after interpolation) | Normal | 103.22 | 46.08 | 45 | 32.86 | 429.71 | 2.68 | 12.20 |
| NDVI | Normal | 0.25 | 0.07 | 29 | 0.00 | 0.37 | −0.96 | 0.37 |
It was evident that the saline soil was characterized by high ECb content and low crop yield. The ECb data varied widely with maximum value of 372 mS/m and minimum value of 10 mS/m. In common with other reports, CVs of ECb were fairly high (Cetin and Kirda, 2003). This can be due to uneven crop growth and non-uniform management practices, resulting in marked changes in soil ECb over small distances. In addition, the micro-landform and the level of groundwater also contributed to the variability of ECb in the topsoil. Similarly, cotton yield also exhibited remarkable variability with a range of 507 g/plant and CV of 74%. The variation of cotton yield was mainly influenced by those of soil ECb. The analysis of Pearson’s correlation between soil ECb and cotton yield indicted that the soil ECb was significantly negatively correlated with cotton yield at P=0.01 probability level. Previously, Fu et al.(2000) found that, in the same coastal saline land, salinity was negatively correlated with the relative yield of cotton, soybean and mustard leaf etc., with correlated coefficient of about 0.9. In fact, it has been proven that the salinity was the main limiting factor for crop growth in the present study area and the increase of salinity decreased the crop yield to a large extent. As an important index of soil salinity, ECb thus could be a reliable indictor of cotton yield and a useful basis to evaluate the probable potential for site-specific management in the saline region (Li et al., 2007).
Maps of field measurements
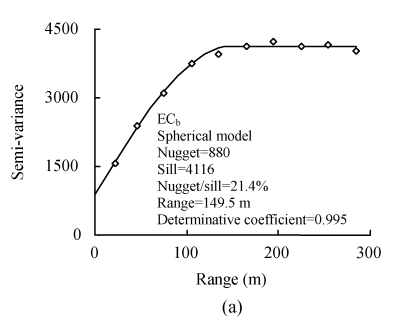
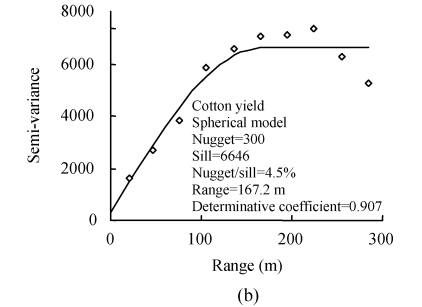
Distributions of soil ECb and cotton yield using the Kolmogorov-Smirnov statistic were found to have normal distributions, thereby providing a basis for further structural analysis. The results of structural analysis on the two variables are given in Fig.2. It was evident that the two variables illustrated isotropic behavior. Both semi-variograms had good continuity in space and could be modeled quite well with spherical models.
Fig. 2.
Semi-variogram of soil ECb (a) and cotton yield (b) properties and their fitted curves and parameters
The presence of nugget variance in each soil property was probably due to short-range variability and unaccountable measurement errors. The ratio of nugget variance to sill variance could be regarded as a criterion to classify the spatial dependence of soil properties. If the ratio is less than 25%, the variable has strong spatial dependence; between 25% and 75%, the variable has moderate spatial dependence; and greater than 75%, the variable shows only weak spatial dependence (Chien et al., 1997). The two variables exhibited strong spatial dependencies with the ratio of nugget variance to sill variance from 4.5% to 21.4%. The range of spatial dependence was considered the distance beyond which observations were not spatially dependent. The soil ECb and cotton yield had very similar ranges of 149.5 m and 167.2 m, respectively, which further confirmed that the spatial structure of cotton yield was affected greatly by that of soil ECb in the study area.
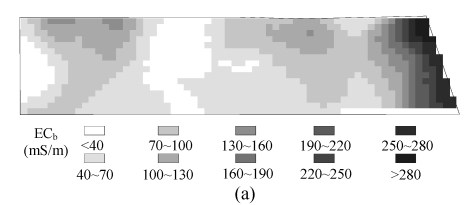
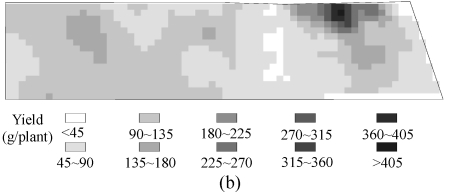
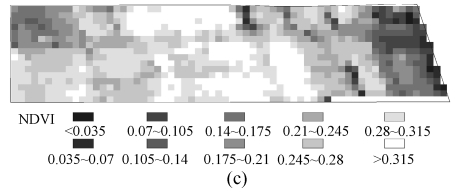
Kriging interpolation was applied to interpolate the two soil properties into a 10-m grid cell to represent the two variables on the same spatial resolution as NDVI data (10 m, see section below and the descriptive statistics in Table 1). This enabled the plot to be divided into several classes to determine homogenous zones. The smoothed contour maps obtained for the two variables are presented in Fig.3.
Fig. 3.
Spatial distribution maps produced by kriging for ECb (a), cotton yield (b), and NDVI (c) image produced by SPOT5 image
It can be seen evidently that high ECb was distributed in the eastern section and low ECb in the middle and west parts of the study area. Salinity in the groundwater with high mineral degrees induced the high ECb level in the east. Because there were some fish ponds to the east of the field, groundwater filtered into the eastern edge of study area transporting salts, which were deposited and then accumulated in the topsoil when the water subsequently evaporated. In addition, according to the study by Shi et al.(2003) the saline soils were characterized by high sand content, which was also typical at the present study site. Because of the coarse soil texture with high sand content and permeability, salt leaching with rainfall and being upward transported with evaporation was frequent. This resulted in rapid salt accumulation in the topsoil in this coastal field. It has been reported that for the same coastal region, salts from the groundwater tables that were below 3 m in depth could be transported upward in dry months and cause accumulation of salts in the topsoil (Ding et al., 2001). The low ECb in the middle and west parts of the study area was due to the influence of soil management practices. The distribution of cotton yield was opposite in direction to that of ECb, with low yield content distributed in the east to the study area and higher yield levels in the middle and western parts.
NDVI is closely related to many vegetation parameters such as leaf area index, vegetation cover, vegetation biomass and crop growth, so it is often used to monitor crop growth and predict crop yield. In the present study, with SPOT5 image, NDVI was calculated to reflect cotton cover and growth. The obtained NDVI image was given in Fig.3. NDVI image coincided considerably with the distribution map of cotton yield. The higher NDVI values were in the middle and western of the study area, where ECb content was low; whereas lower NDVI value appeared in the east section, where ECb content was high. This phenomenon was mainly caused by the negative correlation between ECb content and crop growth. Where the cotton grew well, ECb content was low, and, the other way around, where cotton grew worse, ECb content was high. As an important index to reflect crop cover and growth, NDVI image and the distributions map of ECb and cotton yield (Fig.3) were together used in fuzzy c-means cluster analysis to identify areas that have homogenous attributes in landscape and soil condition for site-specific management.
Fuzzy clustering analysis
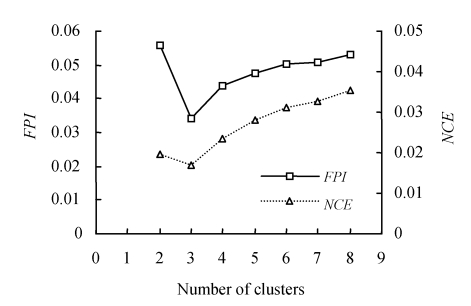
The obtained distribution maps of soil ECb, cotton yield and NDVI (Fig.3) were analyzed with the fuzzy c-means algorithm to assign a pixel to the appropriate classes based on the minimization of the generalized least squared error function of each pixel. We considered 8 clusters to be the maximum number of practical use as management zones, so the obtained map layer was divided into 2, 3, 4, 5, 6, 7 and 8 clusters. Two cluster validity functions, including FPI and NCE were used as indicators of optimum cluster number. The results from the two indices are graphed in Fig.4. The optimal number of clusters for each computed index is representing the least membership sharing (FPI) or greatest amount of organization (NCE) as a result of the clustering process, when the index is at the minimum. Fig.4 shows that FPI and NCE had the same change trend with the increase of cluster number, and the minimum FPI and NCE were obtained with 3 clusters for the present study area, which indicates that the sum of squares for members within a cluster is minimized while the sum of squares between members of different clusters is maximized. The final decision of how many clusters to use for creating management zones when the two cluster validity indices are dissimilar may require additional verification. For example, when developing productivity zones, verification of cluster number might be accomplished by comparing the within-zone yield variation with increase of the number of clusters (Fridgen et al., 2004).
Fig. 4.
Calculated FPI and NCE for the study area
Fig.5 shows the resultant management zone map, depicting 3 management zones. Within each class, crop and field parameters could be quantified, analyzed and compared with other zones.
Fig. 5.
Management zones map and spatial distribution of sampling points across each zone
To assess whether the method of utilizing soil ECb, cotton yield and NDVI data to delineate management zones could be used to effectively characterize spatial variation in soil chemical properties (pH, EC1:5, AP, AK, OM, AN, TN, CEC), all georeferenced soil samples were assigned to one of the three respective management zones. Once soil samples were assigned with zone classification, the data were exported and analyzed via one-way variance analysis to provide an indication of statistical distinction between the different potential management zones. The results revealed distinctly different soil chemical properties for the 3 management zones (Table 2). Besides pH, the average of the mean AK, OM, CEC and yield within each management zone were significant at P<0.01 probability level, for EC1:5, AP and TN, and AN at P<0.05 probability level. In summary, soil chemical properties were much more optimal for crop growth in the management zone 3 than in the management zone 1. As important fertility indices, AP, OM, AN, TN and CEC contents were the highest in management zone 3 and the lowest in management zone 1. Also, about 35%, 22%, 43%, 38% and 31% increases in the 5 variables from management zone 1 to management zone 3 were found, whereas nearly 35% decrease in EC level and 155% increase in yield level from management zone 1 to management zone 3 were observed, implying a negative association between soil EC and most soil chemical properties and yield. For soil AK, the opposite distribution trend with those of other fertility indices was observed. Fu et al.(2000) also found AK presented higher level in newly reclaimed coastal region where salinity content was high, and lower level in early reclaimed coastal region where salinity content was low. Further studies would be conducted before general conclusions were made about the distribution of AK in the coastal saline land. Thus, it appeared that soil ECb, cotton yield and NDVI data can be used to delineate management zones that characterize spatial variation in soil chemical properties and crop productivity.
Table 2.
One-way variance analysis of soil pH, EC1:5, available P (AP), available K (AK), organic matter (OM), available N (AN), total N (TN) and cation exchange capacity (CEC) in the topsoil for the three management zones
| Management zones | No. of Samples | Soil properties |
||||||||
| pH | EC1:5 (mS/m) | AP (mg/kg) | AK (mg/kg) | OM (g/kg) | AN (mg/kg) | TN (g/kg) | CEC (cmol/kg) | Yield (g/plant) | ||
| 1 | 18 | 7.90 | 189.61 | 27.86 | 144.38 | 7.57 | 37.20 | 0.82 | 6.88 | 75.44 |
| 2 | 46 | 7.61 | 151.61 | 34.19 | 110.14 | 8.28 | 45.97 | 1.03 | 7.05 | 76.90 |
| 3 |
160 |
7.56 |
123.24 |
37.55 |
96.43 |
9.26 |
53.29 |
1.13 |
9.03 |
192.37 |
| Variance analysis | F value | 1.018 | 3.744 | 2.749 | 5.655 | 8.897 | 4.234 | 2.938 | 24.226 | 73.560 |
| Prob>F | 0.365 | 0.027 | 0.042 | 0.005 | 0.004 | 0.017 | 0.039 | 0.000 | 0.000 | |
CONCLUSION
In the present study, we found that the spatial variations of soil and yield were well represented with geostatistical method, and we used fuzzy c-means clustering approach to aggregate soil, yield and crop data into homogeneous management zones, and used two cluster validity functions including FPI and NCE to determine the optimal number of cluster. Statistical analyses showed that different management zones had different yields, nutrient concentrations and electrical conductivity, indicating that the procedures used in the study may be effective in identifying different management zones. It also suggests that the defined management zones may be a more economical method of developing variable rate technology application maps and a targeted soil sampling plan to reduce the number of soil analysis needed and to capture variability in various soil properties that are likely to influence crop yield. In addition, because these studies were conducted only on saline soils in coastal region, further testing over a broader scope of fields and crop production systems is needed to confirm these results.
Footnotes
Project supported by the National Natural Science Foundation of China (Nos. 40701007 and 40571066) and the Postdoctoral Science Foundation of China (No. 20060401048)
References
- 1.Bezdek JC. Pattern Recognition with Fuzzy Objective Function Algorithms. New York: Plenum Press; 1981. [Google Scholar]
- 2.Blackmore S. The interpretation of trends from multiple yield maps. Computer and Electronics in Agriculture. 2000;26(1):37–51. doi: 10.1016/S0168-1699(99)00075-7. [DOI] [Google Scholar]
- 3.Boydell B, McBratney AB. Identifying Potential within-Field Management Zones from Cotton-Yield Estimates. Precision Agriculture. 2002;3(1):9–23. doi: 10.1023/A:1013318002609. [DOI] [Google Scholar]
- 4.Cetin M, Kirda C. Spatial and temporal changes of soil salinity in a cotton field irrigated with low-quality water. J Hydrol. 2003;272(1-4):238–249. doi: 10.1016/S0022-1694(02)00268-8. [DOI] [Google Scholar]
- 5.Chien YJ, Lee DY, Guo HY, Houng KH. Geostatistical analysis of soil properties of mid-west Taiwan soils. Soil Sci. 1997;162(4):291–297. doi: 10.1097/00010694-199704000-00007. [DOI] [Google Scholar]
- 6.Ding NF, Li RA, Dong BR, Fu QL, Wang JH. Long-term observations and study on salinity and nutrients of coastal saline soils. Chin J Soil Sci. 2001;32(2):57–59. (in Chinese) [Google Scholar]
- 7.Doerge T. Defining management zones for precision farming. Crop Insights. 1999;8(21):1–5. [Google Scholar]
- 8.Duffera M, White JG, Weisz R. Spatial variability of Southeastern US coastal plain soil physical properties: implications for site-specific management. Geoderma. 2007;137(3-4):327–339. doi: 10.1016/j.geoderma.2006.08.018. [DOI] [Google Scholar]
- 9.Ferguson RB, Lark RM, Slater GP. Approaches to management zone definition for use of nitrification inhibitors. Soil Sci Soc Am J. 2003;67:937–947. [Google Scholar]
- 10.Fleming KL, Westfall DG, Wiens DW, Brodah MC. Evaluating farmer developed management zone maps for variable rate fertilizer application. Precision Agriculture. 2000;2(2):201–215. doi: 10.1023/A:1011481832064. [DOI] [Google Scholar]
- 11.Fleming KL, Westfall DG, Bausch WC. Evaluating Management Zone Technology and Grid Soil Sampling for Variable Rate Nitrogen Application. In: Robert PC, Rust RH, Larson WE, editors. Proceedings of the 5th International Conference on Precision Agriculture and Other Source Management; Madison, WI, USA: ASA, CSSA, SSSA; 2000. [Google Scholar]
- 12.Fraisse CW, Sudduth KA, Kitchen NR. Calibration of the ceres-maize model for simulating site-specific crop development and yield on claypan soils. Appl Eng Agric. 2001;17(4):547–556. [Google Scholar]
- 13.Fraisse CW, Sudduth KA, Kitchen NR. Delineation of site-specific management zones by unsupervised classification of topographic attributes and soil electrical conductivity. Trans ASAE. 2001;44(1):155–166. [Google Scholar]
- 14.Franzen DW, Kitchen NR. Site-specific Management Guidelines Series. Potash & Phosphate Institute; 1999. Developing Management Zones to Target Nitrogen Applications. SSMG-5. (Available from: Http://www.ppi-far.org/ssmg) [Google Scholar]
- 15.Fridgen JJ, Kitchen NR, Sudduth KA. Variability of Soil and Landscape Attributes within Sub-field Management Zones. In: Robert PC, Rust RH, Larson WE, editors. Proceedings of the 5th International Conference on Precision Agriculture and Other Source Management; Madison, WI, USA: ASA, CSSA, SSSA; 2000. [Google Scholar]
- 16.Fridgen JJ, Kitchen NR, Sudduth KA, Drummond ST, Wiebold WJ, Fraisse CW. Management zone analyst (MZA): software for subfield management zone delineation. Agronomy Journal. 2004;96:100–108. [Google Scholar]
- 17.Fu QL, Li RA, Ge ZB. Study and Practice on Agricultural Technology Demonstration in Coastal Saline Land in Zhejiang Province. Hangzhou: Zhejiang University Press; 2000. pp. 102–104.pp. 122–123. (in Chinese) [Google Scholar]
- 18.Godwin RJ, Wood GA, Taylor JC, Knight SM, Welsh HP. Precision farming of cereal crops: a review of a six year experiment to develop management guidelines. Biosyst Eng. 2003;84(4):375–391. doi: 10.1016/S1537-5110(03)00031-X. [DOI] [Google Scholar]
- 19.Hornung A, Khosla R, Reich R, et al. Evaluation of Site-Specific Management Zones: Grain Yield, Biomass and Nitrogen Use Efficiency. In: Stafford JV, Werner A, editors. Proceedings of the 4th European Conference on Precision Agriculture; Wageningen, the Netherlands: Wageningen Academic Publishers; 2003. pp. 297–302. [Google Scholar]
- 20.Jaynes DB, Colvin TS, Kaspar TC. Identifying potential soybean management zones from multi-year yield data. Computer and Electronics in Agriculture. 2005;46(1-3):309–327. doi: 10.1016/j.compag.2004.11.011. [DOI] [Google Scholar]
- 21.Johnson CK, Doran JW, Duke HR, Wienhold BJ, Eskridge KM, Shanahan JF. Field-scale electrical conductivity mapping for delineating soil condition. Soil Sci Soc Am J. 2001;65:1829–1837. [Google Scholar]
- 22.Khosla R, Alley MM. Soil-specific management on mid-atlantic coastal plain soils. Better Crops with Plant Food. 1999;83(3):6–7. [Google Scholar]
- 23.Kitchen NR, Sudduth KA, Drummond ST. Soil electrical conductivity as a crop productivity measure for claypan soils. J Prod Agric. 1999;12:607–617. [Google Scholar]
- 24.Kitchen NR, Sudduth KA, Myersb DB, Drummonda ST, Hongc SY. Delineating productivity zones on claypan soil fields using apparent soil electrical conductivity. Computer and Electronics in Agriculture. 2005;46(1-3):285–308. doi: 10.1016/j.compag.2004.11.012. [DOI] [Google Scholar]
- 25.Lark RM, Stafford JV. Classification as a first step in the interpretation of temporal and spatial variation of crop yield. Ann Appl Biol. 1997;130:111–121. [Google Scholar]
- 26.Li Y, Shi Z, Wang RC, Makeschin F. Delineation of site-specific management zones based on temporal and spatial variability of soil electrical conductivity. Pedosphere. 2007;17(2):156–164. doi: 10.1016/S1002-0160(07)60021-6. [DOI] [Google Scholar]
- 27.Long DS, Carlson GR, DeGloria SD. Quality of Field Management Maps. In: Robert PC, Rust RH, Larson WE, editors. Proceedings of the 2nd International Conference on Site-Specific Management for Agricultural Systems; Madison, WI, USA: ASA, CSSA, SSSA; 1994. pp. 251–271. [Google Scholar]
- 28.Odeh IOA, McBratney AB, Chittleborough DJ. Soil pattern recognition with fuzzy-c-means: application to classification and soil-landform interrelationships. Soil Sci Soc Am J. 1992;56:505–516. [Google Scholar]
- 29.Ortega RA, Santibáňez OA. Determination of management zones in corn (Zea mays L.) based on soil fertility. Computer and Electronics in Agriculture. 2007;58(1):49–59. doi: 10.1016/j.compag.2006.12.011. [DOI] [Google Scholar]
- 30.Reyniers M, Maertens K, Vrindts E, de Baerdemaeker J. Yield variability related to landscape properties of a loamy soil in central Belgium. Soil Tillage Res. 2006;88(1-2):262–273. doi: 10.1016/j.still.2005.06.005. [DOI] [Google Scholar]
- 31.Robert PC, Rust RH, Larson WE. Precision Agriculture. Madison, WI, USA: ASA, CSSA, SSSA; 1996. [Google Scholar]
- 32.Schepers AR, Shanahan JF, Liebig MK, Schepers JS, Johnson SH, Luchiari AJr. Appropriateness of management zones for characterzing spatial variability of soil properties and irrigated corn yields across years. Agronomy Journal. 2004;96:195–203. [Google Scholar]
- 33.Shi Z, Huang MX, Li Y. Physico-chemical properties and laboratory hyperspectral reflectance of coastal saline soil in Shangyu City of Zhejiang Province, China. Pedosphere. 2003;13(3):111–120. [Google Scholar]
- 34.Stafford JV, Lark RM, Bolam HC. Using Yield Maps to Regionalize Fields into Potential Management Units. In: Robert PC, Rust RH, Larson WE, editors. Proceedings of the 4th International Conference on Precision Agriculture; Madison, WI, USA: ASA, CSSA, SSSA; 1998. pp. 225–237. [Google Scholar]
- 35.Sudduth KA, Kitchen NR, Hughes DF, et al. Electromagnetic Induction Sensing as an Indicator of Productivity on Claypan Soils. In: Robert PC, Rust RH, Larson WE, editors. Proceedings of the 2nd Internal Conference on Site-Specific Management for Agricultural Systems; Madison, WI, USA: ASA, CSSA, SSSA; 1995. pp. 671–681. [Google Scholar]
- 36.Vrindts E, Mouazen AM, Reyniers M, Maertens K, Maleki MR, Ramon H, de Baerdemaeker J. Management zones based on correlation between soil compaction, yield and crop data. Biosyst Eng. 2005;92(4):419–428. doi: 10.1016/j.biosystemseng.2005.08.010. [DOI] [Google Scholar]


