

Abstract
There has been a long-standing need for a technique that can provide fast, accurate and precise results regarding the presence of hazardous levels of lead in settled house dust. Several home testing kits are now available. One kit manufactured by Hybrivet (LeadCheck Swabs) is advertised as able to detect lead dust levels that exceed the U.S. Environmental Protection Agency’s dust lead standard for floors (40 μg/ft2). The purpose of the study was to determine the ability of LeadCheck Swabs to instantly detect lead in dust above EPA’s hazard standard. A trained risk assessor collected two hundred LeadCheck Swab samples side-by-side with standard dust wipe samples. The result of the LeadCheck Swab (positive (pink or red) or negative (yellow to brown)) was compared with the laboratory results for the corresponding dust wipe (over or under 40 μg/ft2). The LeadCheck Swabs produced a false negative rate of 64% (95% confidence interval: 55%, 72%). The likelihood of a swab producing a false negative depended on substrate (painted or non-painted) and surface type (floor or sill). Changing the interpretation rule by classifying all swab colors except yellow as positive yielded lower false negative rates under some test conditions, but still produced high error rates. LeadCheck Swabs do not reliably detect levels of lead in dust above 40 μg/ft2 using published methods under field conditions. Further research into alternate methodologies and interpretation guidance is needed to determine whether the swabs can be appropriately used by consumers and others to test homes for lead dust hazards.
Keywords: Lead hazard assessment, Childhood lead poisoning, Spot test kit, Lead dust, Lead testing
Introduction
In the past, the public’s concerns about childhood lead poisoning focused on children with high lead levels resulting from ingesting lead based paint chips. Studies now show that lead dust from deteriorated lead-based paint and contaminated bare soil is the primary cause of elevated blood lead levels (Lanphear et al. 1998b; Bornschein et. al. 1987).
Children in homes with higher interior dust lead loadings are expected to have higher blood lead levels (Lanphear et al., 1998b; Lanphear et al., 1998c; Davies et al., 1990). Lanphear et al. showed that a child’s blood lead level was expected to be 14% higher when the floor dust lead loading was 40 μg/ft2 than when it was 20 μg/ft2 (1998a).
Importantly, researchers have documented significant health impacts of childhood lead poisoning at lower blood lead levels (Canfield et al. 2003; Lanphear et al. 2000; CDC 1991). The recognition of threats posed by relatively low levels of household dust lead has increased the interest of resident and community groups and others in inexpensive methods for quickly and effectively determining the existence of lead dust hazards in their homes.
The Alliance for Healthy Homes’ Community Environmental Health Resource Center (CEHRC) was the first wide scale program to help community groups sample dust and soil for lead in high-risk communities throughout the country (AFHH, 2006). As of 2005, community organizations had tested 3,200 homes in 13 cities through the CEHRC initiative. This information has helped residents promote lead hazard reduction both on a house-by-house and community-wide basis.
The CEHRC program and similar efforts have relied on dust wipe sampling using the standardized techniques adopted by the U.S. Environmental Protection Agency (EPA) and the U.S. Department of Housing and Urban Development (HUD). CEHRC trains community members in lead sampling for hazard identification (see EPA’s July 2000 Lead Sampling Technician course and 40 CFR Part 745 Subpart D, USEPA 2001). After these trained community members conduct a visual inspection, they collect dust lead samples on floors and windows in at least four rooms in each home, and mail them to an accredited lab for analysis.
While this process yields comprehensive and objective measurements of lead dust hazards in a dwelling, it has several drawbacks. Samplers must be carefully trained and supervised to maintain quality control and prevent contamination of samples. The laboratory report of dust lead levels is not immediately available, necessitating a second visit to the home to inform the occupant of the results. Although less expensive than professional risk assessments, which range from $300 to $600 per house, the laboratory fees (around $7 per sample, or an average of around $60 per house) plus labor costs of the visual and dust wipe hazard assessment are prohibitive to many families and community groups.
Because of these limitations, community-based organizations and others have actively searched for alternatives to accurately, immediately, and cheaply screen housing for lead hazards. Spot lead test kits were initially developed to detect lead in paint and on consumer products such as glazed ceramics, jewelry and mini-blinds. Various types of inexpensive lead paint spot test kits have been available since the 1970’s (NIST, 2000). Their accuracy is not regulated; however, independent studies have been conducted to determine the accuracy of chemical spot tests for leaded paint (NIST, 2000).
The brand of spot test kits used in this study, LeadCheck Swabs, has been produced by Hybrivet since 1991 for lead-based paint testing. This brand was chosen for this study because of its widespread availability and use by community groups. The swab works by releasing a liquid containing rhodizonate ion from its tip, which turns pink or red when reacting with lead. This color change gives an immediate indication of the presence of lead. In quality control testing by the manufacturer, the chemical sensitivity of the LeadCheck Swabs was determined to be 2 micrograms of lead ion (Hybrivet, 1993). Importantly, the Hybrivet website does not state whether the 2 microgram level refers to lead in solution or particulate matter. The Hybrivet web site states that the swabs are able to ″detect down to 2 micrograms of lead in defined laboratory testing, and reliably detect 0.5% lead in paint with virtually 100% accuracy (within 95% Confidence limits)″ (Hybrivet, 2006). The website references third-party studies conducted by NIST (2000) and EPA (1995), among others, as supporting its statements.
At the conclusion of most lead hazard control interventions in federally assisted housing built before 1978, a certified risk assessor or lead sampling technician must verify that the lead hazard control work is complete and that the area is safe for residents, a process referred to as “clearance.” Risk assessors are required to conduct a visual examination of the worksite to verify that all specified work is complete, that deteriorated lead-based paint (or deteriorated paint presumed to be lead-based paint) and lead-contaminated bare soil are satisfactorily controlled and that no visible settled dust or debris remains. If the dwelling passes the initial visual examination, then the clearance examiner will collect dust wipe samples from the floor and window sill in at least four rooms of the dwelling, focusing especially on rooms where lead hazard control work was done. . If the clearance examiner determines that the dwelling unit does not pass the visual examination or if any dust sample has a dust lead loading at or above the applicable clearance standards (40 μg/ft2 for floors, 250 μg/ft2 for window sills, and 400 ug/ft2 on window troughs), then the dwelling will fail clearance and additional lead hazard control work must be completed and/or the dwelling must be re-cleaned (U.S. EPA 2001).
CEHRC and other groups have adopted similar standards using visual and dust wipe assessments for hazard identification under normal living conditions (not post-renovation). However, given the costs of dust wipe testing, these groups have sought less expensive methods for residents and community members to detect hazardous levels of lead in dust.
LeadCheck Swabs hold widespread appeal for residents who want to know about dust lead hazards in their homes but cannot access or afford a full risk assessment or hazard screen. In a 2004 survey of county health departments in New York, one county reported that it recommended LeadCheck Swabs to parents who called the health department with concerns about lead in their homes (Korfmacher KS unpublished data). Community groups in Cleveland (OH), Greensboro (NC), Hartford (CT), Indianapolis (IN), Los Angeles (CA), National City (CA), and San Francisco (CA), have used them to check paint and/or dust and to educate residents about potential lead hazards. In early 2005, the Indiana State Department of Health bought more than 50,000 LeadCheck Swabs to serve as a screening and educational tool to educate consumers, especially new mothers bringing infants home from the hospital.
LeadCheck Swabs have appealed to community groups because they provide immediate results. They are also economical - when purchased in bulk, single swabs cost around $1.30 each. They are easily available in many retail outlets. Given the manufacturer’s claims that they can detect lead in dust at levels equal to the EPA standard for floors, they may appear to be a helpful tool when dust wipes are not feasible due to resource constraints or when the delay in getting laboratory results is a problem. In addition, because a positive result of a home test kit must be disclosed by the property owner to future tenants and/or buyers as part of lead hazard disclosure, they may be a useful tool for alerting owners and buyers to the potential risk from lead. According to the EPA and HUD, “if an owner has information obtained from the use of a home test kit for lead, that information must be disclosed; however, the owner should also disclose information about the reliability of the test kit” (USEPA 1996, p. 6).
Historically, the widespread use of spot test kits has been hampered by the failure to document acceptable sampling and analytical rates of error. Specifically, the kits may not be able to get lead into solution, where it can react with a colorimetric reagent, such as rhodizonate or sulfide, to produce a pink or black color, respectively. In the laboratory procedure, dust lead wipe samples are typically treated with hot nitric and other strong acids to enable the lead to enter solution. The solution is then typically analyzed by atomic absorption spectroscopy, ICP, or other process. Clearly, the use of hot strong acid solutions in the home environment poses its own hazards. If the spot test kit fails to contact lead in a form that causes the color reaction to occur, no observable color change can occur and no lead will be detected, even if it present.
In addition, while community groups see great potential for spot test kits to aid in hazard identification, some professional risk assessors, public health officials, and others have expressed concerns about the potential of spot test kits to mislead consumers using them to screen for lead hazards. Some professionals have expressed doubts that residents will know where to test or be able to use the test kits properly. The color change is subjective and may not be observable to all, especially color-blind individuals.
The primary concern, however, is the risk of false negatives. That is, if a home test kit fails to detect an existing hazard, residents may believe that their homes are safe. Or, residents may conduct renovation or remodeling activities that disturb lead-based paint thus generating even higher dust lead loadings. If spot test kits are to be used for dust lead hazard identification, they must have a very low rate of false negatives (high sensitivity).
A review of the peer-reviewed literature produced no studies evaluating the accuracy of the swabs and/or swab protocol under laboratory or field conditions in detecting dust lead levels above 40 μg/ft2. One field study examined the effectiveness of the swabs in detecting dust lead levels above 200 μg/ft2 (Pinto 1996). Hybrivet based their LeadCheck Swabs protocol for testing lead in dust on an extrapolation from this study. The research reported here was conducted to address the lack of data on the effectiveness of LeadCheck Swabs to detect lead in dust at the EPA’s standard for floors (40 μg/ft2) using published methods under field conditions.
Materials and methods
This study compared side-by-side samples using two different methods: LeadCheck Swabs and standard dust wipes. Dust wipe samples were collected by an EPA trained risk assessor according to established methodologies (USEPA, 2001). Areas with visibly deteriorated paint or chips in the area to be wiped were avoided. Dust wipes are generally taken over an area of one square foot. If this was not possible (for example, on a window sill with a surface area less than one square foot), the largest area possible was sampled while leaving room for a swab test on the same surface. Dust wipe analysis was conducted by a certified laboratory (Schneider Laboratories) using the EPA 7420 method utilizing flame atomic absorption spectroscopy, which reported results in micrograms per square foot. The method detection limit of the laboratories was 20 μg/sample.
Field technicians were trained to use LeadCheck Swabs in accordance with protocols listed on the manufacturer’s web site and in packaging materials. The technicians sampled an area of 2.7 × 2.7 inches directly adjacent to the dust wipe sample area. On window sills, the swab sample was collected at one end of the sill. According to the manufacturer’s instructions, the yellow swab would turn pink if lead loadings within this “palm sized area” exceed 40 μg/ft2. The resulting color of the swab was recorded as yellow, brownish yellow, yellowish brown, brown, or pink/red (see Figure 2). If the swab yielded a negative result (no clear pink color), it was tested by squeezing some of the remaining fluid on a control leaded surface provided by the manufacturer as part of the kit to determine if the swab was defective (none were).
Figure 2. LeadCheck Swab color results.
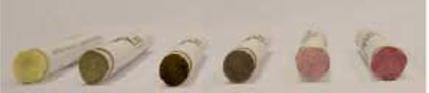
2a: Photograph of LeadCheck Swabs showing positive, negative, and inconclusive results.
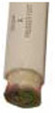
2b: Inset: top view of dirty swab with pink visible behind tip
An average of four samples per house were taken from a total of 50 pre-1978 homes, between June 2004 and March 2006 in Rochester New York as part of an ongoing lead hazard assessment program. Most of these homes were located in neighborhoods at high risk for lead hazards. Surface (floor or sill) and substrate (painted or unpainted) were recorded for each sample site. Approximately equal numbers of floors and sills were sampled to ensure a wide range of dust lead levels.
Two different rules were used for interpreting the color results of the swabs. Using a strict interpretation of the manufacturer’s instructions, only those swabs that showed a distinctive pink or red color were recorded as positive for lead in dust hazards. Swabs with a brown tip but clear red color behind the tip were also recorded as positive (see Figure 2, fourth sample from left, and inset showing top view of this sample). All other shades (yellow through brown) were recorded as negative. An alternate interpretation was also used, under which only those swabs that were clearly just yellow were recorded as negative. All others (brownish yellow through pink/red) were recorded as positive.
Data were analyzed using SAS Version 9.1 (Copyright © 2002-2003 by SAS Institute Inc., Cary, NC, USA). The ability of the swab result (positive or negative) to predict the dust wipe result (≥40 μg/ft2 or <40 μg/ft2) was assessed with the sensitivity, specificity, negative predictive value, and positive predictive value. The sensitivity is the probability that the swab result is positive given that the dust wipe loading is ≥40 μg/ft2. The false negative rate is 100% minus the sensitivity. The specificity is the probability that the swab result is negative given that the dust wipe loading is <40 μg/ft2. The false positive rate is 100% minus the specificity. The positive predictive value (PPV) is the probability that the wipe result is ≥40 μg/ft2 given that the swab result is positive. The negative predictive value (NPV) is the probability that the wipe result is <40 μg/ft2 given that the swab result is negative.
The sensitivity, specificity, NPV and PPV were calculated for painted and unpainted surfaces, floors and windowsills and overall. Fisher’s exact test was calculated with SAS procedure FREQ to test the hypothesis that there was a relationship between the swab result and the dust wipe result. Logistic models were created with SAS procedure GENMOD to determine if the probability of a positive dust swab result depends on the dust wipe loading, substrate (painted or unpainted), and/or surface (floor or sill). Separate models were created for the standard and alternate swab interpretation rules. The following three effects were included in each model:
The dust wipe loading (μg/ft2) (log-transformed to achieve a normal distribution)
An interaction term that allowed the effect of the dust wipe lead loading on the swab wipe result to differ for painted and unpainted surfaces
An interaction term that allowed the effect of the dust wipe lead loading on the swab result to differ for sills and floors
Results
The sensitivity and specificity of the LeadCheck Swabs was calculated for both the strict (manufacturer’s) interpretation of the instructions and the alternate interpretation on different types of surfaces and substrates (Tables 1 and 2).
Table 1.
Performance of LeadCheck Swabs using the “standard” interpretation rule by surface and substrate type.
| Surface | Substrate | Number of Samples | Percent of wipes that exceed 40μg/ft2 | Percent of swabs that turn pink/red) | Sensitivity (95% CI) (%) | PPV (95% CI) (%) | Specificity (95% CI) (%) | NPV (95% CI) (%) | Fisher’s Exact Test P-value |
|---|---|---|---|---|---|---|---|---|---|
| Floors & Sills | All | 200 | 60 | 23 | 36(28,45) | 93(82,99) | 96(90,99) | 51(42,59) | <0.001 |
| Painted | 104 | 72 | 36 | 45(34,57) | 92(78,98) | 90(73,98) | 39(27,51) | 0.001 | |
| Unpainted | 96 | 46 | 9 | 20(10,35) | 100(66,100) | 100(93,100) | 60(49,70) | 0.001 | |
| Floors | All | 94 | 38 | 7 | 19(8,36) | 100(59,100) | 100(94,100) | 67(56,76) | 0.001 |
| Painted | 29 | 59 | 21 | 35(14,62) | 100(54,100) | 100(74,100) | 52(31,73) | 0.028 | |
| Unpainted | 65 | 29 | 2 | 5(0,26) | 100(3,100) | 100(92,100) | 72(59,82) | 0.292 | |
| Sills | All | 106 | 78 | 37 | 43(33,55) | 92(79,98) | 87(66,97) | 30(19,42) | 0.007 |
| Painted | 75 | 77 | 41 | 48(35,62) | 90(74,98) | 82(57,96) | 32(19,48) | 0.028 | |
| Unpainted | 31 | 81 | 26 | 32(15,54) | 100(63,100) | 100(54,100) | 26(10,48) | 0.298 |
Table 2.
Performance of LeadCheck Swabs using the “alternate” interpretation rule by surface and substrate type.
| Surface | Substrate | Number of Sample s | Percent of wipes that exceed 40μg/ft2 | Percent of swabs that turn brown/ red* | Sensitivity (95% CI) (%) | PPV (95% CI) (%) | Specificity (95% CI) (%) | NPV (95% CI) (%) | Fisher’s Exact Test P-value |
|---|---|---|---|---|---|---|---|---|---|
| Floors & Sills | All | 200 | 60 | 58 | 72(63,80) | 74(65,82) | 63(52,73) | 61(49,71) | <0.001 |
| Painted | 104 | 72 | 74 | 79(68,87) | 77(66,86) | 38(21,58) | 41(22,61) | 0.133 | |
| Unpainted | 96 | 46 | 41 | 61(45,76) | 69(52,83) | 77(63,87) | 70(57,82) | <0.001 | |
| Floors | All | 94 | 38 | 46 | 72(55,86) | 60(44,75) | 71(57,82) | 80(67,90) | <0.001 |
| Painted | 29 | 59 | 83 | 88(64,99) | 63(41,81) | 25(5,57) | 60(15,95) | 0.622 | |
| Unpainted | 65 | 29 | 29 | 58(33,80) | 58(33,80) | 83(69,92) | 83(69,92) | 0.002 | |
| Sills | All | 106 | 78 | 69 | 72(61,82) | 82(71,90) | 43(23,66) | 30(16,49) | 0.203 |
| Painted | 75 | 77 | 71 | 76(63,86) | 83(70,92) | 47(23,72) | 36(17,59) | 0.079 | |
| Unpainted | 31 | 81 | 65 | 64(43,82) | 80(56,94) | 33(4,78) | 18(2,52) | 1.000 |
Positive swabs under this “alternate” interpretation rule are those that turn brown, red or pink, but not yellow
Under the strict interpretation, the overall sensitivity of LeadCheck Swabs was very low (36%). Interestingly, the sensitivity of swabs was higher on painted surfaces (45%) than on unpainted surfaces (20%). For both unpainted floors and sills, there was no association between the swab result and the dust wipe result (p=0.292 and p=0.298). The highest sensitivity is on painted sills (48%), the lowest on unpainted floors (5%). Overall, the swabs seem to do better on sills than on floors. Dust lead loadings tended to be higher on sills, where 78% of the samples were above 40 μg/ft2 (geometric mean (GM) 206 μg/ft2, geometric standard deviation (GSD) 6.0), compared to 38% for floors (GM 41 μg/ft2, GSD 5.5). Figure 3 presents percent of positive, possibly positive, and negative swabs by wipe dust lead loading. “Possibly positive” is defined as a swab result that is brown or a mix of brown and yellow, which is positive under the alternative interpretation but negative under the standard interpretation. Figure 3 shows that the swabs consistently performed better at higher dust lead levels under the standard interpretation.
Figure 3.

Percent of positive, possible positive, and negative swab results by dust wipe loading
The alternate interpretation, in which all non-yellow swabs are considered positive, is much more conservative. Not surprisingly, the alternate interpretation resulted in higher sensitivity overall. Nonetheless, there was no association between swab and wipe results for painted floors (p=0.622), painted sills (p=0.079) or unpainted sills (p=1.0). A large percentage of floor samples (39%) resulted in some shade of brown color between yellow and pink and were therefore counted as positive under the alternate interpretation. Figure 3 shows that the swabs did not consistently perform better at higher dust lead levels using the alternate interpretation.
The parameter estimates for significant variables from the models for both the standard and alternate interpretations are presented in Table 3. For the standard interpretation, the relationship between dust wipe loading and the swab result is different for painted and unpainted surfaces (p=0.002), while controlling for location (floor or sill) and dust wipe loading. Swabs are more likely to be positive on painted surfaces than unpainted surfaces while controlling for dust wipe loading and location (i.e., floor or sill). Furthermore, higher wipe loadings increase the odds of a positive swab more on painted surfaces than on unpainted surfaces. In addition, the relationship between dust wipe loading and the swab result is different for floors and sills (p=0.016), while controlling for surface type and dust wipe loading. Higher wipe loadings increase the odds of a positive swab result more on sills than on floors. In other words, while controlling for dust wipe loading levels and surface type (i.e., painted or unpainted), swabs are more likely to be positive on window sills than floors.
Table 3.
Parameter Estimates for Significant Variables in the Logistic Models to Predict the a Positive Swab Result
| Parameter | Location | Surface Type | Standard Interpretation | Alternative Interpretation | ||
|---|---|---|---|---|---|---|
| Estimate (Standard Error) | P-Value | Estimate (Standard Error) | P-Value | |||
| Intercept | -- | -- | -5.199 (0.790) | <.001 | -2.027 (0.454) | <.001 |
| Log Dust Wipe Loading | -- | -- | 0.665 (0.140) | <.001 | 0.4159 (0.107) | <0.001 |
| Log Dust Wipe Loading * Location | Floor | -- | -0.203 (0.087) | 0.019 | -- | -- |
| Log Dust Wipe Loading * Surface Type | -- | Painted | 0.241 (0.079) | 0.002 | 0.2459 (0.075) | 0.001 |
The relationship between dust wipe loading and the swab result for the alternate interpretation does not differ by sampling location (p=0.379), while controlling for surface type and wipe loading. However, similar to the standard interpretation, surface type (i.e. painted or unpainted) did affect the relationship between dust wipe loading and the swab result (p<0.001). Higher wipe loadings increase the odds of a positive swab result more on painted surfaces than on unpainted surfaces. That is, while controlling for dust wipe loading, swabs are more likely to be positive on painted surfaces than unpainted surfaces.
Discussion
Overall, the rate of false negatives for the LeadCheck Swabs was 64% (sensitivity of 36%). Thus, nearly two-thirds of the samples taking according to spot test kit instructions for detecting lead in dust and received a negative result, hazardous levels of dust lead (i.e., ≥40 μg/ft2) were actually present.
There are a number of possible reasons why the LeadCheck Swabs did not perform as well as expected for detecting lead in dust under field conditions. First, the number of brown colored swab results suggests that dirt may interfere with the overall sensitivity of the swabs. Many of the swabs turned some shade of brown between the pure yellow and pink/red color results discussed in the LeadCheck Swab instructions. This suggests that household dirt may interfere with the reaction between the dye in the LeadCheck Swabs and reactive lead in the dust. Dust wipes are analyzed using flame atomic absorption spectroscopy (FAAS), inductively coupled plasma emission spectrometry or other similar procedure, which detects total lead that has been dissolved and digested using strong acid and reflux, whereas the swabs may only detect free lead ions that have been dissolved using the reagent in the swabs, which is not a strong acid. Lead that is bound to other molecules or insoluble might not trigger the swabs’ chemical reaction.
It should be noted that the color change of the LeadCheck Swabs when exposed to insoluble salts of lead, such as lead pyromorphite, lead chromate or lead sulfide, is unknown and not characterized by this study. Neither the standard method of digesting and analyzing lead dust wipe samples nor the swab method considers the effect of solubility or bioavailability (Cotter-Howells and Thornton 2005). However, it is noteworthy that dust wipe samples, which analyze total lead, have been shown to be well correlated with children′s blood lead level in both localized and nationwide studies, without controlling for speciation of lead salts (Lanphear et al. 1995; Wilson et al. 2006). Before any spot test kit for lead dust is considered to be sufficiently reliable, the association between the kit’s result and children’s blood lead levels should be established.
Alternately, dirt on the swabs may make it difficult to see the true color change that resulted from the chemical reaction. That is, even if the reaction occurred the swab may appear to be brown. The manufacturer’s instructions do not guide users in how to interpret a brown color result on a swab (Figure 1); however, given the emphasis on a “red” or “pink” color, users are likely to consider a brown swab to be negative for lead. One way to compensate for the uncertainties introduced by intermediate brown color results is to use the alternate interpretation rule for the LeadCheck Swabs’ color result devised for this study. That is, the instructions could guide users to consider any swab that is not pure yellow to be “positive” for lead. Under this alternate interpretation rule, the false negative rate drops to less than a third (28%). Using this more conservative approach to interpreting the color results of the LeadCheck Swabs could reduce false negatives greatly. However, the swabs’ overall effective sensitivity is still only 72% (95% CI: 63%, 80%) using the alternate interpretation (Table 2), which is not appropriate for a screening test to determine whether hazardous levels of lead are present in dust.
Figure 1.

Directions for LeadCheck Swabs (from manufacturer’s packaging insert)
It is also possible that different results in side-by-side swab and wipe samples may be a consequence of spatial variability in dust lead levels or different sized areas being sampled. Although average dust lead levels over a square foot area may exceed 40 μg/ft2, the small sub-section of that area tested with the swab may have a lower dust lead level. The accepted protocol for dust wipes is to sample as close to one square foot as possible. Previous studies have shown that wipe dust lead loadings from side-by-side samples on floors (areas of 1 ft2) and sills (areas of 1/3 the sill) may vary substantially (Emond et al., 1998). This variation is likely to be amplified when using swabs, since the area inside a square with sides of 2.7 inches recommended in the LeadCheck Swabs protocol is around 5% of a square foot. Thus, one might expect significant variance in results when the sampled areas are as small as the swabbed areas. However, random variation in the spatial distribution of lead would be expected to result in more disparate results, and not in consistently lower rates of positive results for wipes than swabs as was found in this study. Despite this spatial variability, the standard dust wipe procedure using the standardized surface area sizes has been shown to be significantly correlated with children’s blood lead level (Lanphear et al. 1995; NCHH, 2004; Wilson, 2006).
For both the standard and alternative swab interpretations, swabs are more likely to be positive on painted surfaces than unpainted surfaces, while controlling for dust wipe loading. This could be due to the swab picking up lead from the painted surface or underlying layers of paint if the top layer is in poor condition. If this is the case, the sensitivity of the swabs for dust may have been artificially inflated by reactions to underlying paint, although it is unlikely the top coat is lead-based paint. If so, the actual sensitivity of the LeadCheck Swabs for dust may be closer to the sensitivities calculated for non-painted surfaces, which are lower. Another possibility is that painted surfaces are smoother, allowing the swabs to more effectively pick up any dust on the surface than on a non-painted surface.
Although the standard of 40 μg/ft2 does not apply to window sills, this paper examined the performance of the dust swabs on sills because their inclusion allowed us to examine the swabs’ performance over a larger range of dust lead loadings. We expected performance of the swabs on sills to be better than on floors due to higher dust lead loadings. However, this effect may have been offset by the higher variability in dust lead loadings on windowsills than floors (Emond et al., 1997). For the standard interpretation, swabs were more likely to be positive on sills than floors even while controlling for wipe dust lead loading and surface type (i.e., painted or unpainted). This difference could be attributable to poorer paint condition on window sills than floors, exposing the swabs to lead paint in underlying paint layers. It could also be due to different sources of lead dust on sills and floors.
Dust sampling was conducted for hazard identification in the homes in this study. Lead in dust at the time of hazard identification could come from a variety of sources including friction, deterioration, and tracked-in dust or soil. In a clearance test, the lead dust of concern is predominately from disturbance of lead-based paint. Thus, inferences from these results should be limited to hazard identification dust sampling, not clearance dust sampling. Floor dust lead loadings in the homes in this study were very high compared to the national averages (Jacobs et al., 2002). Thirty-eight percent of floor loadings were above 40 μg/ft2 in this study, but only 8% of pre-1978 homes in the nation have loadings above 40 μg/ft2 (USHUD, 2001). The overall false negative rate for LeadCheck Swabs in this study was 64%, but the false negative rates were lower at higher dust lead loadings. For wipe loadings more likely to be observed under normal conditions in pre-1978 housing (between 40 and 100 μg/ft2), the false negative rate was 85%. Thus, the swabs may have actually performed better in this study of high-risk housing than they would in average pre-1978 housing.
Conclusions
The results of this study suggest that LeadCheck Swabs do not reliably detect levels of lead in dust above 40 μg/ft2 using published methods under field conditions. The swabs did not accurately predict hazardous levels of dust lead loading for any studied surface (i.e., floors or sills) or substrate (i.e., painted or unpainted).
Thorough research needs to be conducted before LeadCheck Swabs or other spot test kits should be considered for clearance or hazard identification dust sampling. Future studies should explore the effects of the interference of dirt in the chemical reaction, a refined interpretation rule for the color results, and interference of underlying paint lead. Different lead sources (paint, soil, etc.) should be tested to explore whether the swabs are more reliable in detecting certain kinds of lead, and whether the presence of pyromorphite significantly inflates the rate of false positives under field conditions. The swabs should be validated over the appropriate range of dust lead levels and surface conditions (e.g. smooth and cleanable versus rough). Studies should also be based in a number of different cities due to regional differences in lead dust. Future studies should also consider swabbing larger areas, although the size of the area sampled may be limited by the quantity of reagent used in the spot test kits. Ultimately, spot test kits should be field tested both by trained samplers and by untrained users typical of consumers (e.g. residents and contractors) likely to use the product.
Guidance for the use of spot test kits for both dust and paint should clearly explain the risks of false negatives and lay out appropriate follow-up actions when negative results are achieved. Given the low level of understanding of false negatives by many user groups and the high costs of false negatives in terms of risks to children’s health, consumers may not be able to appropriately use and interpret the swabs without the support of trained staff who can offer advice and follow-up testing.
ACKNOWLEDGEMENTS
The authors thank field staff Kate Kuholski, Deanne Mraz, Julie Rombaut, Steven Turner, and David Wilson as well as David Jacobs, Jane Malone, Rebecca Morley, Tom Neltner, Ralph Scott, Marcia Stone and Sally Thurston for comments on drafts of this paper.
FUNDING SOURCES
This research was supported by NIEHS grant number P30 ES01247 to the University of Rochester’s Environmental Health Sciences Center. The National Center for Healthy Housing provided funding for the statistical analysis and reporting.
Footnotes
Publisher's Disclaimer: This is a PDF file of an unedited manuscript that has been accepted for publication. As a service to our customers we are providing this early version of the manuscript. The manuscript will undergo copyediting, typesetting, and review of the resulting proof before it is published in its final citable form. Please note that during the production process errors may be discovered which could affect the content, and all legal disclaimers that apply to the journal pertain.
HUMAN SUBJECTS/EXPERIMENTAL ANIMALS: none involved
Contributor Information
Katrina Smith Korfmacher, Environmental Health Sciences Center, 601 Elmwood Avenue, University of Rochester, Rochester, NY 14642
Sherry Dixon, National Center for Healthy Housing
REFERENCES
- AFHH (Alliance for Healthy Housing) Community Environmental Health Resource Center; 2006. [[accessed 15 May 2006]]. Available: www.cehrc.org. [Google Scholar]
- Bornschein RL, Succop P, Krafft KM, Clark CS, Peace B, Hammond PB. Exterior surface dust lead, interior house dust and childhood lead exposure in an urban environment; Proceedings of the University of Missouri’s 20th Annual Conference, Trace Substances in Environmental Health; Columbia, Missouri: University of Missouri, Columbia, Missouri. 1987.pp. 322–332. [Google Scholar]
- Canfield RL, Henderson CR, Cory-Slechta DA, Cox C, Juski TA, Lanphear BP. Intellectual impairment in children with blood lead concentrations below 10 μg per Deciliter. New England Journal of Medicine. 2003;348(16):1517–1526. doi: 10.1056/NEJMoa022848. [DOI] [PMC free article] [PubMed] [Google Scholar]
- CDC (Centers for Disease Control and Prevention) Report No. 99-2230. U.S. Department of Health and Human Services, Public Health Services. CDC; Atlanta GA: 1991. Preventing lead poisoning in children: A Statement by the Centers for Disease Control. [Google Scholar]
- Cotter-Howells C, Thornton I. Sources and pathways of environmental lead to children in a Derbyshire mining village. Environmental Geochemistry and Health. 2005;13(2):127–135. doi: 10.1007/BF01734304. [DOI] [PubMed] [Google Scholar]
- Davies D, Thornton I, Watt J, Culbard E, Harvey P, Delves H, Sherlock J, Smart G, Thomas J, Quinn M. Lead intake and blood lead in two-year-old U.K. urban children. Sci Total Environ. 1990;90:13–29. doi: 10.1016/0048-9697(90)90182-t. [DOI] [PubMed] [Google Scholar]
- Emond MJ, Lanphear BP, Watts A, Eberly S. Measurement error and its impact on the estimated relationship between dust lead and children’s blood lead. Environ. Res. 1997;72(1):82–92. doi: 10.1006/enrs.1996.3693. [DOI] [PubMed] [Google Scholar]
- Galke W, Clark S, Wilson J, Succop P, Dixon S, Bornschein B, Jacobs D, McLaine P, Chen M. Evaluation of the HUD Lead Hazard Control Grant Program: Early Overall Findings. Environ. Res. Section A. 2001;86:149–156. doi: 10.1006/enrs.2001.4259. [DOI] [PubMed] [Google Scholar]
- Hybrivet [Accessed 15 May 2006];LeadCheck. 2006 Available: http://www.leadcheck.com/
- Hybrivet . LeadCheck Swabs. Instructions inserted in product packaging. 1993. [Google Scholar]
- Jacobs DE, Clickner RP, Zhou JY, Viet SM, Marker DA, Rogers JW, Zeldin DC, Broene P, Friedman W. The prevalence of lead-based paint hazards in U.S. Housing. Environ. Health Perspect. 2002;110(10):599–606. doi: 10.1289/ehp.021100599. [DOI] [PMC free article] [PubMed] [Google Scholar]
- Lanphear BP, Emond M, Jacobs DE, Weitzman M, Tanner M, Winter NL, Yakir B, Eberly S. A side-by-side comparison of dust collection methods for sampling lead-contaminated house dust. Environ. Res. 1995;68(2):114–23. doi: 10.1006/enrs.1995.1015. [DOI] [PubMed] [Google Scholar]
- Lanphear BP, Roghmann KJ. Pathways of lead exposure in urban children. Environ. Res. 1997;74(1):67–73. doi: 10.1006/enrs.1997.3726. [DOI] [PubMed] [Google Scholar]
- Lanphear BP, Burgoon DA, Rust SW, Eberly S, Galke W. Environmental exposures to lead and urban children’s blood lead levels. Environ. Res. 1998a;76:120–130. doi: 10.1006/enrs.1997.3801. [DOI] [PubMed] [Google Scholar]
- Lanphear BP, Matte T, Rogers J, Clickner R, Dietz B, Bornschein R, Succop P, Mahaffey K, Dixon S, Galke W, Rabinowitz M, Farfel M, Rohde C, Schwartz J, Ashley P, Jacobs D. The contribution of lead-contaminated house dust and residential soil to children’s blood lead levels: A pooled analysis of 12 epidemiologic studies. Environ. Res. 1998b;79:51–68. doi: 10.1006/enrs.1998.3859. [DOI] [PubMed] [Google Scholar]
- Lanphear BP, Weitzman M, Winter N, Tanner M, Yakir B, Eberley S, Matte T. Lead-contaminated House dust and Urban Children’s Blood Lead Levels. Am J Public Health. 1998c;86:1416–1421. doi: 10.2105/ajph.86.10.1416. [DOI] [PMC free article] [PubMed] [Google Scholar]
- Lanphear BP, Dietrich K, Auinger P, Cox C. Cognitive deficits associated with BLLs <10 μg/dL in US children and adolescents. Public Health Reports. 2000;115:521–529. doi: 10.1093/phr/115.6.521. [DOI] [PMC free article] [PubMed] [Google Scholar]
- McElvaine MD, DeUngria EG, Matte TD, Copley CG, Binder S. Prevalence of radiographic evidence of paint chip ingestion among children with moderate to severe lead poisoning, St. Louis, Missouri, 1989-1990. Pediatrics. 1992;89:740–742. [PubMed] [Google Scholar]
- NCHH . Evaluation of the HUD Lead Hazard Control Grant Program, Final Report. National Center for Healthy Housing and University of Cincinnati; Columbia, MD: 2004. [accessed 26 October 2004]. Available: www.hud.gov/utilities/intercept.cfm?/offices/lead/EvaluationFinalReport.pdf. [Google Scholar]
- NIST. Rossiter WJ, Vangel MG, McKnight ME, Dewalt G. Spot Test Kits for detecting lead in household paint: A laboratory evaluation National Institute of Standards and Technology. U. S. Department of Commerce; Washington, DC: 2000. NISTIR 6398. [Google Scholar]
- NIST [[accessed 13 October 2006]];Lead Test Kits. 2005 Available: www.osha.gov/SLTC/leadtest/intro.html.
- Pinto MA, Hunter M. Emergency Lead Cleanup. Industrial Safety & Hygiene News. 1998:20. [Google Scholar]
- Pinto MA. Field protocol for use of chemical reagents for lead detection. Kennedy-Western University, Department of Environmental Engineering; Agoura Hills, CA: 1996. [PhD Thesis] [Google Scholar]
- Stone MJ. President and Chief Technical Officer. Personal Communication. Mar 2, 2005.
- US Environmental Protection Agency (USEPA) A field test of lead-based paint testing technologies. Summary and technical report. Washington, DC: 1995. EPA 747-R-95-002a&b. [Google Scholar]
- US Environmental Protection Agency . Interpretive Guidance for the real estate community on the requirements for disclosure of information concerning lead based paint in housing. Part II. Office of Pollution Prevention and Toxics; Washington DC: Dec 5, 1996. www.epa.gov/lead/pubs/igd.pdf [Google Scholar]
- US Environmental Protection Agency (USEPA) [[accessed 26 October 2004]];Lead; identification of dangerous levels of lead; Final rule. 2001 January 5;:1211. 40 CFR Part 745. Available: http://www.epa.gov/lead/leadhaz.htm.
- U.S. HUD [[accessed 26 June 2006]];National Survey of Lead and Allergens in Housing. Final Report, Volume I: Analysis of Lead Hazards, Revision 6.0. 2001 April 18; Available: www.hud.gov/offices/lead/hhi/HUD_NSLAH_Vol1.pdf.
- Wilson J, Pivetz T, Ashley P, Jacobs D, Strauss W, Menkedick J, Dixon S, Tsai H-C, Brown V, Friedman W, Galke W, Clark S. Evaluation of HUD-funded lead hazard control treatments at 6 years post-intervention. Environ. Res. 2006;102(2):237–48. doi: 10.1016/j.envres.2006.04.007. [DOI] [PubMed] [Google Scholar]