Abstract
Transcriptional activation of erythropoietin, glycolytic enzymes, and vascular endothelial growth factor occurs during hypoxia or in response to cobalt chloride (CoCl2) in Hep3B cells. However, neither the mechanism of cellular O2 sensing nor that of cobalt is fully understood. We tested whether mitochondria act as O2 sensors during hypoxia and whether hypoxia and cobalt activate transcription by increasing generation of reactive oxygen species (ROS). Results show (i) wild-type Hep3B cells increase ROS generation during hypoxia (1.5% O2) or CoCl2 incubation, (ii) Hep3B cells depleted of mitochondrial DNA (ρ0 cells) fail to respire, fail to activate mRNA for erythropoietin, glycolytic enzymes, or vascular endothelial growth factor during hypoxia, and fail to increase ROS generation during hypoxia; (iii) ρ0 cells increase ROS generation in response to CoCl2 and retain the ability to induce expression of these genes; and (iv) the antioxidants pyrrolidine dithiocarbamate and ebselen abolish transcriptional activation of these genes during hypoxia or CoCl2 in wild-type cells, and abolish the response to CoCl2 in ρ° cells. Thus, hypoxia activates transcription via a mitochondria-dependent signaling process involving increased ROS, whereas CoCl2 activates transcription by stimulating ROS generation via a mitochondria-independent mechanism.
Mammalian cells exhibit many adaptive responses to hypoxia, including the transcriptional activation of erythropoietin (EPO) (1), vascular endothelial growth factor (VEGF) (2), and glycolytic enzymes (3). Systemically, these responses enhance the delivery of O2 to cells and facilitate the production of glycolytic ATP. Induction of these genes is mediated by hypoxia inducible factor 1 (HIF-1) (4, 5), a basic helix-loop-helix/PAS heterodimer transcription factor consisting of 120-kDa HIF-1α and 91- to 94-kDa HIF-1β subunits (6). The α subunit is unique to HIF-1 whereas HIF-1β (ARNT) can dimerize with the arylhydrocarbon receptor (7). During hypoxia, HIF-1 binds to the hypoxia response element within the 3′ flanking region of the EPO gene (5), the 5′ flanking region of the VEGF gene (2), and the regulatory elements encoding glycolytic enzymes (3). Progress has been made in understanding the transcriptional mechanisms activated during hypoxia, but the underlying mechanism of O2 sensing is not understood (8). Mechanisms including NADPH oxidase (9), cytochrome P450 (10), and an O2-binding heme protein (11) have been proposed. Mitochondria have been considered as possible O2 sensors, but mitochondrial inhibitors failed to activate transcription (12). But recent work has implicated mitochondria in the O2 sensing underlying functional responses to hypoxia (13). Mitochondria generate reactive oxygen species (ROS) at the ubisemiquinone site (14, 15), and a change in mitochondrial redox during hypoxia could alter the production of ROS, which are known to participate in other transcriptional responses (16). Finally, CoCl2 treatment activates EPO transcription during normoxia (17), and it has been suggested that cobaltous ions substitute for ferrous ions in heme, causing a conformational change in a heme protein O2 sensor (11). Our study tested the hypothesis that mitochondria act as O2 sensors by increasing the generation of ROS during hypoxia, and that CoCl2 mimics this response by augmenting ROS generation during normoxia.
MATERIALS AND METHODS
Cell Culture.
Hep3B cells were cultured to 70–90% confluence in α minimal essential medium supplemented with penicillin (100 units/ml), streptomycin (100 μg/ml), and 10% heat-inactivated fetal calf serum (GIBCO). Respiration-deficient Hep3B cells (ρ° cells) were generated by incubating wild-type cells in ethidium bromide (50 ng/ml) for 2–3 weeks in medium supplemented with pyruvate and uridine (18). The ρ° cells then were selected by exposing the cultures to mitochondrial inhibitors rotenone (1 μg/ml) and antimycin A (1 μg/ml), which are lethal to wild-type cells. Experimental hypoxia was achieved by using a mass flow controller to blend O2, CO2, and N2 to achieve different compositions at 37°C. Gas was humidified and delivered to the head space of 75-cm2 T flasks. Flasks had stoppers with inlet and outlet ports and were gently agitated to promote equilibration of the head space gas with the media.
Measurement of ROS.
Intracellular ROS generation was assessed by using 2′,7′-dichlorofluorescin (DCFH) diacetate. ROS in the cells oxidize DCFH, yielding 2′,7′-dichlorofluorescein (DCF). Cells on coverslips were perfused under controlled O2 conditions in a flow-through chamber (Penn Century, Philadelphia) at 37°C on an inverted microscope. Fluorescence images were acquired with a 12-bit digital camera (excitation 488 nm, emission 535 nm). Intensities are reported as percent of initial values or as arbitrary units, after subtracting background. Data were taken as the average fluorescence for groups of 20–30 cells.
In another study assessing ROS generation, Hep3B cells at 50% confluence were incubated with DCFH diacetate (10 μM) for 5 hr while the head space was gassed with different [O2]. The media then were removed, and the cells were lysed and centrifuged to remove debris, and the fluorescence was measured (excitation 500 nm, emission 530 nm). Data were normalized to the normoxic values.
Northern Analysis.
Cells were washed with PBS and RNA was extracted with TRIzol reagent, and 10 μg of poly(A)+ selected RNA was loaded per lane. Full-length human EPO cDNA and reverse transcription–PCR products generated with 3′-untranslated region-specific primers for aldolase, phosphoglycerate kinase, and VEGF (19) were used as probes.
Electrophoretic Mobility Shift Assay.
DNA-binding activity was assessed by using the double-stranded oligonucleotide probe containing the sequence 5′-GCCCTACGTGCTGTCTCA-3′, corresponding to the EPO 3′-enhancer, which contains the HIF-1 binding site. HIF-1, constitutive, and nonspecific DNA binding activities are indicated. Nuclear extracts were prepared from Hep3B cells (4). HIF-1 binding activity can be abolished with excess cold competitor but not with excess mutant cold competitor in which the HIF-1 binding site is altered (not shown).
RESULTS AND DISCUSSION
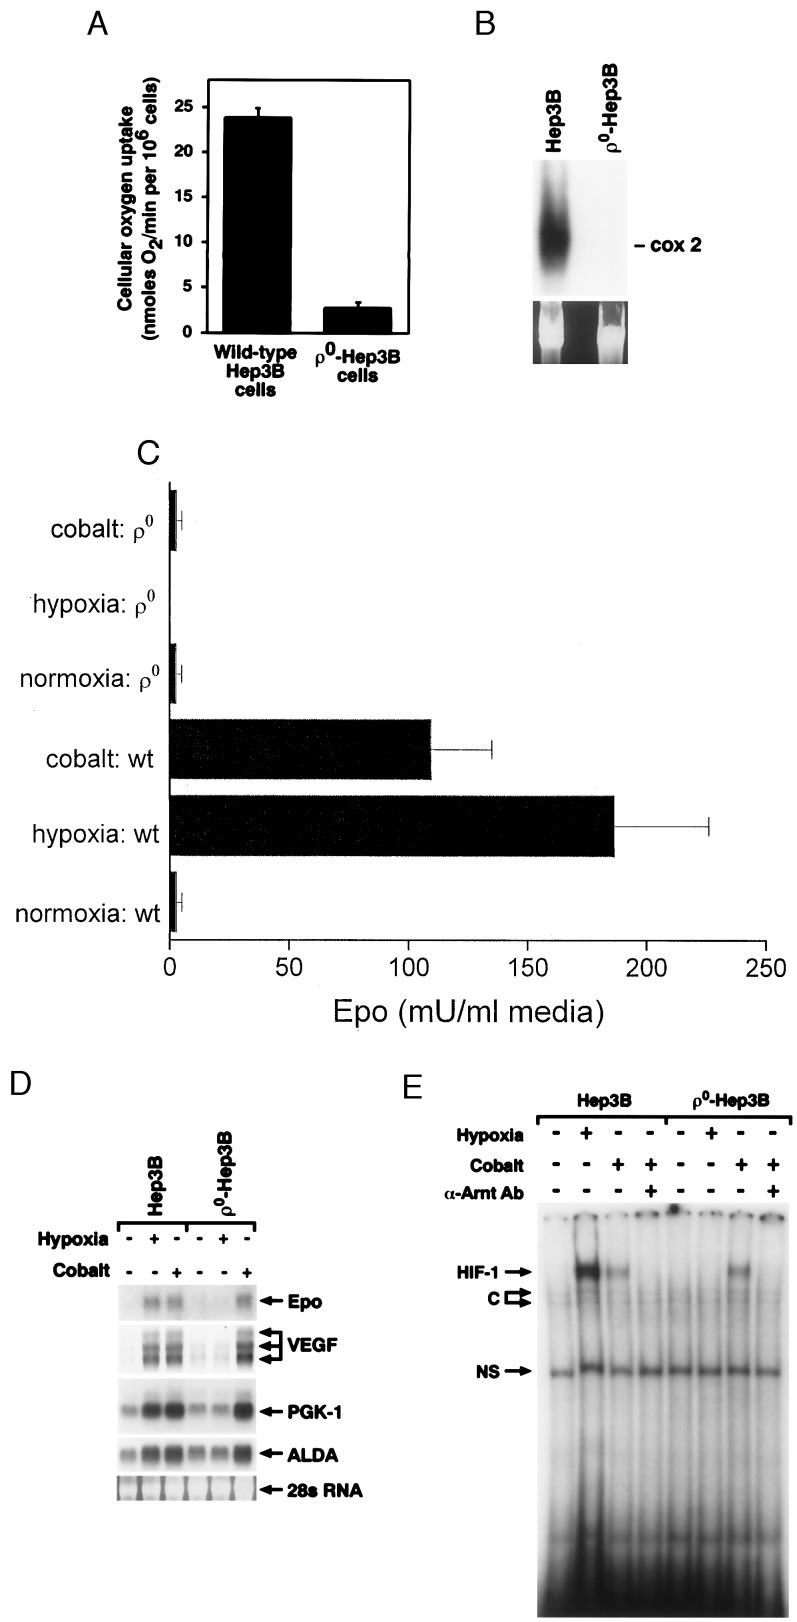
To determine the role of mitochondria in the gene activation response to hypoxia, ρ0 cells were generated, and their responses to hypoxia and CoCl2 were evaluated. The ρ0 cells lack mitochondrial DNA-derived proteins and are incapable of mitochondrial respiration because of the loss of key components of the electron transport chain. Accordingly, cellular O2 uptake by ρ0 cells was ≈10% of that in wild-type cells (Fig. 1A). Southern analysis confirmed the expected absence of cytochrome oxidase subunit II DNA in ρ0 compared with wild-type cells (Fig. 1B). The residual O2 uptake by ρ0 cells likely represents nonmitochondrial O2 use.
Figure 1.
(A) Cellular O2 uptake rates in wild-type and ρ0-Hep3B cells. (B) Southern blot analysis of undigested total cellular DNA from wild-type and ρ0-Hep3B cells. Hybridization was performed with a cytochrome oxidase subunit II probe, spanning bps 7757–8195, generated by reverse transcription–PCR. (C) EPO secretion from wild-type (wt) and ρ0-Hep3B cells exposed to normoxia (21% O2/5% CO2/74% N2), hypoxia (1.5% O2/5% CO2/93.5% N2), or CoCl2 (100 μM) during normoxia for 24 hr (n = 3, mean ± SD). EPO was measured by radioimmunoassay (46). (D) Northern blot analysis of RNA from wild-type and ρ0-Hep3B cells during normoxia (21% O2/5% CO2/74% N2), hypoxia (1.5% O2/5% CO2/93.5% N2), or CoCl2 (100 μM) during normoxia for 24 hr. ALDA, aldolase; PGK-1, phosphoglycerate kinase. (E) HIF-1 DNA binding in nuclear extracts from wild-type and ρ0-Hep3B cells. Both cell types were exposed to normoxia (21% O2/5% CO2/74% N2), hypoxia (1.5% O2/5% CO2/93.5% N2) or CoCl2 (100 μM) during normoxia for 4 hr. C, constitutive; NS, nonspecific.
EPO stimulates proliferation and differentiation of erythroid cells (20) and is secreted by Hep3B cells in response to hypoxia or CoCl2 during normoxia (11). Hypoxia (1.5% O2) and CoCl2 (100 μM) both stimulated EPO secretion (Fig. 1C) and mRNA expression (Fig. 1D) in wild-type cells, whereas ρ0 cells failed to secrete EPO in response to either stimulus. Hypoxia also failed to induce expression of EPO mRNA in ρ0 cells, yet they maintained their mRNA response to CoCl2. This pattern of mRNA expression also was observed for VEGF, aldolase, and phosphoglycerate kinase (Fig. 1D). The inability of ρ0 cells to secrete EPO in response to CoCl2 could be explained by a low energy state, but that condition did not interfere with their ability to activate a transcriptional response to CoCl2.
We also examined HIF-1 DNA binding activity. Nuclear extracts from wild-type cells exposed to hypoxia (1.5% O2) or CoCl2 (100 μM) for 4 hr contained a protein complex capable of binding a DNA probe containing the hypoxia response element located within the 3′-enhancer of the EPO gene (Fig. 1E). Cells treated with CoCl2 or hypoxia coincubated with an anti-arylhydrocarbon nuclear translocator antibody failed to form this complex, confirming its identity as HIF-1 (Fig. 1E and data not shown). The ρ0 cells failed to display HIF-1 DNA binding activity during hypoxia, but activity was detected after incubation with CoCl2. These responses were consistent with the mRNA expression data obtained from wild-type and ρ0 cells. The results indicate that functional mitochondria are required for the transcriptional response to hypoxia but not for the response to CoCl2, suggesting that cobalt acts via a different mechanism.
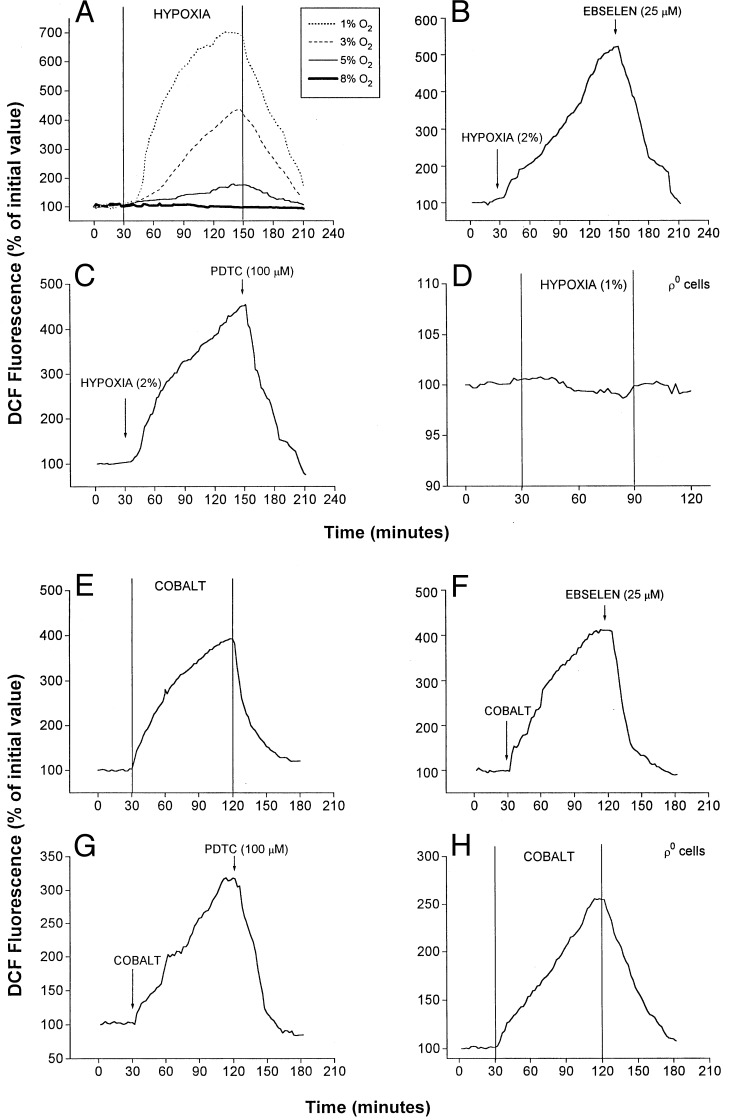
ROS participate in the signaling pathways involved in the activation of multiple transcription factors (21). ROS generation in wild-type and ρ0-Hep3B cells was assessed by using DCFH diacetate (22). This probe is oxidized to DCF by H2O2, permitting its quantification by using fluorescence imaging. Fig. 2A shows DCF fluorescence in response to different O2 levels in the media. At 8% O2, no increase in intracellular fluorescence was detected. However, progressive increases in fluorescence were detected during 5%, 3%, and 1% O2, with the greater increases seen at the lower O2 levels. In cells, ROS initially are generated as superoxide, which subsequently is converted to H2O2 by superoxide dismutase (15). H2O2 then is degraded to H2O by catalase, or by glutathione peroxidase in the reaction: H2O2 + 2GSH → GSSG + 2H2O, where GSH represents reduced glutathione. We used the synthetic glutathione peroxidase mimetic ebselen (25 μM) (23) and the thiol reductive agent pyrrolidine dithiocarbamate (PDTC) (100 μM) (16) to enhance the degradation of H2O2 during hypoxia. Ebselen attenuated the increase in DCF fluorescence caused by hypoxia (Fig. 2B). PDTC also attenuated DCF fluorescence during hypoxia (Fig. 2C). To determine whether mitochondria are required for the generation of ROS during hypoxia, studies with DCFH were carried out in ρ0 cells. During hypoxia (1% O2), no increases in DCF fluorescence were detected over 60 min (Fig. 2D). Thus, graded increases in H2O2 generation occur during hypoxia, which appear to come from functional mitochondria.
Figure 2.
Effect of hypoxia and CoCl2 on ROS generation. Graphs are averages from three experiments. (A) DCF fluorescence in wild-type cells at different levels of O2. Graded hypoxia was produced in a flow-through chamber perfused with solutions equilibrated with different gas mixtures. Duration of hypoxia was 2 hr, beginning 30 min after baseline normoxic (21% O2/5% CO2/74% N2) measurements. Recovery to normoxia was initiated at 150 min. (B) DCF fluorescence in wild-type cells during hypoxia (2% O2/5% CO2/93% N2) and ebselen (25 μM). (C) DCF fluorescence in wild-type cells during hypoxia (2% O2/5% CO2/93% N2) and PDTC (100 μM). (D) DCF fluorescence in ρ0-Hep3B cells during hypoxia (1% O2/5% CO2/94% N2). (E) DCF fluorescence in wild-type cells during normoxic CoCl2 (100 μM). (F) DCF fluorescence in wild-type cells during normoxic CoCl2 (100 μM) and ebselen (25 μM). (G) Effect of PDTC (100 μM) on DCF fluorescence during CoCl2 treatment in wild-type cells. (H) Effect of CoCl2 on DCF fluorescence in ρ0 cells.
To determine the effects of CoCl2 on ROS generation, DCF fluorescence was assessed under normoxia (21% O2) in the presence of CoCl2 (100 μM). Both wild-type and ρ0 cells exhibited increases in DCF fluorescence during CoCl2 (Fig. 2 E and H). These responses were attenuated by ebselen (Fig. 2F) or PDTC (Fig. 2G) in wild-type cells and also in ρ0 cells (data not shown). These results indicate that CoCl2 can increase intracellular ROS generation in the absence of functional mitochondria.
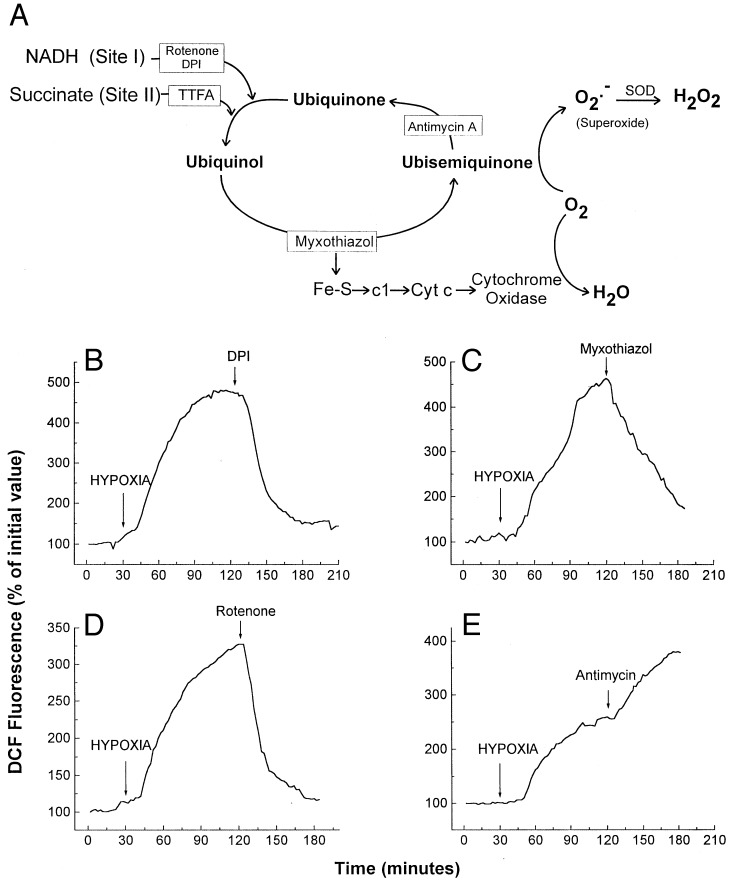
To clarify the site of ROS generation in wild-type cells, mitochondrial inhibitors were administered during hypoxia. Complex III can generate ROS, especially in the presence of compounds that prolong the lifetime of ubisemiquinone (15, 24). Therefore, mitochondrial inhibitors that suppress the formation of ubisemiquinone at complex III should abolish the increase in ROS seen during hypoxia (Fig. 3A). Accordingly, the complex I inhibitors rotenone or diphenylene iodonium (DPI), and the upstream complex III inhibitor myxothiazol, all separately abolished the increase in DCF fluorescence during hypoxia (2% O2) (Fig. 3 B–D). In contrast, antimycin A augmented the increase in DCF fluorescence during hypoxia in wild-type cells (Fig. 3E), as expected. These results suggest that mitochondrial complex III acts as a principal site of ROS generation during hypoxia.
Figure 3.
(A) Mitochondrial electron transport and ROS generation. Antimycin A and myxothiazol alter ROS generation by changing the lifetime of ubisemiquinone. Sites of inhibition are indicated with boxes. (B) DCF fluorescence in wild-type Hep3B cells during hypoxia (2% O2/5% CO2/93% N2) and DPI (3 μM). (C) DCF fluorescence in wild-type cells during hypoxia (2% O2/5% CO2/93% N2) and myxothiazol (100 ng/ml). (D) DCF fluorescence in wild-type cells during hypoxia (2% O2/5% CO2/93% N2) and rotenone (3 μg/ml). (E) DCF fluorescence in wild-type cells during hypoxia (2% O2/5% CO2/93% N2) and antimycin A (3 μg/ml). Graphs are representative examples.
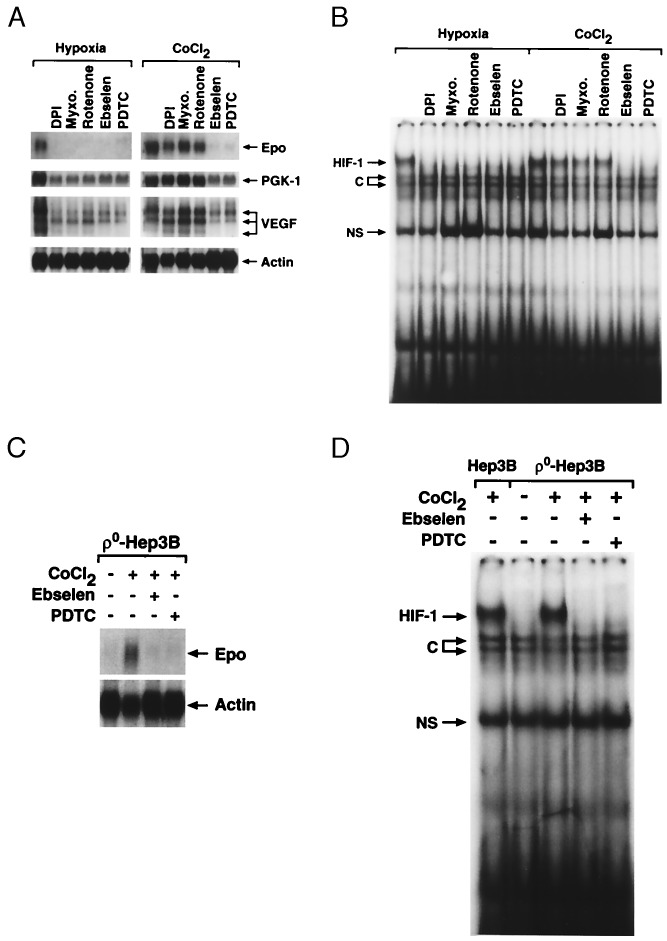
We next examined the role of ROS generation in the induction of mRNA expression, and in EPO secretion into the culture medium, during hypoxia or during CoCl2 incubation. Incubation for 16 hr under hypoxia (1% O2) or CoCl2 (100 μM) induced 340 ± 15 and 200 ± 4 milliunits/ml of EPO secretion, respectively. Ebselen and PDTC both abolished mRNA expression of EPO, VEGF, and glycolytic enzymes during hypoxia and during normoxic CoCl2 exposure (Fig. 4A). Ebselen and PDTC also abolished EPO secretion (data not shown). These results indicate that ROS, most likely H2O2, are required for the induction of gene expression by hypoxia or by CoCl2.
Figure 4.
(A) Northern blot analysis of RNA isolated from wild-type Hep3B cells during hypoxia (1.5% O2/5% CO2/93.5% N2) or normoxic CoCl2 in the presence of DPI (3 μM), myxothiazol (100 ng/ml), rotenone (3 μg/ml), ebselen (25 μM), or PDTC (100 μM) for 16 hr. (B) HIF-1 DNA binding in nuclear extracts from wild-type cells during hypoxia (1.5% O2/5% CO2/93.5% N2) or normoxic CoCl2 in the presence of DPI (3 μM), myxothiazol (100 ng/ml), rotenone (3 μg/ml), ebselen (25 μM), or PDTC (100 μM) for 4 hr. (C) Northern analysis of RNA from ρ0-Hep3B cells during CoCl2 (100 μM) in the presence of ebselen (25 μM) or PDTC (100 μM) for 16 hr. (D) HIF-1 DNA binding in nuclear extracts from wild-type or ρ0 cells during CoCl2 in the presence of ebselen (25 μM) or PDTC (100 μM) for 4 hr. C, constitutive; NS, nonspecific.
To determine whether mitochondrial ROS are required for the hypoxic response but not for CoCl2, mRNA expression and EPO secretion were assessed in the presence of rotenone, DPI (25), and myxothiazol. Each abolished EPO secretion both during hypoxia and during CoCl2 exposure (data not shown). Interestingly, the mitochondrial inhibitors blocked mRNA expression during hypoxia but did not abolish the transcriptional response to CoCl2. This finding is consistent with data from Gleadle et al. (26), who found that DPI abolished the response to hypoxia but not to CoCl2. The discrepancy between EPO secretion and mRNA expression during CoCl2 may reflect a requirement for mitochondrial ATP production for the EPO secretion response. This finding fits with our earlier observation that ρ0 cells demonstrated mRNA expression but failed to secrete EPO during CoCl2 exposure. To determine whether ROS generated by CoCl2 are required for EPO mRNA expression in ρ0 cells, studies with ebselen and PDTC were carried out. Both compounds abolished the CoCl2-induced mRNA expression of EPO in ρ0 cells (Fig. 4C). These results demonstrate that mitochondrial ROS are required for the induction of gene expression during hypoxia, and that cobalt bypasses the need for functioning mitochondria by mediating ROS production via an independent mechanism.
The induction of EPO is mediated by HIF-1 via inhibition of HIF-1α degradation, allowing its accumulation and formation of the heterodimer complex (27). Caro and Salceda (28) found that HIF-1 also can be stabilized under normoxia by using a proteasome inhibitor, lactacystin. However, lactacystin failed to activate EPO mRNA expression, indicating that other conditions are necessary. Wang et al. (29) showed that EPO responses and HIF-1 DNA binding are abolished by the tyrosine kinase inhibitor genistein, and Salceda et al. (30) found that other kinase inhibitors such as PD 098059 can attenuate the hypoxic response of a reporter gene without abolishing HIF-1-DNA binding. These observations indicate that both kinase activation and HIF-1 stabilization are required for mRNA expression during hypoxia. To determine whether antioxidants abolish mRNA expression without abolishing HIF-1 DNA binding, gel shift assays were used to test whether ROS generation is required for HIF-1 DNA binding during hypoxia or CoCl2 treatment. Both ebselen and PDTC abolished HIF-1-DNA binding during hypoxia and CoCl2 treatment (Fig. 4B). The mitochondrial inhibitors DPI, rotenone, and myxothiazol abolished HIF-1 DNA binding during hypoxia but not during CoCl2 exposure. In ρ0 cells, both ebselen and PDTC abolished the CoCl2-induced HIF-1 DNA binding (Fig. 4D). These results indicate that ROS generation is required for HIF-1 DNA binding. Interestingly, our ROS signal displayed a graded inverse response to the O2 level during hypoxia (Fig. 2A), and hypoxic stabilization of the HIF-1 complex is related to the O2 concentration (31). Our results show that ROS generation at complex III is required for the induction of HIF-1 DNA binding activity during hypoxia, whereas nonmitochondrial ROS generation is involved during CoCl2 treatment.
Our model proposes only that ROS are required for the hypoxic activation of HIF-1, but it is not yet clear whether ROS are sufficient for HIF-1 activation. ROS generators, including antimycin and menadione, failed to elicit the stabilization of HIF-1 during normoxia (data not shown). Further studies will be required to adequately test whether ROS are sufficient for HIF-1 activation.
Previous studies have suggested that ROS participate in the activation of gene expression by HIF-1 (32, 33), but our data contradict previous work by revealing that increases, rather than decreases in ROS, occur during hypoxia. Earlier studies measured ROS during CoCl2 by using dihydrorhodamine 123 (DHR-123), a dye whose behavior is difficult to interpret. Both DCFH and DHR-123 become fluorescent upon oxidation by ROS. However, rhodamine 123 is taken up into mitochondria after being oxidized, and some of its fluorescence is quenched there. Another difference between the studies is that they measured fluorescence at 18–36 hr after cobalt (32), whereas our measurements were made acutely. In an attempt to reconcile these differences, we assessed responses to hypoxia and CoCl2 by using DHR-123. In limited studies, 1% O2 failed to increase DHR-123 fluorescence (data not shown). Interestingly, CoCl2 (100 μM) caused a small increase in DHR-123 fluorescence (suggestive of increased ROS generation), which was reversible after washout. These findings are consistent with our DCFH results, but suggest that DHR-123 is less sensitive to ROS than is DCFH.
Do decreases in ROS generation during hypoxia explain HIF-1 activation? Exogenous H2O2 inhibited EPO induction and HIF-1 activation during hypoxia (27, 34). Moreover, exogenous catalase enhanced activation of a HIF-1 reporter gene (28) and antagonized the inhibitory effect of exogenous H2O2 administration on EPO secretion (35). Finally, thioredoxin enhanced HIF-1-DNA binding of hypoxic cell extracts and overexpression of thioredoxin or Ref-1 potentiated hypoxia-induced induction of a HIF-1-dependent reporter construct (36). One might conclude from these studies that increases in ROS generation during normoxia suppress HIF-1 activation, but two conceptual problems arise. First, antioxidants have not been shown unequivocally to activate HIF-1 during normoxia. Salceda and Caro (28) used a thiol reducing agent as an antioxidant, and found that N-(2-mercaptopropionyl)-glycine (N-MPG, at 5 mM) activated HIF-1. Yet we have found N-MPG to be effective at concentrations of 200 μM. To test the possibility that N-MPG at 5 mM could be scavenging O2 (thus creating hypoxia), a polarographic respirometer was filled with medium equilibrated to PO2 = 148 torr at 37°C (no cells). The PO2 was recorded to detect entry or consumption of O2. Addition of N-MPG (5 mM) caused the media PO2 to decrease progressively, indicating that N-MPG at 5 mM may directly reduce O2 (data not shown). We suggest that high concentrations of N-MPG may scavenge O2, generating hypoxia and causing activation of HIF-1.
It has been shown previously that exogenous H2O2 blunts the EPO response to hypoxia. However, nutritive media with serum contains catalase, which can rapidly degrade a bolus of H2O2. Our results reveal increases in H2O2 formation during hypoxia, and it is possible that exogenous H2O2 could cause cellular damage by overwhelming antioxidant defenses. However, this theory cannot explain why exogenous catalase stimulated HIF-1-dependent reporter gene expression (28). The signaling involved in the regulation of EPO expression may involve location-specific redox reactions, which may require a reducing environment in the nucleus and an oxidizing environment in the cytosol. Such a system could prevent inadvertent activation of transcription in response to nonspecific exogenous oxidants. Additional work is required to fully clarify these issues.
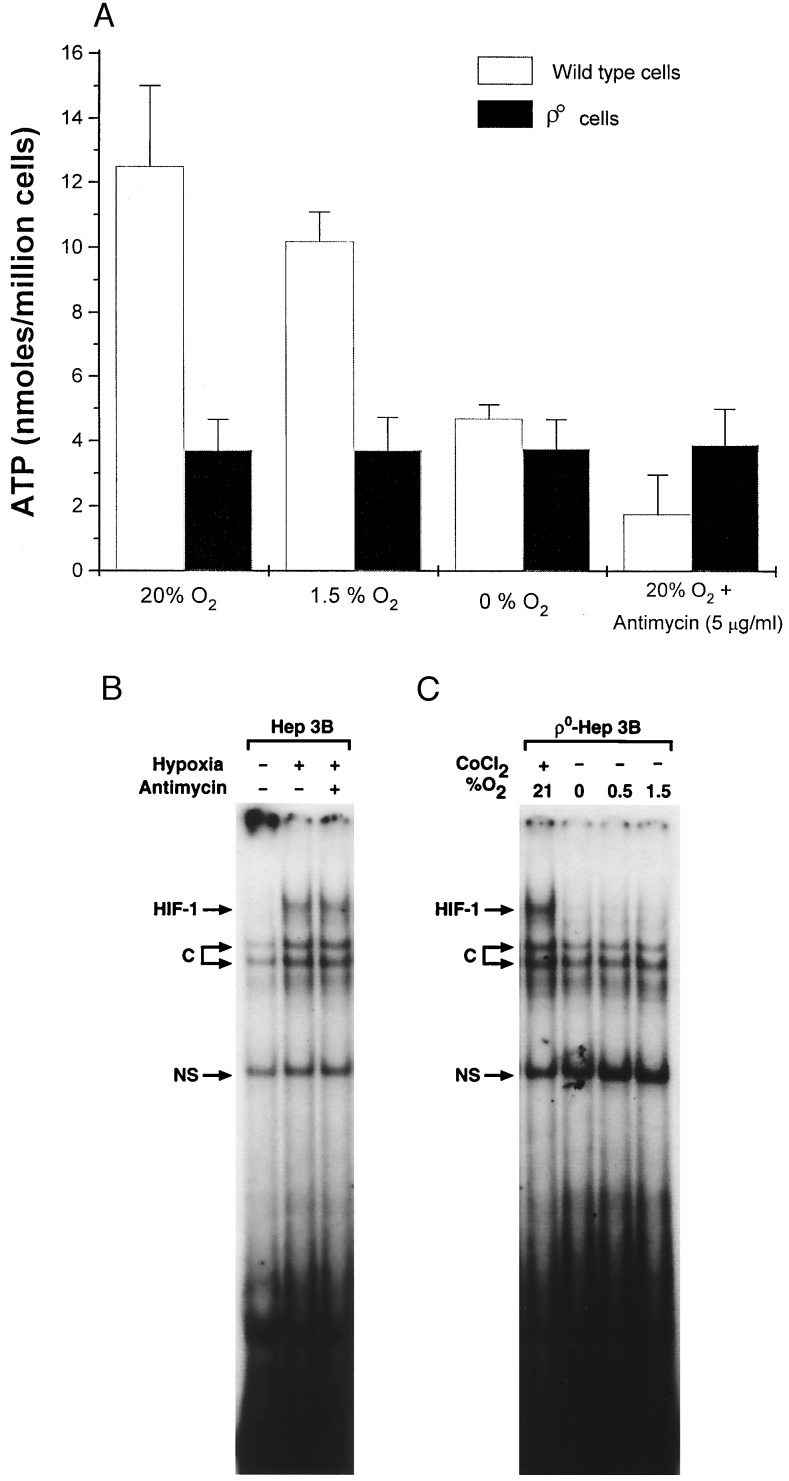
The strongest evidence that mitochondria are important in the hypoxic response is the finding that ρ° cells failed to activate the HIF-1 during hypoxia. We suggest that the failure of ρ° cells to activate HIF-1 during hypoxia relates to their failure to generate mitochondrial ROS. However, mitochondria also generate ATP, and hypoxic activation of HIF-1 may require an ATP-dependent kinase. A depletion of ATP in ρ° cells could conceivably limit such a kinase. To test this, we measured [ATP] in wild-type and ρ° cells at different O2 levels. Compared with wild-type cells, the ATP levels in ρ° cells were low, but they were independent of the O2 tension and were unaffected by antimycin A (Fig. 5A). These data are not surprising, as ATP production in ρ° cells does not involve mitochondria and should not be affected by PO2. In contrast, in wild-type cells ATP decreased after antimycin A and also during anoxia (Fig. 5A). To test whether low ATP can prevent HIF-1 DNA binding, gel shift assays were carried out in wild-type cells under 1.5% O2 ± antimycin A. Because HIF-1 was still able to bind DNA in the presence of antimycin A under hypoxia, when the ATP was lower than ever encountered in ρ° cells (Fig. 5B), we conclude that low ATP levels in ρ° cells cannot explain their failure to respond to hypoxia. We note that Jiang et al. (31) also found that HIF-1 DNA binding can occur at PO2 = 0 torr, when ATP levels presumably would be low. These data show that low ATP levels do not limit HIF-1 DNA binding and suggest that low ATP in ρ° cells cannot explain their failure to activate HIF-1 under hypoxia.
Figure 5.
(A) ATP levels (Boehringer Mannheim Bioluminescence Kit) in wild-type and ρ0-Hep3B cells during 21% O2, 1.5% O2, 0% O2, and antimycin (5 μg/ml) at 21% O2 for 1 hr. (B) HIF-1 DNA-binding activity in nuclear extracts from wild-type cells during hypoxia (1.5% O2/5% CO2/93.5% N2) in the presence of antimycin (5 μg/ml). (C) HIF-1 DNA binding in nuclear extracts from ρ0 cells during CoCl2 (100 μM), 1.5% O2, 0.5% O2, and 0% O2. C, constitutive; NS, nonspecific.
Because the rate of O2 uptake by wild-type cells was 10-fold greater than in ρ° cells, a lower intracellular PO2 should exist in the wild-type cells for the same extracellular PO2, assuming that intracellular O2 transport resistances are similar in the two cell types. A higher intracellular PO2 could conceivably permit ρ° cells to respond to CoCl2 while confounding their response to hypoxia. If true, then ρ° cells should respond to a more severe hypoxia. To test this possibility, HIF-1 DNA binding was assessed in ρ° cells under 1.5%, 0.5%, and 0.0% O2 (Fig. 5C). Even at these lower O2 levels there was no activation of HIF-1. To confirm that the cells were truly hypoxic, a T flask was fitted with a polarographic O2 electrode, and the media PO2 were recorded after the head space gas [O2] was reduced to zero. The O2 level in the liquid fell to within 0.4 torr of the O2 tension in the gas, confirming the ability of the system to render cells hypoxic (data not shown).
What factors trigger the increase in ROS during hypoxia? Interventions that increase mitochondrial reduction such as antimycin A tend to increase the generation of superoxide. The increases in ROS seen during hypoxia suggest that mitochondrial reduction may have increased as PO2 was lowered. We previously found that the Vmax of cytochrome oxidase decreases by ≈50% during hypoxia in hepatocytes (37), liver mitochondria (38), submitochondrial particles (37), and isolated cytochrome oxidase (13). We suggest that the increase in ROS generation may be the result of changes in redox caused by the effect of hypoxia on cytochrome oxidase.
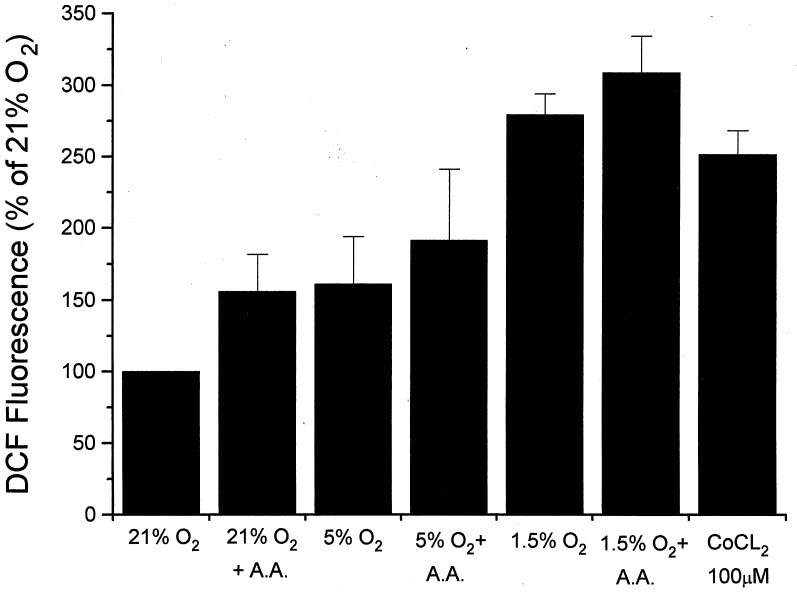
Previous studies have found that cyanide neither activates EPO secretion nor inhibits the response to hypoxia (39–41). How could mitochondria function as O2 sensors if cyanide fails to elicit or inhibit transcriptional activation? In a previous study we compared ROS generation during hypoxia and graded increases in azide (42). At similar levels of mitochondrial redox, more ROS generation was seen with hypoxia than with azide. Thus, low [O2] may amplify the release of ROS from mitochondria for a given redox state. To test this possibility, Hep3B cells were incubated with DCFH diacetate for 5 hr at different O2 levels, and antimycin A was added to inhibit electron transport at complex III. Both antimycin A and hypoxia increased the ROS signal, but the response to hypoxia was greater than that during antimycin A (Fig. 6). Thus, low [O2] may amplify the ROS response to a given change in redox, suggesting that the failure of cyanide to activate the hypoxic response may be caused by the smaller ROS signal generated with those compounds during normoxia. In contrast, the complex I inhibitor rotenone blocked the hypoxic response by inhibiting electron flux into complex III where ROS are generated.
Figure 6.
Intracellular DCF fluorescence in Hep3B cells after incubation at 21%, 5%, or 1.5% O2 for 5 hr. Antimycin A (A.A, 5 μg/ml) was used to inhibit electron transport at site III. Cells treated with CoCl2 were maintained under 21% O2. (n = three experiments per group; means ± 1 SD.)
Could ROS originate at nonmitochondrial sites? ROS also can be generated by membrane NADPH oxidase or cytochrome P450. However, those systems would be expected to decrease ROS generation at low O2 concentrations. Although such oxidase systems do exist in Hep3B cells (43), a clear demonstration of their role in the EPO response has not been reported. DPI has been shown to interfere with the HIF-1-mediated response to hypoxia (44). Because DPI inhibits flavoprotein oxidases, it has been concluded that cytochrome P450 or NADPH oxidase participate in the induction of HIF-1 regulated genes during hypoxia (8). However, DPI also inhibits mitochondria at site I, analogous to the effects of rotenone (25). Moreover, Wenger et al. (45) found that the VEGF and aldolase mRNA responses to hypoxia or CoCl2 were preserved in B cell lines deficient in either p22phox or gp91phox subunits of the NADPH oxidase. We suggest that DPI attenuates HIF-1-regulated gene expression by limiting mitochondrial electron transport at site I, which limits ROS generation at complex III.
In summary, these results shed light on the mechanism of O2 sensing during hypoxia. First, they demonstrate a requirement for respiring mitochondria in the transcriptional response to hypoxia. Second, they demonstrate that mitochondrial ROS are required for both HIF-1-DNA binding activity and mRNA expression of EPO, VEGF, and glycolytic enzymes. Third, they demonstrate that functional mitochondria are not required for the activation of HIF-1-regulated genes by CoCl2, which appears to mimic physiological hypoxia by augmenting the formation of ROS in cells via a nonmitochondrial mechanism. The present study raises the possibility that mitochondria and ROS may play a wider role in the functional responses of eukaryotic cells to changes in O2 concentration.
Acknowledgments
We thank Annette Gardner for her technical assistance and Lisa Gottschalk for preparing the illustrations. M.C.S. is an Investigator of the Howard Hughes Medical Institute. These studies were supported by National Heart, Lung, and Blood Institute Grants HL35440 and HL32646.
ABBREVIATIONS
- EPO
erythropoietin
- VEGF
vascular endothelial growth factor
- ROS
reactive oxygen species
- PDTC
pyrrolidine dithiocarbamate
- HIF-1
hypoxia inducible factor 1
- DCFH
2′,7′-dichlorofluorescin
- DCF
2′,7′-dichlorofluorescein
- DPI
diphenylene iodonium
- DHR-123
dihydrorhodamine 123
- N-MPG
N-(2-mercaptopropionyl)-glycine
Footnotes
This paper was submitted directly (Track II) to the Proceedings Office.
References
- 1. Schuster S J, Badiavas E V, Costa-Giomi P, Weinmann R, Erslev A J, Caro J. Blood. 1989;73:13–16. [PubMed] [Google Scholar]
- 2.Levy A P, Levy N S, Wegner S, Goldberg M A. J Biol Chem. 1995;270:13333–13340. doi: 10.1074/jbc.270.22.13333. [DOI] [PubMed] [Google Scholar]
- 3.Semenza G L, Roth P H, Fang H-M, Wang G L. J Biol Chem. 1994;269:23757–23763. [PubMed] [Google Scholar]
- 4.Semenza G L, Wang G L. Mol Cell Biol. 1992;12:5447–5454. doi: 10.1128/mcb.12.12.5447. [DOI] [PMC free article] [PubMed] [Google Scholar]
- 5.Wang G L, Semenza G L. J Biol Chem. 1993;268:21513–21518. [PubMed] [Google Scholar]
- 6.Wang G L, Jiang B-H, Rue E A, Semenza G L. Proc Natl Acad Sci USA. 1995;92:5510–5514. doi: 10.1073/pnas.92.12.5510. [DOI] [PMC free article] [PubMed] [Google Scholar]
- 7.Wood S M, Gleadle J M, Pugh C W, Hankinson O, Ratcliffe P J. J Biol Chem. 1996;271:15117–15123. doi: 10.1074/jbc.271.25.15117. [DOI] [PubMed] [Google Scholar]
- 8.Bunn H F, Poyton R O. Physiol Rev. 1996;76:839–885. doi: 10.1152/physrev.1996.76.3.839. [DOI] [PubMed] [Google Scholar]
- 9.Acker H. Ann NY Acad Sci. 1994;718:3–10. doi: 10.1111/j.1749-6632.1994.tb55698.x. [DOI] [PubMed] [Google Scholar]
- 10.Fandrey J, Seydel F P, Siegers C-P, Jelkman W. Life Sci. 1990;47:127–134. doi: 10.1016/0024-3205(90)90225-g. [DOI] [PubMed] [Google Scholar]
- 11.Goldberg M A, Dunning S P, Bunn H F. Science (Washington, DC) 1988;242:1412–1415. doi: 10.1126/science.2849206. [DOI] [PubMed] [Google Scholar]
- 12.Tan C C, Ratcliffe P J. Am J Physiol. 1991;261:F982–F987. doi: 10.1152/ajprenal.1991.261.6.F982. [DOI] [PubMed] [Google Scholar]
- 13.Chandel N S, Budinger G R S, Schumacker P T. J Biol Chem. 1996;271:18672–18677. doi: 10.1074/jbc.271.31.18672. [DOI] [PubMed] [Google Scholar]
- 14.Boveris A, Oshino N, Chance B. Biochem J. 1972;128:617–630. doi: 10.1042/bj1280617. [DOI] [PMC free article] [PubMed] [Google Scholar]
- 15.Turrens J F, Alexandre A, Lehninger A L. Arch Biochem Biophys. 1985;237:408–414. doi: 10.1016/0003-9861(85)90293-0. [DOI] [PubMed] [Google Scholar]
- 16.Schreck R, Rieber P, Baeuerle P A. EMBO J. 1991;10:2247–2258. doi: 10.1002/j.1460-2075.1991.tb07761.x. [DOI] [PMC free article] [PubMed] [Google Scholar]
- 17.Goldwasser E, Jacobson L O, Fried W, Plzak L F. Studies Erythropoiesis. 1958;13:55–60. [PubMed] [Google Scholar]
- 18.King M P, Attardi G. Science. 1989;246:500–503. doi: 10.1126/science.2814477. [DOI] [PubMed] [Google Scholar]
- 19.Maltepe E, Schmidt J V, Baunoch D, Bradfield C A, Simon M C. Nature (London) 1997;386:403–407. doi: 10.1038/386403a0. [DOI] [PubMed] [Google Scholar]
- 20.Jelkmann W. Physiol Rev. 1992;72:449–489. doi: 10.1152/physrev.1992.72.2.449. [DOI] [PubMed] [Google Scholar]
- 21.Suzuki Y J, Forman H J, Sevanian A. Free Radical Biol Med. 1997;22:269–285. doi: 10.1016/s0891-5849(96)00275-4. [DOI] [PubMed] [Google Scholar]
- 22.Bass D A, Parce J W, Dechatelet L R, Szejda P, Seeds M C, Thomas M. J Immunol. 1983;130:1910–1917. [PubMed] [Google Scholar]
- 23.Muller A, Cadenas E, Graf P, Sies H. Biochem Pharmacol. 1984;33:3235–3239. doi: 10.1016/0006-2952(84)90083-2. [DOI] [PubMed] [Google Scholar]
- 24.Garcia-Ruiz C, Colell A, Morales A, Kaplowitz N, Fernandez-Checa J C. Mol Pharmacol. 1995;48:825–834. [PubMed] [Google Scholar]
- 25.Holland P C, Clark M G, Bloxham D P, Lardy H A. J Biol Chem. 1973;248:6050–6056. [PubMed] [Google Scholar]
- 26.Gleadle J M, Ebert B L, Ratcliffe P J. Eur J Biochem. 1995;234:92–99. doi: 10.1111/j.1432-1033.1995.092_c.x. [DOI] [PubMed] [Google Scholar]
- 27.Huang L E, Arany Z, Livingston D M, Bunn H F. J Biol Chem. 1996;271:32253–32259. doi: 10.1074/jbc.271.50.32253. [DOI] [PubMed] [Google Scholar]
- 28.Salceda S, Caro J. J Biol Chem. 1997;272:22642–22647. doi: 10.1074/jbc.272.36.22642. [DOI] [PubMed] [Google Scholar]
- 29.Wang G L, Jiang B H, Semenza G L. Biochem Biophys Res Commun. 1995;216:669–675. doi: 10.1006/bbrc.1995.2674. [DOI] [PubMed] [Google Scholar]
- 30.Salceda S, Beck I, Srinivas V, Caro J. Kidney Int. 1997;51:556–559. doi: 10.1038/ki.1997.78. [DOI] [PubMed] [Google Scholar]
- 31.Jiang B H, Semenza G L, Bauer C, Marti H H. Am J Physiol. 1996;271:C1172–C1180. doi: 10.1152/ajpcell.1996.271.4.C1172. [DOI] [PubMed] [Google Scholar]
- 32.Fandrey J, Frede S, Ehleben W, Porwol T, Acker H, Jelkmann W. Kidney Int. 1997;51:492–496. doi: 10.1038/ki.1997.68. [DOI] [PubMed] [Google Scholar]
- 33.Gorlach A, Fandrey J, Holtermann G, Acker H. FEBS Lett. 1994;348:216–218. doi: 10.1016/0014-5793(94)00607-5. [DOI] [PubMed] [Google Scholar]
- 34.Wang G L, Jiang B-H, Semenza G L. Biochem Biophys Res Commun. 1995;212:550–556. doi: 10.1006/bbrc.1995.2005. [DOI] [PubMed] [Google Scholar]
- 35.Fandrey J, Frede S, Jelkman W. Biochem J. 1994;303:507–510. doi: 10.1042/bj3030507. [DOI] [PMC free article] [PubMed] [Google Scholar]
- 36.Huang L E, Arany Z, Livingston D M, Bunn H F. J Biol Chem. 1996;271:32253–32259. doi: 10.1074/jbc.271.50.32253. [DOI] [PubMed] [Google Scholar]
- 37.Chandel N S, Budinger G R S, Choe S H, Schumacker P T. J Biol Chem. 1997;272:18808–18816. doi: 10.1074/jbc.272.30.18808. [DOI] [PubMed] [Google Scholar]
- 38.Chandel N, Budinger G R S, Kemp R A, Schumacker P T. Am J Physiol. 1995;268:L918–L925. doi: 10.1152/ajplung.1995.268.6.L918. [DOI] [PubMed] [Google Scholar]
- 39.Necas E, Neuwirt J. J Lab Clin Med. 1972;79:388–396. [PubMed] [Google Scholar]
- 40.Minchenko A, Bauer T, Salceda S, Caro J. Lab Invest. 1994;71:374–379. [PubMed] [Google Scholar]
- 41.Pugh C W, Tan C C, Jones R W, Ratcliffe P J. Proc Natl Acad Sci USA. 1991;88:10553–10557. doi: 10.1073/pnas.88.23.10553. [DOI] [PMC free article] [PubMed] [Google Scholar]
- 42.Duranteau J, Chandel N S, Kulisz A, Shao Z, Schumacker P T. J Biol Chem. 1998;273:11619–11624. doi: 10.1074/jbc.273.19.11619. [DOI] [PubMed] [Google Scholar]
- 43.Ehleben W, Porwol T, Fandrey J, Kummer W, Acker H. Kidney Int. 1997;51:483–491. doi: 10.1038/ki.1997.67. [DOI] [PubMed] [Google Scholar]
- 44.Gleadle J M, Ebert B L, Ratcliffe P J. Eur J Biochem. 1995;234:92–99. doi: 10.1111/j.1432-1033.1995.092_c.x. [DOI] [PubMed] [Google Scholar]
- 45.Wenger R H, Marti H H, Schuerer-Maly C C, Kvietikova I, Bauer C, Gassmann M, Maly F E. Blood. 1996;87:756–761. [PubMed] [Google Scholar]
- 46.Sherwood J B, Goldwasser E. Blood. 1979;54:885–893. [PubMed] [Google Scholar]


