

Abstract
This study investigated whether there are changes in the excitability of motor axons in peripheral nerves of patients with corticospinal lesions, reflecting plasticity of the motoneuron due to altered descending drives and/or changes in afferent feedback. The excitability of motor and sensory axons in peripheral nerves of the affected limb of 11 patients with unilateral hemiparesis due to stroke was compared with that for the unaffected limbs and with data for 12 age-matched controls. There was significantly less accommodation to hyperpolarizing currents in motor axons on the affected side. There were small differences between the data for the unaffected side and that of the control subjects but these were not statistically significant. Other findings indicate that there was no change in resting membrane potential. There was no comparable alteration in the excitability of sensory axons. The changes in response of motor axons to hyperpolarizing currents could be reproduced in a computer model of the human motor axon by reducing the hyperpolarization-activated conductance, IH, by 30% and the quantitatively small leak conductance by 77%. The data for the uninvolved side matched the data for control subjects best when IH was increased. These findings are consistent with modulation of IH by activity. They demonstrate a change in the biophysical properties of motor axons not directly affected by the pathology and synaptically remote from the lesion, and have implications for ‘trans-synaptic’ changes in central nervous system pathways. In human subjects studies of motor axon properties may allow insight into processes affecting the motoneuron.
Neural circuits can adapt to their input. Terms such as plasticity, potentiation, augmentation and depression are commonly used to describe the adaptive processes through which the transformation of incoming information into a neuronal discharge may be modulated. These changes may be due to plasticity at the synapse (‘synaptic plasticity’), whereby the postsynaptic potential produced by an input is enhanced or depressed, or to changes in pre- or postsynaptic membrane excitability (‘intrinsic plasticity’; see Daoudal & Debanne, 2003; Debanne et al. 2003; Saar & Barkai, 2003).
Much of the information on synaptic mechanisms contributing to neural plasticity has come from studies on slice preparations and cultured neurons. There have been in vivo studies of neural plasticity (Feldman & Brecht, 2005; Cooke & Bliss, 2006) but few of these explore the underlying molecular events. In addition, the effects of lesions that interrupt inputs have been the subject of relatively few studies. Functional imaging (Chollett et al. 1991; Weiller et al. 1992, Weiller 1993; Caramia et al. 1996) and changes in motor cortex maps produced by transcranial magnetic stimulation have been used extensively to document neural plasticity at the cerebral level in patients following stroke and other disease processes, limb amputation or spinal cord injury (Hallett, 2000, 2001; Sanes & Donoghue, 2000; Cooke & Bliss, 2006).
Plasticity also occurs in spinal circuits. For example, synaptic long-term potentiation in spinal circuits is likely to be an important mechanism in the induction of hyperalgesia (Ji et al. 2003). Operant conditioning has long been known to alter short-latency spinal reflexes in animals and humans, and the induced changes may be functionally important: for example, treadmill walking may improve function in rats and human subjects with spinal cord injury (Wolpaw & Tennissen, 2001; Lavrov et al. 2006). The underlying mechanisms may well involve both presynaptic and postsynaptic changes. Recent data provide evidence for plasticity of postactivation depression at the Ia-motoneuron synapse in normal subjects related to skill acquisition (Meunier et al. 2007), while, on the other hand, exercise training changes motoneuron properties, due to alterations in ion conductances, possibly associated with changes in gene expression and the effects of neuromodulators (Gardiner et al. 2006). In spinal injury postsynaptic changes occur at motoneuron level with a greater tendency for persistent inward currents triggering plateau potentials and self-sustained motoneuron discharges (e.g. Gorassini et al. 2004; Nickolls et al. 2004; Hornby et al. 2006). Regardless of the level of the lesion, corticospinal abnormalities are commonly associated with changes in transmission through interneuronal circuits (summarized in Pierrot-Deseilligny & Burke, 2005). Spinal reflex dysfunction occurs in many circuits but, in hemiplegic patients, the changes that correlate best with the emergence of spasticity are less postactivation (homosynaptic) depression at the Ia-motoneuron synapse (Aymard et al. 2000) and facilitated transmission of group II excitation to motoneurons (Marque et al. 2001). Regardless of changes in the intrinsic properties of motoneurons, the disturbed voluntary and reflex inputs to them will alter their excitability, and produce a disordered firing pattern of voluntarily activated motoneurons in the paretic limb (Petajan, 1980; Rosenfalck & Andreassen, 1980; Young & Shahani, 1980).
The excitability of the motor axon is dependent on channels, pumps and exchangers derived from the parent neuron. Given this, the accessibility of motor axons in the peripheral nerve could provide a ‘window’ allowing insights into the events occurring at motoneuron level. The rationale for the present study was that a change in motoneuron properties might reasonably be expected to alter the excitability of the peripheral motor axon, and that these changes might be detectable in human subjects in vivo using the technique of threshold tracking. It was found that accommodation to hyperpolarizing currents, presumably due to the hyperpolarization-activated conductance (IH), is decreased in motor axons on the affected side of stroke patients, but not in motor axons on the unaffected side or in sensory axons. It was possible to reproduce the experimental findings in a computer model of the human myelinated axon (Bostock et al. 1991; Kiernan et al. 2005b; Bostock, 2006; Kanai et al. 2006) by decreasing the expression of IH and the leak conductance.
Methods
Subjects
Twelve patients (age 30–80 years, mean 60 years) who had suffered a single, unilateral corticospinal lesion secondary to ischaemic stroke were studied at least 1 year (12–120 months) after the acute event. There were equal numbers of pontine, subcortical and cortical strokes (× 4 each). All lesions had resulted in predominantly motor symptoms with little or no sensory loss. Relevant clinical features are given in Table 1. The patients had no history or clinical features of any other disease process that could affect peripheral nerve excitability (apart from diabetes mellitus in one patient, excluded when this was identified, see Results). None of the patients were on medication for spasticity or agents that could alter axonal excitability (such as Na+ channel blocking agents or modulators of cAMP). Twelve age-matched controls (30–74 years, mean 57.6 years) were also studied. Informed consent according to the Declaration of Helsinki was obtained from the subjects prior to commencement of the study, which was approved by the Human Research Ethics Committee of the University of Sydney. A detailed neurological assessment was performed by one investigator (S.K.J.) at the time of testing (Table 1). For all experiments, skin temperature was monitored close to the stimulation site and was maintained above 32°C using blankets.
Table 1.
Demographic and clinical data for the patients
| Age/sex | power | Ashworth score | MRS | TEh 90–100 (%) |
|---|---|---|---|---|
| 62 M | 4+ | 2 | 2 | 133 |
| 61 M | 0 | 4 | 4 | 137 |
| 71 F | 4+ | 2 | 2 | 103 |
| 59 M | 4+ | 0 | 1 | 107 |
| 80 F | 3 | 0 | 3 | 150 |
| 43 M | 4+ | 0 | 0 | 109 |
| 57 F | 3 | 2 | 3 | 140 |
| 57 M | 4 | 1 | 1 | 128 |
| 68 F | 4+ | 2 | 2 | 120 |
| 30 F | 5 | 0 | 0 | 118 |
| 71 M | 0 | 3 | 4 | 116 |
Power was assessed using the MRC score (0 = no movement, 5 = normal power) and is reported for finger movements which were the weakest upper limb movements. Tone was assessed using the Ashworth Score (0 = normal tone, 4 = fixed flexion). Overall function was assessed using the Modified Rankin Score (MRS; 0 = asymptomatic, 5 = bedridden). TEh 90–100 = the threshold change on the affected side after 90–100 ms of hyperpolarizing current expressed as a percentage of the threshold change for the unaffected side.
Motor axon studies
For studies of motor axons, compound muscle action potentials (CMAPs) were recorded from thenar muscles using surface electrodes over abductor pollicis brevis (APB) with the active electrode at the motor point and the reference electrode on the proximal phalanx. The electromyographic (EMG) signal was amplified, filtered (3–500 Hz) and digitized by computer (Pentium PC) with an analog-to-digital board (DT2812, Data Translation, Marlboro, MA, USA) and sampled at a rate of 10 kHz. The stimulus current was applied via non-polarizable electrodes (Maersk Medical, Stonehouse, UK) with the cathode over the median nerve at the wrist and the anode 10 cm proximal over muscle. Stimulus waveforms were generated by the computer and converted to current by an isolated linear bipolar constant-current source (maximal output ± 50 mA).
Stimulation and recording were controlled by software (QTRAC version 8.2, © Professor H. Bostock, Institute of Neurology, London). Motor axons were studied using the multiple excitability protocol, TRONDXM4. Test current pulses of 0.2 ms or 1 ms duration were applied regularly at 0.8 s intervals to produce a target potential that was on the fast-rising phase of the stimulus–response curve, ∼40% of the maximal CMAP. These stimuli were combined with suprathreshold conditioning stimuli or subthreshold polarizing currents. The amplitude of the CMAP was measured from baseline to the negative peak. Stimulus–response curves show the growth of the CMAP as stimulus current is increased, and were recorded separately for test stimuli of 0.2 ms and 1 ms duration. These data were used to calculate the strength–duration time constant (τSD) according to Weiss's law, based on the linear relationship between threshold stimulus charge (mA × ms) and its duration (Mogyoros et al. 1996; Kiernan et al. 2000). The τSD is a nodal property and reflects the rate of decrease of threshold current as the duration of the stimulus pulse increases.
Prolonged subthreshold currents were used to alter the potential difference across the internodal axonal membrane. The changes in threshold associated with electrotonic changes in membrane potential are termed ‘threshold electrotonus’ and have a time course similar to the underlying changes in membrane potential (Bostock & Baker, 1988; Bostock et al. 1998). The subthreshold polarizing currents were of 100 ms duration and set to be +40% and +20% (depolarizing) and −40% and −20% (hyperpolarizing) of the control threshold current (i.e. the current required to produce the unconditioned target CMAP, which was ∼40% of maximum). Threshold was tested at different time points during and after the 100 ms polarizing currents. Five stimulus combinations were tested in turn: test stimulus alone to measure the control threshold current, test stimulus plus depolarizing current of +20% or +40%, and test stimulus plus hyperpolarizing current of −20% or −40%.
Threshold was then measured with 1 ms test stimuli 200 ms after the onset of a long-lasting subthreshold polarizing current, the strength of which was altered in 10% steps from +50% (depolarizing) to −100% (hyperpolarizing) of the control threshold. This produced a current–threshold relationship (analogous to the current–voltage relationship) that depends on the rectifying properties of the internodal axolemma (Kiernan et al. 2000). For both threshold electrotonus and the current–threshold relationship, each stimulus combination was repeated until three valid threshold estimates (i.e. responses within 10% of the target response) were obtained.
Six patients were studied using a protocol that examined the current–threshold relationships for polarizing currents of different duration. Much as in the preceding paragraph, threshold was tested at fixed intervals after the onset of polarizing currents of intensity of +50% (depolarizing) and from −10% to −100% (hyperpolarizing) of the control threshold in 10% steps. Threshold was determined 50, 100, 150, 200, 250 and 300 ms after the onset of the polarizing currents at each stimulus intensity.
The final part of the protocol measured the recovery of axonal excitability following a supramaximal conditioning stimulus. Recordings were made at 18 conditioning–test intervals from 2 ms to 200 ms. The stimulus combinations employed were unconditioned test stimulus of 1 ms duration tracking the control threshold, supramaximal 1 ms conditioning stimulus alone, and conditioning plus test stimuli. The response to the conditioning stimulus alone was subtracted from the response to both stimuli so that the conditioning maximal CMAP did not contaminate the measured response when the conditioning–test interval was short. Each stimulus combination was repeated until four valid threshold estimates were obtained. The recovery cycle consists of (i) a period of refractoriness at short conditioning–test intervals with a resultant increase in threshold, (ii) a period of supernormality due to the depolarizing afterpotential (Barrett & Barrett, 1982; Blight, 1985; Bowe et al. 1987) resulting in an increase in axonal excitability and consequently a decrease in the threshold current required to produce the target CMAP, and (iii) the late subnormal period during which axonal excitability is reduced, the long duration of which results from the kinetics of voltage-dependent slow K+ channels activated by the conditioning stimulus (Baker et al. 1987; Stys & Waxman, 1994; Schwarz et al. 2006).
Sensory axon studies
Sensory axon function was assessed bilaterally in six patients. The median nerve was stimulated at the wrist as for motor studies, and the compound sensory action potential (CSAP) was recorded with ring electrodes around the index finger. The CSAP was measured peak to peak. A similar protocol (TRONDXS4) to that used to study motor nerves was employed, except that the test pulses were 0.1 ms and 0.5 ms duration (Kiernan et al. 2001).
Control studies and statistical analysis
As there could be age-related changes in axonal excitability and the underlying voltage-dependent conductances, the primary analyses relied on within-subject comparisons between the affected and unaffected sides. This eliminated age (and sex) factors that could affect a small sample, an important consideration given the wide age range of the stroke subjects. To confirm the findings, and because abnormalities might be bilateral in stroke patients, secondary analyses were undertaken using comparisons between the stroke patients and 12 age-matched control subjects. Controls subjects were all within 1–2 years of age of the stroke subjects, except for the oldest control who was 74, and matched an 80-year-old stroke subject. It should be noted that inward rectification increases with age (Jankelowitz et al. 2005, Jankelowitz, 2007), a change that is the opposite of that required to explain the findings of the present study. In addition, comparisons were also made between the dominant and non-dominant sides in eight of the control subjects to exclude any handedness-related difference in normal subjects. Statistical analysis was performed using the Student's t test for data showing a normal distribution and Wilcoxon's signed rank test for non-parametric data. The significance level was set at P < 0.05. All data are given as means ± s.d.
Computer modelling
An established mathematical model of the human myelinated motor axon (see Appendix; Bostock et al. 1991; Kiernan et al. 2005b; Bostock, 2006; Kanai et al. 2006) was used to determine whether differences in excitability could be attributed to changes in maximal conductances of the various ion species (i.e. expression). Specifically the computer program MEMFIT (© Professor H. Bostock, Institute of Neurology, London; Bostock, 2006) was used to assess objectively the effects of changes in different parameters on the goodness-of-fit of the model to the observed excitability data. The modelling involved iterative changes to different parameters to reduce the total error in the measured excitability indices (strength–duration parameters, threshold electrotonus, current–threshold relationship, recovery cycle).
In this study, changes were identified from within-subject comparisons, of data for the affected and unaffected sides, thus eliminating age and sex as potentially confounding variables. The parameters of the model were first adjusted to mirror the data for the unaffected limbs. The unaffected side was modelled by adjusting the parameters of the standard model, allowing the total Na+ (and the percentages of transient and persistent current; at the node), K+ (slow and fast; at the node and internode), IH and leak conductances (at the node and internode) to vary, along with temperature and membrane potential. The membrane potentials at the node and internode were clamped together by the separate adjustment of the pump currents at the node and internode. The affected side was then modelled by taking the model parameters for the unaffected side and allowing them to vary, without clamping membrane potential. To control for changes on the unaffected side of the patients, secondary comparisons involved data for the involved side of the patients and the data for healthy age-matched control subjects, using the same modelling procedures.
Results
After recruitment and testing, one patient was found to be diabetic and his data were excluded from the analysis because diabetes can affect axonal excitability (e.g. Horn et al. 1996; Quasthoff, 1998; Krishnan & Kiernan, 2005; Misawa et al. 2005). None of the other patients (n = 11) had comorbid diseases known to affect peripheral nerve function. Nor had they been exposed to neurotoxic drugs. No subjects reported symptoms of carpal tunnel syndrome. The mean onset latency for the CMAP in abductor pollicis brevis after stimulation of the median nerve at the wrist was 4.1 ± 0.7 ms on the unaffected side and 4.0 ± 0.7 ms on the affected side (P = 0.38). The mean maximal CMAP amplitudes were 7.0 ± 1.4 mV and 6.6 ± 1.7 mV, respectively (P = 0.67).
Resting membrane potential
The stimulus–response curves, strength–duration time constants and recovery cycles for motor axons on the affected side did not differ from those for the unaffected side (Fig. 1). Nor was there a significant difference from the data for control subjects. The stimulus–response curves were normalized so that a current of 100% produced a CMAP ∼50% of maximum. The strength–duration time constant is illustrated for CMAPs of different size, from 10% to 90% of maximum. The recovery cycle illustrates the time course of the recovery of axonal excitability following a single supramaximal conditioning stimulus – initially refractoriness (maximal at the shortest interval tested, 2 ms), then supernormality (maximal at 5–7 ms), then late subnormality (maximal at 30–50 ms). These measures are sensitive to changes in membrane potential (Bostock et al. 1998), and the absence of significant differences in them suggests that there was no significant difference in resting membrane potential between the two sides in the patients (Fig. 1) or between the patients and healthy controls. Maximal supernormality was −18.4 ± 6.3% on the unaffected side and −16.6 ± 7.0% on the affected side (P = 0.527). The values for late subnormality were 17.6 ± 5.6% and 13.7 ± 6.3%, respectively (P = 0.136). For the control subjects, peak supernormality was −21.9 ± 5.5% and late subnormality was 15.6 ± 3.8%.
Figure 1.

Resting membrane potential is not altered on the affected side Normalized stimulus–response curves (A), strength–duration time constants for CMAPs of 10–90% of maximum (B) and the recovery cycle (C). A, mean stimulus–response data for the affected (•) and unaffected (○) sides of the patients (n = 11). B, comparison of the strength–duration time constants for CMAPs of different size for the patients (affected side, •; unaffected side, ○; mean ± s.e.m.). C, recovery cycles for the affected (•) and unaffected (○) sides of the patients (mean ± s.e.m.). There is little or no difference in these three properties for the two sides of the patients. These properties are voltage dependent, and this suggests that there is no difference in resting membrane potential.
Accommodation to hyperpolarization
In all patients, the 100 ms hyperpolarizing currents (both −20% and −40%) used for threshold electrotonus produced a greater decrease in excitability for motor axons on the affected side (Table 1; Fig. 2A, left panel). However the changes with depolarizing currents were identical for the two sides. In Fig. 2, the change in current required to produce the test potential (i.e. the ‘threshold current’) with subthreshold depolarizing currents lasting 100 ms produced an increase in excitability that is plotted upwards, and those with subthreshold hyperpolarizing currents lasting 100 ms produced a decrease in excitability that is plotted downwards. On termination of the subthreshold depolarizing and hyperpolarizing current pulses there are changes in excitability in the opposite direction. The mean maximal threshold change (TEh 90–100) produced by the −40% hyperpolarizing current was −112 ± 18.7% for the unaffected side, −133 ± 29.1% for the affected side (P = 0.021) and −114 ± 19.7% for the control subjects (n = 12; Fig. 3A). In the eight control subjects in whom both the dominant and non-dominant sides were assessed there was no such asymmetry: the mean maximal threshold change was −114 ± 25.4% for the dominant side and −115 ± 24.1% for the non-dominant side (Fig. 2B, left panel). The small difference (2%) in the findings for the uninvolved side and the control subjects was not statistically significant, but may be relevant given the computer modelling (see below).
Figure 2.

There is reduced accommodation of motor axons to hyperpolarizing currents on the affected side Threshold electrotonus and current–threshold plots (mean ± s.e.m.) for the motor axons of the affected and unaffected sides of the patients (A, n = 11) and for motor axons of the 8 age-matched control subjects in whom bilateral recordings were made (B). In the left panel of A, hyperpolarizing currents produced a significantly greater decrease in excitability (measured as a greater increase in threshold and plotted downwards) for motor axons on the affected side (•; P = 0.021). In the right panel of A, the current–threshold relationship was significantly less steep on the affected side (•). In the depolarizing direction (plotted upwards) there is no difference in the data for the affected and unaffected sides. In the left panel of B, the extent of the threshold change produced by hyperpolarizing currents in motor axons was the same for the dominant and non-dominant sides of the control subjects (−115% and −114%, respectively), similar to that on the unaffected side of the patients (−112%). In the right panel of B, the slopes of the current–threshold relationships to hyperpolarizing currents are the same for the dominant and non-dominant limbs, and equal to that for the unaffected limbs of the patients. In both panels, the threshold changes produced by depolarizing currents are similar.
Figure 3.

There is a significant decrease in the accommodation to hyperpolarizing currents on the affected side of patients In A there was a significantly greater change in threshold in response to hyperpolarizing currents for the affected side of patients (P = 0.021, mean ± s.e.m.). B, the mean (± s.e.m.) of the slope of the current–threshold relationship for the first 6 points (−10 to −60%) in the hyperpolarizing direction. The difference in values for the two sides of the patients was significant but the values for the unaffected side (n = 11) were similar to the control values (n = 12).
The current–threshold relationship measured 200 ms after the onset of injection of a steady polarizing current is plotted in the right panels of Fig. 2. The strength of the injected current pulse was changed from +50% (depolarizing, top right in the right-hand panels of Fig. 2) to −100% (hyperpolarizing, bottom left in the right-hand panels of Fig. 2) in steps of 10%. In the patients, the slope of the hyperpolarizing phase of the current–threshold (I–V) relationship measured over the first six data points was less steep for the affected side (0.28 ± 0.06) than the unaffected side (0.36 ± 0.06, P = 0.002, Fig. 2A, right panel; Fig. 3B). The slope of the curve was 0.34 ± 0.05 for the healthy controls (n = 12; Fig. 3B). Again the slightly greater slope for the uninvolved side was not significant, but may still be relevant (see Computer modelling).
Polarizing currents of different duration
In six patients, current–threshold relationships were measured 50 ms to 300 ms after the onset of long-lasting polarizing currents. The longer the hyperpolarizing current the greater was the increase in threshold (and the greater the accommodation to hyperpolarization). However the relationships were less steep in the hyperpolarizing direction for all polarizing current durations on the affected side (Fig. 4), and the maximal threshold change was consequently greater on this side. With the strongest hyperpolarizing current (−100%) the difference in the threshold changes for the affected and unaffected sides was greater the longer the duration of the hyperpolarizing current, from 20% with currents lasting 50 ms to 94% with currents lasting 300 ms. These findings confirm the data in Fig. 2A (right panel) and imply that the conductance responsible for the inwardly rectifying accommodation to hyperpolarizing currents is voltage dependent and has slow kinetics, activated within 50 ms but not maximally so for a few hundreds of milliseconds. This behaviour is typical of IH (Pape, 1996).
Figure 4.

There is reduced accommodation of motor axons to hyperpolarizing currents of 50–300 ms duration on the affected side of patients Accommodation to hyperpolarization was assessed in six patients measuring the threshold changes 50, 100, 150, 200, 250 and 300 ms after the onset of the polarizing current. Accommodation to depolarizing currents was complete within 50 ms (see Fig. 2) and, accordingly, the data points for the different current durations superimpose (top right panel). In the hyperpolarizing direction, the greater the current duration the greater were the threshold changes due to slow electrotonus and the slowly activated inwardly rectifying accommodation to the hyperpolarization. There was significantly reduced inward rectification for the affected side (•) compared to the unaffected side (▵) regardless of the duration of the polarizing stimulus.
Sensory axons
There was no difference in any of the biophysical parameters for sensory axons on the affected and unaffected sides of the patients (Fig. 5, n = 6). Specifically, the stimulus–response curves, strength–duration time constants and recovery cycle did not differ between the two sides of the patients. Similarly, there was no asymmetry in threshold electrotonus and the current–threshold relationship for sensory axons between the affected and unaffected sides (e.g. P = 0.874 for the current–threshold relationship). There was a significant difference in the side-to-side ratios for threshold changes to the 100 ms hyperpolarizing current at 90–100 ms (TEh 90–100) for sensory and motor axons in the six patients: symmetrical for sensory axons at 99.9 ± 20.0%; asymmetrical for motor axons at 125.6 ± 12.3; P = 0.040; Student's t test).
Figure 5.

There is no difference in excitability measures for sensory axons The differences in threshold electrotonus and the current–threshold relationship observed for motor axons were not present in the data for sensory axons (n = 6; mean ± s.e.m.). The notch in the threshold electrotonus plot in the depolarizing direction (upwards) at the peak of the increase in excitability, is due to activation of low-threshold axons by the +40% depolarizing current. Accordingly the notch was not present in response to the +20% depolarizing current.
In Fig. 5 there is a ‘notch’ in the threshold electrotonus plot in the depolarizing direction (upwards) for the +40% depolarizing current 10–20 ms after its onset. Because of the less steep slope of the stimulus–response curve for sensory axons, the 40% conditioning stimulus did not remain subthreshold and was able to activate some low-threshold axons. This notch was not present with the +20% depolarizing current which was insufficient to activate low-threshold axons (Fig. 5). Sensory axons accommodate more to hyperpolarizing currents than motor axons (Bostock et al. 1994; Lin et al. 2002), but the expected difference in accommodation is not seen when Figs 2 and 5 are compared because the durations of the test stimuli were 1.0 ms for motor axons and 0.5 ms for sensory axons.
Computer modelling
The changes in threshold electrotonus, the current–threshold relationship, the recovery cycle and strength–duration properties were modelled using a computer program, MEMFIT (Bostock, 2006), which implements a mathematical model of the human motor axon (see Appendix), used in previous studies (e.g. Bostock et al. 1991; Kiernan et al. 2005b; Kanai et al. 2006). The parameters listed in column 4 of Table 2 represent the best fit to the uninvolved limb data, and these changes resulted in a 76.7% reduction in discrepancy between model and the data recorded for the uninvolved limb of the patients. The significant differences are highlighted in bold. The differences from the model parameters are likely to be due, at least in part, to age: the normal model is based on 29 healthy subjects with a mean age of 45 years, while the mean age of the patients in the present study was 60 years. It is relevant that detailed studies of age-related changes in excitability indices of motor axons of healthy subjects have produced evidence for a significant increase in inward rectification and a decrease in supernormality with age (Jankelowitz et al. 2005, Jankelowitz, 2007), findings consistent with the increase in IH and the increase in fast K+ conductances, respectively, in the present modelling.
Table 2.
Modelled parameters and the changes producing greatest error reduction
| Parameter | Description | Standard model | Data for uninvolved limb | Data for involved limb | Data for age-matched controls |
|---|---|---|---|---|---|
| ENR | Resting membrane potential | −82.9 | −82.9 | NC | −82.9 |
| PNaN | Permeability of Na+ channels at the node | 4.1 | 4.1 | 4 | 4.4 |
| PNaP% | % of Na+ channels that are persistent | 0.895 | 1.12 | 1.16 | 1.12 |
| GKsN | Max. conductance of slow K+ channels at the node | 41 | 49 | 51 | 45.5 |
| GKsI | Max. conductance of slow K+ channels at the internode | 0.365 | 0.145 | 0.145 | 0.145 |
| GKfN | Max. conductance of fast K+ channels at the node | 20 | 20 | 22.5 | 24 |
| GKfI | Max. conductance of fast K+ channels at the internode | 100 | 106 | 106 | 106 |
| GH | Max. conductance of IH | 6.3 | 7.6 | 5.3 | 6.55 |
| GLkN | Leak conductance at the node | 1.38 | 0.865 | 0.9 | 0.865 |
| GLkI | Leak conductance at the internode | 1.6 | 1.28 | 0.29 | 1.25 |
| Tabs | Temperature (K) | 301.8 | 303.7 | 303.8 | 304 |
NC, not clamped. The standard model was first adjusted to produce an optimal fit for the data for the uninvolved limb, and then the further changes necessary to produce an optimal fit for the data for the involved limb were made. Relevant key changes are in bold and italics.
Having adjusted the model to the data for the uninvolved side, further adjustments to the parameters in column 5 of Table 2 reduced the discrepancy between the data for the model and involved limbs by 77% (Fig. 6). Specifically the following reductions in discrepancy were achieved: strength–duration relationship, unchanged; threshold electrotonus, 45%; recovery cycle, 58%, current–threshold relationship, 92% (Fig. 6). The major differences between the involved limb and uninvolved limb were reductions in IH (30%) and in the leak conductance at the internode (77%). It is relevant that IH was modelled as a single channel, while it is known that there are four HCN (hyperpolarization-activated cyclic nucleotide gated) channels. The leak conductance may contain an unmodelled component of tonically active IH (Robinson & Siegelbaum, 2003).
Figure 6.

Results of mathematical model fitting to observed data The data points represent the mean data for threshold electrotonus (A), the current–threshold relationship (B), and the recovery cycle (C) (○, uninvolved; •, involved side; error bars omitted, see Figs 1 and 2). The lines represent the best fits to the data using the mathematical model of a human axon (dashed line, uninvolved side; continuous line, involved side).
Figure 7.

Mathematical model of the human myelinated axon Modified from Fig. 2 of Bostock et al. (1991).
The data for the control subjects and for the uninvolved limb of the patients differed in a number of aspects, but the key findings were that the leak conductance was similar (indicating that the decrease on the involved side was probably an important change) and that there was greater IH on the uninvolved side than in the control data, consistent with the small differences in threshold electrotonus and the slope of the current–threshold relationship. These findings are addressed further in the Discussion.
Clinical correlations
In this sample of patients with chronic stroke, there was no correlation between the degree of weakness, Ashworth score or level of function (Modified Rankin Score) at the time of testing and the extent of change in the biophysical parameters of motor nerves (Table 1), and there was no trend for a correlation. Follow-up studies have been performed on 2 of the 11 patients, 10 months and 11 months after the initial study, with near-identical findings. This indicates only that changes plateau in the chronic state. Longitudinal studies beginning soon after the ictus are required to assess fully whether there is a correlation with disability within individual subjects.
Discussion
Chronic lesions of the corticospinal tract are associated with a change in the biophysical properties of motor axons, but not sensory axons, in peripheral nerves of the paretic limb. In the threshold electrotonus studies, the greater hyperpolarization on the affected side indicates less accommodation to hyperpolarizing currents and this suggests that there is less inward rectification (Bostock et al. 1994, Bostock, 1998), as if there had been down-regulation of the hyperpolarization-activated conductance, IH (Baker et al. 1987; Bostock et al. 1994; Pape, 1996; Robinson & Siegelbaum, 2003), on the affected side of the patients. IH is a depolarizing conductance, activated by hyperpolarization, permeable to both Na+ and K+ ions, and sensitive to intracellular cAMP levels (Pape, 1996; Robinson & Siegelbaum, 2003). In axons, the functional role for inward rectification is probably limitation of activity-induced hyperpolarization (Pape, 1996; Kiernan et al. 2004), but in neurons (and cardiac tissue) the current acts as a pacemaker (Kaupp & Seifert, 2001). The threshold electrotonus findings are supported by significant differences in the current–threshold relationship. This relationship is analogous to a conventional current–voltage relationship and reflects the rectifying properties of the axon (Kiernan et al. 2000). The steepening of the curve in the hyperpolarizing direction represents accommodation to hyperpolarization, presumably due to IH.
That the changes documented in the present study represent a difference in IH is supported by modelling studies. The observed differences could not be reproduced without changing IH, but the data were reproduced better by the model when the leak conductance was also decreased. The absence of any difference in the stimulus–response curves, strength–duration time constants and recovery cycles (Fig. 1) is evidence that resting membrane potential was not different for the affected and unaffected sides of the patients (Bostock et al. 1998). This view is also supported by the similarity of the threshold electrotonus and current–threshold relationships in the depolarizing direction for motor axons (Figs 2 and 4).
An intriguing finding was that the model suggested greater IH on the unaffected side of the patients than normal controls, a finding supported by small (though non-significant) changes in threshold electrotonus and the current–threshold relationship. It is conceded that a reservation must be retained when the outcome of modelling a number of conductances is not accompanied by significant differences in the original data. However, if the expression of IH is less on the involved side and greater on the uninvolved side, activity becomes a plausible mechanism for driving these changes (see below).
IH and HCN isoforms
In myelinated axons, IH is located primarily in the internode and, in human peripheral nerve, it is expressed to a greater extent on sensory than motor axons (Bostock et al. 1994; Lin et al. 2002). There are four isoforms of the hyperpolarization-activated cyclic nucleotide-gated (HCN) channels responsible for IH (Kaupp & Seifert, 2001), but there are limited data on the expression of these isoforms on motoneurons or their axons. HCN1 and 2 are expressed in mouse DRG neurons (Moosmang et al. 2001) and rat motoneurons (Chen et al. 2005). HCN1 has the fastest activation kinetics, followed by HCN2, 3 and 4 (Stieber et al. 2005). HCN3 is the only channel not activated by cAMP, and HCN2 and HCN4 show the greatest activation by cAMP (Stieber et al. 2005). The changes observed in threshold electrotonus and the current–threshold relationship could be reproduced by changing both IH and the leak conductance. IH is modelled as a single channel, and the leak conductance may contain unmodelled components of different IH isoforms (Robinson & Siegelbaum, 2003). It is possible that, on the involved side, more than one isoform of the IH channel is expressed, and that the dominant isoforms are activated at more hyperpolarized membrane potentials.
Mechanisms for the changes in IH
There are many reasons why there might be changes in motoneuron properties in stroke patients. The corticospinal lesion disturbs the input to affected spinal motoneurons. The voluntary control of motoneuron discharge is impaired, and there is disturbed supraspinal control of many circuits that ultimately impinge on the motoneuron (Pierrot-Deseilligny & Burke, 2005). As a result there is a disturbance of both the input to and output of affected motoneurons. The ion channels and pumps that determine axonal excitability are derived from the neuron, and it would be reasonable to expect changes in axonal excitability when motoneuron properties change. Indeed, changes in the biophysical properties of motor axons have been demonstrated in patients with amyotrophic lateral sclerosis (Bostock et al. 1995; Horn et al. 1996; Mogyoros et al. 1998; Kanai et al. 2006), presumably reflecting changes in the motoneuron (Pieri et al. 2003a,Pieri 2003b; Jablonka et al. 2004; Kuo et al. 2004; Larivière & Julien, 2004). However the simplest explanation for the present findings is that the changes in IH are due to changes in the activity of the motoneuron pools associated with unilateral paresis. If so, the present findings imply that prolonged changes in impulse traffic may produce long-term changes in the behaviour of neurons (induce ‘plasticity’) and thereby affect axonal properties and possibly their accessibility to external stimuli. Changes in activity underlie the processes responsible for learning and memory, such as long-term potentiation and long-term depression (Cooke & Bliss, 2006), and it is conceivable that similar mechanisms operate at motoneuron level when excitatory corticospinal drives are interrupted. The possibility that the uninvolved side of stroke patients expresses more IH while there is less on the involved could imply that the changes in IH represent a plastic change related to activity, with the uninvolved limb used more extensively when there is a deficit in the involved limb.
Other mechanisms could be responsible for the change in IH. It is an assumption that the axonal change reflects a change in motoneuron properties. Local factors affecting only the metabolism of the axon or its environment could be responsible, as could conduction of action potentials by the axon. Whether these factors would have produced changes in the axon without some changes in the parent neuron is uncertain, and we do not favour this possibility. Regardless of activity, changes in the intracellular metabolism acting through changes in the activity of adenylate cyclase will alter IH (McCormick & Pape, 1990; Tokimasa & Akasu, 1990). As noted above, the HCN isoforms most sensitive to cAMP are HCN2 and HCN4, and the former has been identified in rat motoneurons.
Intracellular acidosis shifts the activation curves for IH to the left (Munsch & Pape, 1999), and a positive shift in the voltage dependence can be induced by the diffusible messenger, nitric oxide (Pape & Mager, 1992). An increase in phosphatidylinositol bisphosphate (PIP2) levels causes a depolarizing shift in the activation voltage of HCN2, and depletion of PIP2 in vivo results in a hyperpolarizing shift in activation (Pian et al. 2006). Activation of the NMDA subclass of glutamate receptors will lead to an increase in intracellular Ca2+ and thereby to activation of cAMP-dependent pathways as well as calcium/calmodulin-dependent kinase II (for review, see Cooke & Bliss, 2006). Finally, the sensitivity of HCN channel activity to [K+]o might be an important mechanism for regulating IH function (Robinson & Siegelbaum, 2003).
Changes in other neurological diseases
Abnormalities of axonal excitability have been documented in many neurological disorders (Kiernan et al. 2005a). However in few have changes in IH been described, and patient findings need to be interpreted in the light of recent data that inward rectification increases with age (Jankelowitz et al. 2005, Jankelowitz 2007). Inward rectification is decreased in diabetes mellitus (Horn et al. 1996) and in animal models of diabetes (Yang et al. 2001), a change that reflects a parallel change in cAMP and responds to agents that boost intracellular cAMP (see Quasthoff, 1998). Changes in threshold electrotonus to hyperpolarizing currents also occur with changes in membrane potential, but these can be distinguished readily because there will then be changes in other excitability measures.
Conclusions
Accommodation to hyperpolarizing currents, presumably due to the hyperpolarization-activated conductance (IH) is decreased in motor but not sensory axons on the affected side of stroke patients, and may be increased in motor axons on the unaffected side. The changes could involve a number of isoforms of the HCN channel family, driven by changes in the activity of the parent motoneurons. Whatever the underlying mechanisms, the present findings imply that axonal excitability can change in synaptically remote axons not involved directly by the pathology. A comparable finding is the recently reported up-regulation of sodium channel Nav1.3 in thalamic neurons after spinal cord injury (Hains et al. 2005). The present findings could not have been predicted, but like the findings of Hains et al. (2005), they provide evidence for ‘plasticity’ of motoneurons and their axons following remote lesions.
Acknowledgments
This work was supported by the National Health & Medical Research Council of Australia.
Appendix
Membrane potential:
Currents:
Selx is the channel selectivity [ ] for X = Kf, Ks, H
Fast sodium:
Persistent sodium:
 |
Fast potassium:
Slow potassium:
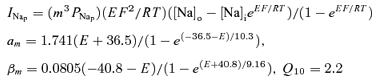
Hyperpolarisation-activated conductance:
Leak:
Ion concentrations (mm): [Na+]i 9, [Na+]o 144.2, [K+]i 155, [K+]o 4.5.
Resting potentials: Er, E*r−83.15mV.
References
- Aymard C, Katz R, Lafitte C, Lo E, Penicaud A, Pradat-Diehl P, Raoul S. Presynaptic inhibition and homosynaptic depression: a comparison between lower and upper limbs in normal human subjects and patients with hemiplegia. Brain. 2000;123:1688–1702. doi: 10.1093/brain/123.8.1688. [DOI] [PubMed] [Google Scholar]
- Baker M, Bostock H, Grafe P, Martius P. Function and distribution of three types of rectifying channel in rat spinal root myelinated axons. J Physiol. 1987;383:45–67. doi: 10.1113/jphysiol.1987.sp016395. [DOI] [PMC free article] [PubMed] [Google Scholar]
- Barrett EF, Barrett JN. Intracellular recording from vertebrate myelinated axons: mechanism of the depolarizing afterpotential. J Physiol. 1982;323:117–144. doi: 10.1113/jphysiol.1982.sp014064. [DOI] [PMC free article] [PubMed] [Google Scholar]
- Blight AR. Computer simulation of action potentials and afterpotentials in mammalian myelinated axons: the case for a lower resistance myelin sheath. Neuroscience. 1985;15:13–31. doi: 10.1016/0306-4522(85)90119-8. [DOI] [PubMed] [Google Scholar]
- Bostock H. MEMFIT: a computer program to aid interpretation of multiple excitability measurements on human motor axons. Clin Neurophysiol. 2006;117:S85. [Google Scholar]
- Bostock H, Baker M. Evidence for two types of potassium channel in human motor axons in vivo. Brain Res. 1988;462:354–358. doi: 10.1016/0006-8993(88)90564-1. [DOI] [PubMed] [Google Scholar]
- Bostock H, Baker M, Reid G. Changes in excitability of human motor axons underlying post-ischaemic fasciculations: evidence for two stable states. J Physiol. 1991;441:537–557. doi: 10.1113/jphysiol.1991.sp018766. [DOI] [PMC free article] [PubMed] [Google Scholar]
- Bostock H, Burke D, Hales JP. Differences in behaviour of sensory and motor axons following release of ischaemia. Brain. 1994;117:225–234. doi: 10.1093/brain/117.2.225. [DOI] [PubMed] [Google Scholar]
- Bostock H, Cikurel K, Burke D. Threshold tracking techniques in the study of human peripheral nerve. Muscle Nerve. 1998;21:137–158. doi: 10.1002/(sici)1097-4598(199802)21:2<137::aid-mus1>3.0.co;2-c. [DOI] [PubMed] [Google Scholar]
- Bostock H, Sharief MK, Reid G, Murray NM. Axonal ion channel dysfunction in amyotrophic lateral sclerosis. Brain. 1995;118:217–225. doi: 10.1093/brain/118.1.217. [DOI] [PubMed] [Google Scholar]
- Bowe CM, Kocsis JD, Waxman SG. The association of the supernormal period and the depolarizing afterpotential in myelinated frog and rat sciatic nerve. Neuroscience. 1987;21:585–593. doi: 10.1016/0306-4522(87)90144-8. [DOI] [PubMed] [Google Scholar]
- Caramia MD, Iani C, Bernardi G. Cerebral plasticity after stroke as revealed by ipsilateral responses to magnetic stimulation. Neuroreport. 1996;7:1756–1760. doi: 10.1097/00001756-199607290-00012. [DOI] [PubMed] [Google Scholar]
- Chen X, Sirois JE, Lei Q, Talley EM, Lynch C, Bayliss DA. HCN subunit-specific and cAMP-modulated effects of anaesthetics on neuronal pacemaker currents. J Neurosci. 2005;25:5803–5814. doi: 10.1523/JNEUROSCI.1153-05.2005. [DOI] [PMC free article] [PubMed] [Google Scholar]
- Chollett F, DiPiero V, Wise R, Brooks D, Dolan RJ, Frackowiak RS. The functional anatomy of motor recovery after stroke in humans: a study with positron emission tomography. Ann Neurol. 1991;29:63–71. doi: 10.1002/ana.410290112. [DOI] [PubMed] [Google Scholar]
- Cooke SF, Bliss TVP. Plasticity in the human central nervous system. Brain. 2006;129:1659–1673. doi: 10.1093/brain/awl082. [DOI] [PubMed] [Google Scholar]
- Daoudal G, Debanne D. Long-term plasticity of intrinsic excitability: learning rules and mechanisms. Learn Mem. 2003;10:456–465. doi: 10.1101/lm.64103. [DOI] [PubMed] [Google Scholar]
- Debanne D, Daoudal G, Sourdet V, Russier M. Brain plasticity and ion channels. J Physiol (Paris) 2003;97:403–414. doi: 10.1016/j.jphysparis.2004.01.004. [DOI] [PubMed] [Google Scholar]
- Feldman DE, Brecht M. Map plasticity in somatosensory cortex. Science. 2005;310:810–815. doi: 10.1126/science.1115807. [DOI] [PubMed] [Google Scholar]
- Gardiner P, Dai Y, Heckman CJ. Effects of exercise training on alpha-motoneurons. J Appl Physiol. 2006;101:1228–1236. doi: 10.1152/japplphysiol.00482.2006. [DOI] [PubMed] [Google Scholar]
- Gorassini MA, Knash ME, Harvey PJ, Bennett DJ, Yang JF. Role of motoneurons in the generation of muscle spasms after spinal cord injury. Brain. 2004;127:2247–2258. doi: 10.1093/brain/awh243. [DOI] [PubMed] [Google Scholar]
- Hains BC, Saab CY, Waxman SG. Changes in the electrophysiological properties and sodium channel Nav1.3 expression in thalamic neurons after spinal cord injury. Brain. 2005;128:2359–2371. doi: 10.1093/brain/awh623. [DOI] [PubMed] [Google Scholar]
- Hallett M. Transcranial magnetic stimulation and the human brain. Nature. 2000;406:147–150. doi: 10.1038/35018000. [DOI] [PubMed] [Google Scholar]
- Hallett M. Functional reorganisation after lesions of the human brain: studies with transcranial magnetic stimulation. Rev Neurol. 2001;157:822–826. [PubMed] [Google Scholar]
- Horn S, Quasthoff S, Grafe P, Bostock H, Renner R, Schrank B. Abnormal axonal inward rectification in diabetic neuropathy. Muscle Nerve. 1996;19:1268–1275. doi: 10.1002/mus.880191002. [DOI] [PubMed] [Google Scholar]
- Hornby TG, Kahn JH, Wu M, Schmit BD. Temporal facilitation of spastic stretch reflexes following human spinal cord injury. J Physiol. 2006;571:593–604. doi: 10.1113/jphysiol.2005.102046. [DOI] [PMC free article] [PubMed] [Google Scholar]
- Jablonka S, Wiese S, Sendtner M. Axonal defects in mouse models of motor neuron disease. J Neurobiol. 2004;58:272–286. doi: 10.1002/neu.10313. [DOI] [PubMed] [Google Scholar]
- Jankelowitz SK, Howells J, McNulty PA, Burke D. Changes in excitability of motor axons with age. J Neurol Sci. 2005;238(Suppl. 1):S462. [Google Scholar]
- Jankelowitz SK, McNulty P, Burke D. Changes in excitability of motor axons with age. Clin Neurophysiol. 2007 doi: 10.1016/j.clinph.2007.02.025. in press. [DOI] [PubMed] [Google Scholar]
- Ji R-R, Kohno T, Moore KA, Woolf CJ. Central sensitization and LTP: do pain and memory share similar mechanisms? Trends Neurosci. 2003;26:696–705. doi: 10.1016/j.tins.2003.09.017. [DOI] [PubMed] [Google Scholar]
- Kanai K, Kuwabara S, Misawa S, Tamura N, Ogawara K, Nakata M, Sawai S, Hattori T, Bostock H. Altered axonal excitability properties in amyotrophic lateral sclerosis: impaired potassium channel function related to disease stage. Brain. 2006;129:953–962. doi: 10.1093/brain/awl024. [DOI] [PubMed] [Google Scholar]
- Kaupp UB, Seifert R. Molecular diversity of pacemaker ion channels. Annu Rev Physiol. 2001;63:235–257. doi: 10.1146/annurev.physiol.63.1.235. [DOI] [PubMed] [Google Scholar]
- Kiernan MC, Burke D, Andersen KV, Bostock H. Multiple measures of axonal excitability: a new approach in clinical testing. Muscle Nerve. 2000;23:399–409. doi: 10.1002/(sici)1097-4598(200003)23:3<399::aid-mus12>3.0.co;2-g. [DOI] [PubMed] [Google Scholar]
- Kiernan MC, Burke D, Bostock H. Nerve excitability measures: biophysical basis and use in investigation of peripheral nerve disease. In: Dyck PJ, Thomas PK, editors. Peripheral Neuropathy. vol. 1. Amsterdam: Elsevier; 2005a. pp. 113–129. [Google Scholar]
- Kiernan MC, Isbister GK, Lin CS, Burke D, Bostock H. Acute tetrodotoxin-induced neurotoxicity after ingestion of puffer fish. Ann Neurol. 2005b;57:339–348. doi: 10.1002/ana.20395. [DOI] [PubMed] [Google Scholar]
- Kiernan MC, Lin CS-Y, Andersen KV, Murray NMF, Bostock H. Clinical evaluation of excitability measures in sensory nerve. Muscle Nerve. 2001;24:883–892. doi: 10.1002/mus.1085. [DOI] [PubMed] [Google Scholar]
- Kiernan MC, Lin CS-Y, Burke D. Differences in activity-dependent hyperpolarization in human sensory and motor axons. J Physiol. 2004;558:341–349. doi: 10.1113/jphysiol.2004.063966. [DOI] [PMC free article] [PubMed] [Google Scholar]
- Krishnan AV, Kiernan MC. Altered nerve excitability properties in established diabetic neuropathy. Brain. 2005;128:1178–1187. doi: 10.1093/brain/awh476. [DOI] [PubMed] [Google Scholar]
- Kuo JJ, Schonewille M, Siddique T, Schults AN, Fu R, Bar PR, Anelli R, Heckman CJ, Kroese AB. Hyperexcitability of cultured spinal motoneurons from presymptomatic ALS mice. J Neurophysiol. 2004;91:571–575. doi: 10.1152/jn.00665.2003. [DOI] [PubMed] [Google Scholar]
- Larivière RC, Julien J-P. Functions of intermediate filaments in neuronal development and disease. J Neurobiol. 2004;58:131–148. doi: 10.1002/neu.10270. [DOI] [PubMed] [Google Scholar]
- Lavrov I, Gerasimenko YP, Ichiyama RM, Courtine G, Zhong H, Roy RR, Edgerton VR. Plasticity of spinal cord reflexes after complete transection in adult rats: relationship to stepping ability. J Physiol. 2006;96:1699–1710. doi: 10.1152/jn.00325.2006. [DOI] [PubMed] [Google Scholar]
- Lin CS-Y, Kuwabara S, Cappelen-Smith C, Burke D. Responses of human sensory and motor axons to the release of ischaemia and to hyperpolarizing currents. J Physiol. 2002;541:1025–1039. doi: 10.1113/jphysiol.2002.017848. [DOI] [PMC free article] [PubMed] [Google Scholar]
- Marque P, Simonetta-Moreau M, Maupas E, Roques CF. Facilitation of transmission in heteronymous group II pathways in spastic hemiplegic patients. J Neurol Neurosurg Psychiatry. 2001;70:36–42. doi: 10.1136/jnnp.70.1.36. [DOI] [PMC free article] [PubMed] [Google Scholar]
- McCormick DA, Pape HC. Noradrenergic and serotonergic modulation of a hyperpolarization-activated cation current in thalamic relay neurones. J Physiol. 1990;431:319–342. doi: 10.1113/jphysiol.1990.sp018332. [DOI] [PMC free article] [PubMed] [Google Scholar]
- Meunier SO, Kwon J, Russmann H, Ravindram S, Mazzocchio R, Cohen L. Spinal use-dependent plasticity of synaptic transmission in humans after a single cycling session. J Physiol. 2007;579:375–388. doi: 10.1113/jphysiol.2006.122911. [DOI] [PMC free article] [PubMed] [Google Scholar]
- Misawa S, Kuwabara S, Kanai K, Tamura N, Hiraga A, Nakata M, Ogawara K, Hattori T. Axonal potassium conductance and glycemic control in human diabetic nerves. Clin Neurophysiol. 2005;116:1181–1187. doi: 10.1016/j.clinph.2004.12.019. [DOI] [PubMed] [Google Scholar]
- Mogyoros I, Kiernan MC, Burke D. Strength-duration properties of human peripheral nerve. Brain. 1996;119:439–447. doi: 10.1093/brain/119.2.439. [DOI] [PubMed] [Google Scholar]
- Mogyoros I, Kiernan MC, Burke D, Bostock H. Strength-duration properties of sensory and motor axons in amyotrophic lateral sclerosis. Brain. 1998;121:851–859. doi: 10.1093/brain/121.5.851. [DOI] [PubMed] [Google Scholar]
- Moosmang S, Stieber J, Zong X, Biel M, Hofmann F, Ludwig A. Cellular expression and functional characterization of four hyperpolarization-activated pacemaker channels in cardiac and neuronal tissues. Eur J Biochem. 2001;268:1646–1652. doi: 10.1046/j.1432-1327.2001.02036.x. [DOI] [PubMed] [Google Scholar]
- Munsch T, Pape H-C. Modulation of the hyperpolarization-activated cation current of rat thalamic relay neurons by intracellular pH. J Physiol. 1999;519:493–504. doi: 10.1111/j.1469-7793.1999.0493m.x. [DOI] [PMC free article] [PubMed] [Google Scholar]
- Nickolls P, Collins DF, Gorman RB, Burke D, Gandevia SC. Forces consistent with plateau potentials evoked in patients with chronic spinal cord injury. Brain. 2004;127:660–667. doi: 10.1093/brain/awh073. [DOI] [PubMed] [Google Scholar]
- Pape HC. Queer current and pacemaker: the hyperpolarization-activated cation current in neurons. Annu Rev Physiol. 1996;58:299–327. doi: 10.1146/annurev.ph.58.030196.001503. [DOI] [PubMed] [Google Scholar]
- Pape HC, Mager R. Nitric oxide controls oscillatory activity in thalamocortical neurons. Neuron. 1992;9:441–448. doi: 10.1016/0896-6273(92)90182-d. [DOI] [PubMed] [Google Scholar]
- Petajan JH. Motor unit control in spasticity. In: Feldman RG, Young RR, Koella WP, editors. Spasticity: Disordered Motor Control. Chicago: Year Book Publishers; 1980. pp. 233–249. [Google Scholar]
- Pian P, Bucchi A, Robinson RB, Siegelbaum SA. Regulation of gating and rundown of HCN hyperpolarization-activated channels by exogenous and endogenous PIP2. J Gen Physiol. 2006;128:593–604. doi: 10.1085/jgp.200609648. [DOI] [PMC free article] [PubMed] [Google Scholar]
- Pieri M, Albo F, Gaetti C, Spalloni A, Gengtson CP, Longone P, Cavalcanti S, Zona C. Altered excitability of motor neurons in transgenic mouse model of familial amyotrophic lateral sclerosis. Neurosci Lett. 2003a;351:153–156. doi: 10.1016/j.neulet.2003.07.010. [DOI] [PubMed] [Google Scholar]
- Pieri M, Gaetti C, Spalloni A, Cavalcanti S, Mercuri N, bernardi G, Longone P, Zona C. α-Amino-3-hydroxy-5-methyl-isoxazole-4-propionate receptors in spinal cord motor neurons are altered in transgenic mice overexpressing human Cu, Zn superoxide dismutase (Gly93?Ala) mutation. Neuroscience. 2003b;122:47–58. doi: 10.1016/j.neuroscience.2003.07.003. [DOI] [PubMed] [Google Scholar]
- Pierrot-Deseilligny E, Burke D. The Circuitry of the Human Spinal Cord. Its Role in Motor Control and Movement Disorders. Cambridge: Cambridge University Press; 2005. [Google Scholar]
- Quasthoff S. The role of axonal ion conductances in diabetic neuropathy: a review. Muscle Nerve. 1998;21:1246–1255. doi: 10.1002/(sici)1097-4598(199810)21:10<1246::aid-mus2>3.0.co;2-b. [DOI] [PubMed] [Google Scholar]
- Robinson RB, Siegelbaum SA. Hyperpolarization-activated cation currents: from molecules to physiological function. Annu Rev Physiol. 2003;65:453–480. doi: 10.1146/annurev.physiol.65.092101.142734. [DOI] [PubMed] [Google Scholar]
- Rosenfalck A, Andreassen S. Impaired regulation of force and firing pattern of single motor units in patients with spasticity. J Neurol Neurosurg Psychiatry. 1980;43:907–916. doi: 10.1136/jnnp.43.10.907. [DOI] [PMC free article] [PubMed] [Google Scholar]
- Saar D, Barkai E. Long-term modifications in intrinsic neuronal properties and rule learning in rats. Eur J Neurosci. 2003;17:2727–2734. doi: 10.1046/j.1460-9568.2003.02699.x. [DOI] [PubMed] [Google Scholar]
- Sanes JN, Donoghue JP. Plasticity and primary motor cortex. Annu Rev Neurosci. 2000;23:393–415. doi: 10.1146/annurev.neuro.23.1.393. [DOI] [PubMed] [Google Scholar]
- Schwarz JR, Glassmeier G, Cooper EC, Kao T-C, Nodera H, Tabuena D, Kaji R, Bostock H. KCNQ channels mediate IKs, a slow K+ current regulating excitability in the rat node of Ranvier. J Physiol. 2006;573:17–34. doi: 10.1113/jphysiol.2006.106815. [DOI] [PMC free article] [PubMed] [Google Scholar]
- Stieber J, Stöckl G, Herrmann S, Haâfurth B, Hofmann F. Functional expression of the human HCN3 channel. J Biol Chem. 2005;280:34635–34643. doi: 10.1074/jbc.M502508200. [DOI] [PubMed] [Google Scholar]
- Stys PK, Waxman SG. Activity-dependent modulation of excitability: implications for axonal physiology and pathophysiology. Muscle Nerve. 1994;17:969–974. doi: 10.1002/mus.880170902. [DOI] [PubMed] [Google Scholar]
- Tokimasa T, Akasu T. Cyclic AMP regulates an inward rectifying sodium-potassium current in dissociated bull-frog sympathetic neurones. J Physiol. 1990;420:409–429. doi: 10.1113/jphysiol.1990.sp017920. [DOI] [PMC free article] [PubMed] [Google Scholar]
- Weiller C, Chollet F, Friston KJ, Wise RJS, Frackowiak RS. Functional reorganisation of the brain in recovery from striatocapsular infarction in man. Ann Neurol. 1992;31:463–472. doi: 10.1002/ana.410310502. [DOI] [PubMed] [Google Scholar]
- Weiller C, Ramsay SC, Wise RJ, Friston KJ, Frackowiak RS. Individual patterns of functional reorganisation in the human cerebral cortex after capsular infarction. Ann Neurol. 1993;33:181–189. doi: 10.1002/ana.410330208. [DOI] [PubMed] [Google Scholar]
- Wolpaw JR, Tennissen AM. Activity-dependent spinal cord plasticity in health and disease. Annu Rev Neurosci. 2001;24:807–843. doi: 10.1146/annurev.neuro.24.1.807. [DOI] [PubMed] [Google Scholar]
- Yang Q, Kaji R, Takagi T, Kohara N, Murase N, Yamada Y, Seino Y, Bostock H. Abnormal axonal inward rectifier in streptozocin-induced experimental diabetic neuropathy. Brain. 2001;124:1149–1155. doi: 10.1093/brain/124.6.1149. [DOI] [PubMed] [Google Scholar]
- Young RR, Shahani BT. A clinical neurophysiological analysis of single motor unit discharge patterns in spasticity. In: Feldman RG, Young RR, Koella WP, editors. Spasticity: Disordered Motor Control. Chicago: Year Book Publishers; 1980. pp. 219–231. [Google Scholar]