Abstract
In this paper, we describe the fabrication and characterization of a reversibly sealed microchip device that is used to couple microdialysis sampling to microchip electrophoresis. The ability to interface microdialysis sampling and microchip electrophoresis in a device that is amenable to reversible sealing is advantageous from a repeated use standpoint. Commercially available tubing coming from the microdialysis probe is directly inserted into the chip and flow from the probe is interfaced to the electrophoresis portion of the device through integrated pneumatic valves. Fluorescence detection was used to characterize the poly(dimethylsiloxane)-based device in terms of injection reproducibility. It was found that the entire system (microdialysis probe and microchip device) has a concentration response lag time of 170 sec. Microdialysis sampling followed by an electrophoretic separation of amino acids derivatized with naphthalene-2,3-dicarboxaldehyde/cyanide was also demonstrated.
Keywords: microdialysis sampling, microchip electrophoresis, on-chip valving
Introduction
Microdialysis sampling has been widely utilized to monitor biologically relevant species both in vitro and in vivo.1-4 This sampling mode involves the use of a continuously perfused semi-permeable membrane. Analytes below the molecular weight cut-off diffuse across the membrane into a dialysate stream. Advantages of this sampling technique include the continuous nature of the sampling mechanism and the fact that the resulting dialysate is free of large molecules such as proteins.5 It has been shown by several groups that on-line coupling of microdialysis sampling to small volume separation techniques such as capillary electrophoresis (CE) enables rapid analysis of the microdialysis perfusate,1-4 which in turn increases the amount of information garnered from a microdialysis experiment and makes near real-time monitoring of a biological system possible.4
The coupling of CE with microdialysis, while powerful, has not been commercialized or widely used in the neurosciences, primarily because the fluidic interface used to couple the two techniques is complex and requires precise manual alignment. The coupling of microdialysis sampling to microchip-based electrophoresis is an attractive alternative. Photolithographic techniques can be used to reproducibly mass-fabricate planar devices where the interface design is fixed and constant. In addition, use of a microchip-based analysis system enables fast analysis times (on the orders of seconds), the possibility for portability and disposability, small channel volumes (on the order of nanoliters), and the ability to inject sample volumes as small as picoliters.6-8 Detection can be integrated through use of fluorescence, electrochemistry or mass spectrometry.9
The advantages of coupling microdialysis sampling to microchip-based electrophoresis has been realized by several groups, including ours.10-12 The interfaces used to couple microdialysis sampling to microchip-based electrophoresis include the use of a valveless gating approach,12 an on-chip flow splitter,11 and integrated pneumatic valves.10 While successful, each of these approaches involves an irreversibly sealed device, which has many disadvantages. The micron-sized channels used with microchip electrophoresis are prone to clogging and, with a permanently sealed microchip, the debris are often difficult to remove. For this reason, it is advantageous to have a device that is reversibly sealed and can be disassembled, cleaned, and reassembled when desired. An reversible seal is also important when microchip electrophoresis is integrated with electrochemical detection, as this type of seal enables the reuse of electrode plates that are often time consuming to fabricate.13-16 Finally, if an irreversible seal is desired in a poly(dimethylsiloxane) (PDMS) –based device, the short period of time between plasma exposure17 and bringing the layers into conformal contact makes alignment difficult.
In this paper, we describe a reversibly-sealed microchip device that uses pneumatic valves to couple microdialysis sampling to microchip electrophoresis. The PDMS-based microchip is fabricated so that the commercially available tubing coming from the microdialysis probe is directly inserted into the chip. As opposed to previous reports from our lab, the fabrication technique does not involve irreversibly sealing the microchip to a glass plate with fittings for gas and fluid introduction. Fluorescence detection was used to characterize the device in terms of injection reproducibility and the ability to respond to changes in analyte concentration. Microdialysis sampling and electrophoretic separation of an amino acid mixture is also demonstrated. This approach holds great promise for the development of an automated microchip device that can be used to monitor biological processes such as the release of neurotransmitters in vitro18 and in vivo.11,19
Experimental
Microchip Fabrication
The fabrication of the valve and flow channel masters were based upon previously published methods.10,20 Steps outlining this fabrication are shown in Figure 1. The flow channel master was made with a positive photoresist (AZ P4620, AZ Resist, Somerville, NJ). A post-development bake (20 min at 120 °C) was used to round the photoresist, which is crucial for proper valve actuation.21 The valving master was made with a negative photoresist (SU-8 50, Microchem, Newton, MA). To fabricate a microchip device from the masters, pieces of PDMS were placed around the edge of the valving master to form a mold about 10 mm in height, which aided in the creation of a thick layer of PDMS. A 5:1 mixture of Sylgard 184 elastomer:curing agent (Ellsworth Adhesives, Germantown, WI) was then poured into the valve mold while a 20:1 mixture of Sylgard 184 elastomer:curing agent was spin coated (2000 rpm for 1 min.) onto the flow channel master. The valve wafer was cured at 75 °C for 20 min., while the flow channel wafer cured at 75 °C for 15 min. Holes were then punched in the thick valve layer (∼3.5 mm thick) at the valve inlet with a 20 gauge luer stub adapter (Fisher Scientific, Springfield, NJ). This hole later serves as the inlet for nitrogen gas to actuate the valves. Alignment of the valve layer onto the flow layer was carried out under a stereomicroscope (SZ60, Olympus America, Melville, NY). The two layers were then cured together for 60 min. at 75 °C to form one PDMS microchip, which was then peeled up from the thin layer master. A sample access hole was created through the layers using the luer stub adapter, while a cork borer was used to form the waste and buffer reservoirs. The fluidic portion of the chip was then reversibly sealed to a glass substrate.
Figure 1.
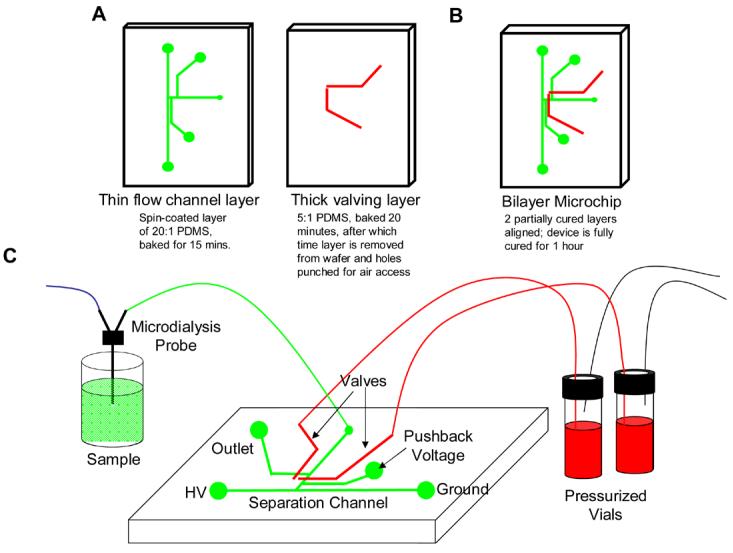
Fabrication steps used in these studies. A) 2 separate masters are used; 1 with the flow channel design and 1 with the valving layer design. The flow channel layer is spin coated and partially cured. The valving layer is 3.5 mm thick and also partially cured. B) The valving layer is removed from the wafer, aligned over the flow channel layer, and both layers are fully cured. C) The microchip device is connected to tubing that leads to either the microdialysis probe or pressurized actuation vials.
Chip Operation
Once a fully cured PDMS chip was reversibly sealed to a glass substrate, fluid and gas were delivered to the appropriate channels and valves. The valving channels were filled with water (denoted with red liquid in Figures 1 and 2) by pressurizing a water filled vial with nitrogen gas controlled by off-chip solenoid valves. This vial was connected to the chip with Tygon tubing and a steel pin (330 μm i.d. × 635 μm o.d., New England Small Tube Corp, Litchfield, NH). Once filled, solenoid valves (MAC Fluid Power Engineering, St. Louis, MO) were used to actuate the valves for a specific time. The valves were triggered by a timer-based control unit (Instrument Design Lab, University of Kansas, Lawrence, KS). Structures corresponding to the rounded flow channels were typically 25 μm in height, with the separation and pushback channels being 40 μm wide and the flow channel being 130 μm wide. The distance between the flow channel and pushback channel at the intersection was 50 μm. Valves were 90 μm in height and 240 μm in width. With the optimized valving design (see Figure 2), high voltage was applied to the buffer reservoir (B), a pushback voltage was applied to pushback reservoir (PB), and a ground was applied to buffer waste reservoir (BW).20 Sample coming from the probe was continuously pumped through the inlet hole (S) and out to sample waste hole (SW) while valve 2 was normally open and valve 1 was normally closed. In order to conduct an injection of sample, valve 1 would open for a specified amount of time (actuation time), while valve 2 was concurrently closed.
Figure 2.
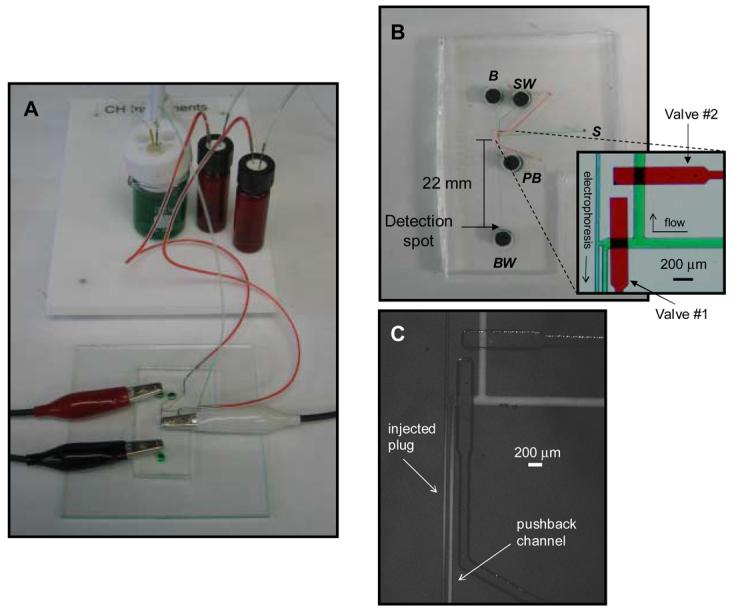
A) Picture of reversibly-sealed device, with valves being dead end filled with water (with red dye added in this picture) and flow from the microdialysis probe shown in green (water with green dye). Electrical leads are also shown. B) Close up of dye filled chip. Inset shows bright field micrograph of continuous flow/electrophoresis interface. C) Fluorescence micrograph showing an injected plug of 300 μM fluorescein (1.0 sec. actuation time).
For experiments involving the direct infusion of fluorescein (Figure 3), fluid was delivered to the flow channel from a 500 μL syringe (Hamilton, Reno, NV) by a syringe pump (Model 11 Plus, Harvard Apparatus, Holliston, MA) at 1 μL/min. Fluorescein was pumped from the syringe through a 360 μm o.d., 50 μm i.d. capillary (Polymicro Technologies, Pheonix, AZ) with a length of 39 cm. The capillary was fitted with a 395 μm i.d. × 794 μm o.d. tubing sleeve (Upchurch Scientific, Oak Harbor, WA) and placed directly into the flow inlet of the microchip. The outer diameter of the tubing sleeve offered a leak-free seal in the hole provided by the luer stub adapter. Injections into the separation channel were made by actuating the valves and the injected plugs were electrophoresed to the detector region. Sequential injections were made as the previous peak eluted.
Figure 3.
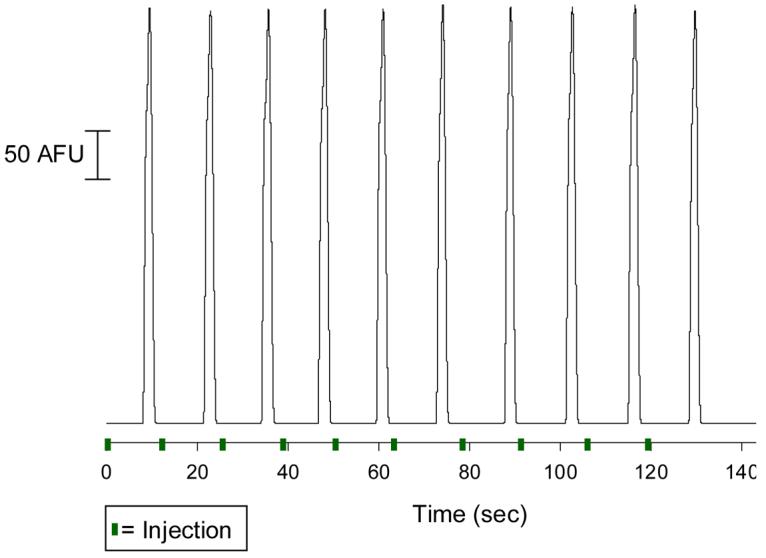
Continuous injection and electrophoretic separation of a 50 μM fluorescein solution. Parameters: 1.0 sec. valve actuation time; separation voltage = 1000 V; pushback voltage = 385 V; 1 μL/min hydrodynamic flow rate; buffer = 10 mM boric acid with 25 mM SDS (pH 9.5).
Studies involving microdialysis sampling (Figures 4 and 5) utilized a 2 mm polyacrylnitrile sampling probe (5 kDa molecular weight cutoff, BAS, West Lafayette, IN). Buffer was pumped at 1 μL/min. through 0.65 o.d., 0.12 mm i.d. microdialysis tubing (BAS) using a 500 μL syringe and syringe pump. Tubing connectors (BAS) were used to join tubing to the inlet and outlet of the probe. The tubing outer diameter enables a tight seal when directly inserted into the sample inlet hole (S in Figure 2B, made by 20 gauge luer stub). Concentration change experiments (Figure 4) consisted of first equilibrating the microdialysis probe with buffer (10 mM boric acid with 25 mM SDS, pH 9.5). The probe was then placed in a sample vial containing 100 μM fluorescein in this same buffer. The interface valves were actuated every 5.0 sec. (1.0 sec. actuation time) and the injected plugs were electrophoresed to the detector region. After an equilibration period, an additional aliquot of fluorescein was added to the vial using a pipette so that the final concentration was 182 μM. In order to demonstrate the analysis of amino acids with the system (Figure 5), the amino acids were first derivatized with naphthalene-2,3-dicarboxaldehyde (NDA, Invitrogen, Carlsbad, CA), a fluorescent label. Amino acids (tyrosine and aspartic acid) were derivatized in a sample vial to a final volume of 10 mL. To perform the derivatization, amino acid (tyrosine and aspartic acid, final concentration = 300 μM each), buffer (10 mM boric acid with 25 mM SDS, pH 9.5), sodium cyanide (final concentration = 2 mM), and NDA (final concentration = 0.2 mM) were added in order to the vial. A microdialysis probe was used to sample the amino acids from this vial, with 1.0 sec valve actuation time and 5.0 sec. injection interval. Once injected into the electrophoresis channel, the amino acids were separated and fluorescently detected.
Figure 4.
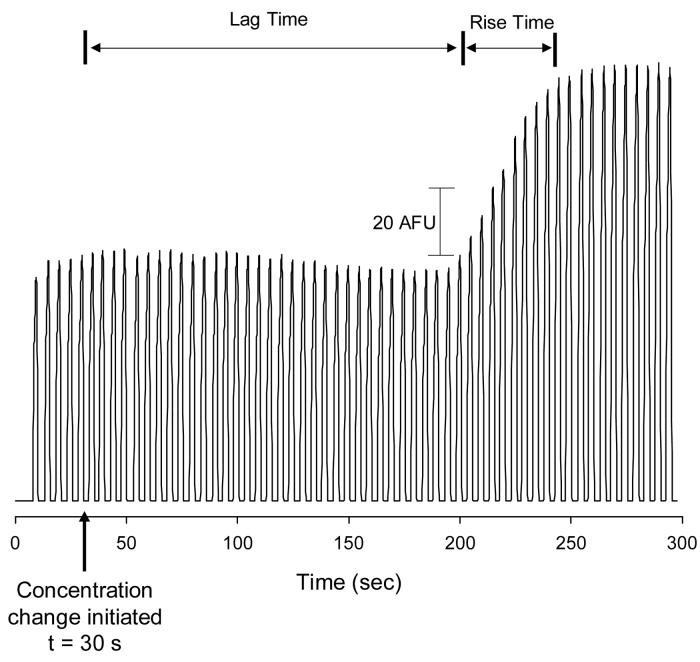
Off-chip concentration change experiment. The concentration of fluorescein was changed from 100 μM to 180 μM through the manual addition of fluorescein into the sample vial. The concentration change was initiated at 30 s. Other experimental conditions are the same as in Figure 3.
Figure 5.
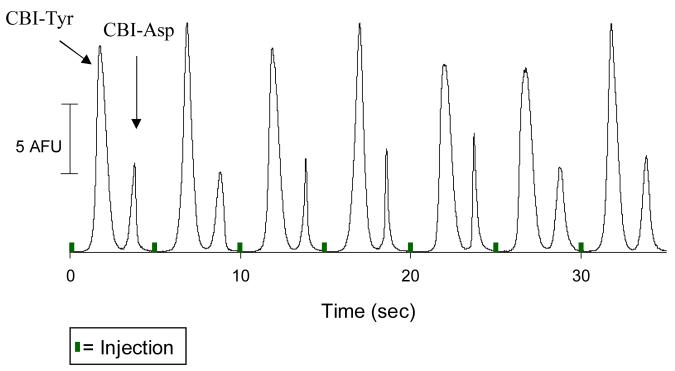
Sampling of fluorescently labeled amino acids through a microdialysis probe, with subsequent separation by the microchip device. Analytes = NDA-labeled tyrosine (CBI-Tyr) and NDA-labeled aspartic acid (CBI-Asp). Other experimental conditions are the same as in Figure 3.
Fluorescence Detection
A fluorescence microscope (IX71, Olympus America) and a cooled 12-bit monochrome QICAM FAST digital CCD camera (QImaging, Montreal, Canada) were used to generate electropherograms. Images were captured at a frequency of at least 19 Hz using Streampix Digital Video Recording software (Norpix Inc, Montreal, Canada). This software also allowed pixel integration over a user specified area. The detector region was placed 22 mm from the interface and was set to be 12 × 37 μm. This data was output to a Microsoft Excel file and the resulting data was processed using ChromPerfect software (Justice Laboratories, Denville, NJ). For measurements involving fluorescein, a 420-480 nm band pass filter was used for excitation and a 520 nm long pass filter was used for emission (UIS2 Series, Olympus America). Studies involving NDA-derivatized amino acids used a 400-440 nm band pass filter for excitation and a 475 nm long pass for emission (UIS2 Series, Olympus America).
Results and Discussion
The procedure used to fabricate the reversibly sealed device is shown in Figure 1. The flow channel master was fabricated by patterning positive photoresist, as it has been shown that heating this type of resist leads to rounded structures necessary for proper actuation of PDMS-based valves.21,22 Different ratios of elastomer:curing agent were poured over each master and the PDMS was partially cured by a short heating step, after which time gas access holes were made in the valving layer with a luer stub adapter and the entire layer was sealed onto the thin layer. After full curing in an oven, the chip was reversibly sealed to a glass plate. The ability to perform a reversible seal is in part due to the ability of the thick PDMS chip to support the tubing and steel pins used to introduce fluids and gases. This is facilitated by making the valving layer ∼3.5 mm thick with the aid of a PDMS mold. The tubing coming from the microdialysis probe as well as the steel pins used for valve actuation fit tightly into the holes provided by the 20 gauge luer stub adapter (Figure 2A), ensuring a leak free seal. The fabrication process is reproducible, as separate chips were used to generate the data shown below (4 separate chips for the data shown in Figures 2 through 5).
The electrophoresis/hydrodynamic flow interface is based on previous work published in our lab.20 This interface includes two PDMS-based valves (Figure 2B). Valve #1 is normally closed and valve #2 is normally open. In this configuration, hydrodynamic flow coming from the sample inlet (S) is directed to waste (SW). To perform an injection into the electrophoresis portion of the device, these states are switched (valve #1 open, valve #2 closed) for a period corresponding to the actuation time. This hydrodynamically injects sample into the electrophoresis portion of the device (Figure 2C). With the 1.0 sec. actuation time shown in Figure 2C, this leads to an injection volume of 1.2 nL. Another key part of the interface is the pushback channel, which is the channel between valve #1 and the electrophoresis channel. This channel helps eliminate stagnant sample within the interface and leakage into the electrophoresis separation channel. A pushback voltage (fraction of the separation voltage) is applied via the pushback reservoir (PB) to keep non-injected analyte out of the separation channel (Figures 2B and C).10,20
The long-term goal of this work is to develop a device that can be reversibly sealed over a glass plate that contains electrodes for amperometric detection.13,16 To characterize the reproducibility of the interface in a device that is reversibly sealed to glass, a 50 μM fluorescein solution was directly infused into the flow portion of the chip. This solution was introduced to the chip through a 360 μm o.d., 50 μm i.d. capillary tube that was fitted with a 794 μm o.d. tubing sleeve. The outer diameter of the tubing sleeve offered a leak-free seal in the hole provided by the luer stub adapter. Injections into the separation channel were made by actuating the valves and the injected plugs were electrophoresed to the detector region. As can be seen in Figure 3, the injection process is reproducible, with 10 consecutive injections of fluorescein leading to an average peak height of 212.33 ± 1.06 AFU (0.50 % RSD; peak area = 333.9 ± 11.7 AU). Injections (1.0 sec. actuation time) were made immediately after the previous peak eluted, resulting in an injection every 13 sec.
A common goal of microdialysis experiments is to monitor changes in analyte concentration as a function of time. This type of measurement is important for both pharmacokinetic23 and neurochemical19 studies. To evaluate the ability of the analytical system (microchip device and microdialysis probe) to respond to an external change in concentration, a study in which the probe is exposed to solutions of differing analyte concentration was performed. In this study, we utilized a commercially available 2 mm sampling probe. Interfacing the probe with the chip was done in a straightforward manner with commercially available tubing that accompanies the probe (0.65 mm o.d., 0.12 mm i.d. tubing). Tubing connectors, which also accompany the probes, were used to connect tubing to the inlet and outlet of the probe. The outer diameter of the tubing offers a tight seal when directly inserted into the sample inlet hole. Lag and rise time are commonly used to evaluate the analytical performance of these types of sampling/analysis systems, with lag time being defined as the amount of time needed for the device to start to respond to a change in concentration.10 The rise time can be viewed as the time it takes for the response to rise from 10% to 90% of the total change.24
For this concentration change study, the probe was first equilibrated with buffer and then it was placed in a sample vial of buffer that contained 100 μM fluorescein. The interface valves were actuated every 5.0 sec. (1.0 sec. actuation time) and the injected plugs were electrophoresed to the detector region. After an equilibration period, an additional aliquot of fluorescein was added to the vial so that the final concentration was 182 μM. The results of this experiment are shown in Figure 4. As can be seen, the switch from 100 μM to 182 μM fluorescein was made 30 sec. into this experiment. It was found that the system had a lag time of 170.0 sec and a rise time of 40.0 sec, which is similar to values obtained in irreversibly sealed devices.10,11 While we were not able to determine the dead volume of the microdialysis probe itself, a significant contributor to the lag time value obtained is the dead volumes of the connector tubing. Using a 20 cm section of connector tubing results in a tubing volume of 2.26 μL. The volume of the sample inlet hole is 0.22 μL while the volume of the microchannel between the inlet hole and the valving interface is only 0.04 μL, meaning that most of the lag time contribution comes from off-chip processes. In the future this can be minimized by using smaller i.d. tubing, shorter lengths of connection tubing, and smaller volume microdialysis probes.
Finally, to demonstrate the ability of the device to perform a separation, a fluorescently-labeled amino acid mixture was sampled by the probe and separated by free-zone electrophoresis. The probe was placed in a reaction vial that contained the amino acids of interest (tyrosine and aspartic acid) as well as reagents to derivatize these amino acids with naphthalene-2,3-dicarboxaldehyde/cyanide.25,26 The resulting fluorescent 1-cyano-2-substituted-benz[f]isoindole (CBI) derivatives were sampled by the probe and continuously injected and separated. As can be seen in Figure 5, a separation of the two labeled amino acids is possible, with an average resolution (Rs) of 2.34 being achieved. The boric acid separation buffer also included sodium dodecyl sulfate (SDS), which has been shown to decrease analyte absorption into hydrophobic PDMS surfaces.27 We have previously shown that the addition of SDS is crucial for reproducible analysis of NDA-labeled amino acids, which, due to their benz[f]isoindole ring structure, are relatively hydrophobic.20 The average peak height for 7 injections of CBI-Tyrosine and CBI-Aspartic acid were 14.96 ± 1.40 AFU (peak area = 10.13 ± 0.29 AU) and 6.68 ± 0.91 AFU (peak area = 2.53 ± 0.65 AU), respectively.
Conclusions
The successful coupling of microdialysis sampling to microchip-based electrophoresis in a reversibly sealed device has been described. Tubing from the microdialysis probe can be directly inserted into the PDMS microchip. The flow from the probe is interfaced to the electrophoresis portion of the device through integrated pneumatic valves. The coupling of these two techniques was characterized in terms of responding to change in concentration as well as the ability to sample and separate an amino acid mixture. The capability to reversibly seal the final device is advantageous from a repeated use standpoint. In addition, the long term goal of this work is to interface microdialysis sampling and microchip electrophoresis to amperometric detection for neurotransmitter analysis. Previous work from our lab has shown that the electrodes needed for interfacing microchip electrophoresis to amperometric detection can be fabricated on a glass substrate. Since the fabrication of these electrode plates is a lengthy and relatively costly process, the ability to reversibly seal a microchip device that can be integrated with microdialysis sampling is a significant advantage.13,16 The integration of amperometric detection with microdialysis sampling and microchip electrophoresis in a reversibly sealed device will be the subject of future work from our laboratory.
Acknowledgements
This research was supported by grants from Stanford University (CIS New User Grant) and the National Institutes of Health (R15 NS048103) as well as a Monsanto Fellowship from Saint Louis University (L.C.M).
Footnotes
Publisher's Disclaimer: This is a PDF file of an unedited manuscript that has been accepted for publication. As a service to our customers we are providing this early version of the manuscript. The manuscript will undergo copyediting, typesetting, and review of the resulting proof before it is published in its final citable form. Please note that during the production process errors may be discovered which could affect the content, and all legal disclaimers that apply to the journal pertain.
References
- 1.Lada MW, Kennedy RT. Anal. Chem. 1996;68:2790–2797. doi: 10.1021/ac960178x. [DOI] [PubMed] [Google Scholar]
- 2.Hogan BL, Lunte SM, Stobaugh JF, Lunte CE. Anal. Chem. 1994;66:596–602. doi: 10.1021/ac00077a004. [DOI] [PubMed] [Google Scholar]
- 3.Thompson JE, Vickroy TW, Kennedy RT. Anal. Chem. 1999;71:2379–2384. doi: 10.1021/ac981115c. [DOI] [PubMed] [Google Scholar]
- 4.Lada MW, Vickroy TW, Kennedy RT. Anal. Chem. 1997;69:4560–4565. doi: 10.1021/ac970518u. [DOI] [PubMed] [Google Scholar]
- 5.Ungerstedt U. In: Measurement of Neurotransmitter Release In Vivo. Mardsen CA, editor. John Wiley & Sons; 1984. pp. 81–105. [Google Scholar]
- 6.Dittrich PS, Tachikawa K, Manz A. Anal. Chem. 2006;78:3887–3908. doi: 10.1021/ac0605602. [DOI] [PubMed] [Google Scholar]
- 7.Vilkner T, Janasek D, Manz A. Anal. Chem. 2004;76:3373–3386. doi: 10.1021/ac040063q. [DOI] [PubMed] [Google Scholar]
- 8.Martin RS, Root PD, Spence DM. Analyst. 2006;131:1197–1206. doi: 10.1039/b611041j. [DOI] [PubMed] [Google Scholar]
- 9.Pasas SA, Fogarty BA, Huynh BH, Lacher NA, Carlson B, Martin RS, Vandeveer WR, IV, Lunte SM. In: Separation Methods in Microanalytical Systems. Kutter JP, Fintschenko Y, editors. CRC Press; Boca Raton: 2006. [Google Scholar]
- 10.Li MW, Huynh BH, Hulvey MK, Lunte SM, Martin RS. Anal. Chem. 2006;78:1042–1051. doi: 10.1021/ac051592c. [DOI] [PubMed] [Google Scholar]
- 11.Sandlin ZD, Shou M, Shackman JG, Kennedy RT. Anal. Chem. 2005;77:7702–7708. doi: 10.1021/ac051044z. [DOI] [PubMed] [Google Scholar]
- 12.Huynh BH, Fogarty BA, Martin RS, Lunte SM. Anal. Chem. 2004;76:6440–6447. doi: 10.1021/ac049365i. [DOI] [PubMed] [Google Scholar]
- 13.Kovarik ML, Li MW, Martin RS. Electrophoresis. 2005;26:202–210. doi: 10.1002/elps.200406188. [DOI] [PubMed] [Google Scholar]
- 14.Lacher NA, Lunte SM, Martin RS. Anal. Chem. 2004;76:2482–2491. doi: 10.1021/ac030327t. [DOI] [PubMed] [Google Scholar]
- 15.Martin RS, Gawron AJ, Lunte SM, Henry CS. Anal. Chem. 2000;72:3196–3202. doi: 10.1021/ac000160t. [DOI] [PubMed] [Google Scholar]
- 16.Mecker LC, Martin RS. Electrophoresis. 2006;27:5032–5042. doi: 10.1002/elps.200600401. [DOI] [PubMed] [Google Scholar]
- 17.Duffy DC, McDonald JC, Schueller OJA, Whitesides GM. Anal. Chem. 1998;70:4974–4984. doi: 10.1021/ac980656z. [DOI] [PubMed] [Google Scholar]
- 18.O'Brien KB, Esguerra M, Millter RF, Bowser MT. Anal. Chem. 2004;76:5069–5074. doi: 10.1021/ac049822v. [DOI] [PubMed] [Google Scholar]
- 19.Watson CJ, Venton BJ, Kennedy RT. Anal. Chem. 2006;78:1391–1399. doi: 10.1021/ac0693722. [DOI] [PubMed] [Google Scholar]
- 20.Li MW, Martin RS. Electrophoresis. 2007 in press. [Google Scholar]
- 21.Unger MA, Chou HP, Thorsen T, Scherer A, Quake SR. Science. 2000;288:113–116. doi: 10.1126/science.288.5463.113. [DOI] [PubMed] [Google Scholar]
- 22.Thorsen T, Maerkl SJ, Quake SR. Science. 2002;298:580–584. doi: 10.1126/science.1076996. [DOI] [PubMed] [Google Scholar]
- 23.Garrison KE, Pasas SA, Cooper JD, Davies MI. Eur. J. Pharm. Sci. 2002;17:1–12. doi: 10.1016/s0928-0987(02)00149-5. [DOI] [PubMed] [Google Scholar]
- 24.Skoog DA, Holler FJ, Nieman TA. Principles of Instrumental Analysis. 5th ed. Harcourt Brace; Philadelphia, PA: 1998. [Google Scholar]
- 25.De Montigny P, Stobaugh JF, Givens RS, Srinivasachar K, Sternson LA, Higuchi T. Anal. Chem. 1987;59:1096–1101. [Google Scholar]
- 26.Matuszewski BK, Givens RS, Srinivasachar K, Carlson RG, Higuchi T. Anal. Chem. 1987;59:1102–1105. doi: 10.1021/ac00135a008. [DOI] [PubMed] [Google Scholar]
- 27.Roman GT, McDonald K, Culbertson CT. Analyst. 2006;131:194–201. doi: 10.1039/b510765b. [DOI] [PubMed] [Google Scholar]


