Abstract
Purpose
To compare two ‘4D’ methods for image-guided target localization in the presence of respiration.
Methods and Materials
4D image guidance was performed using two methods. A respiration-correlated CT (RCCT) was acquired on a CT simulator, and an average CT (AVG-CT) image was generated from the RCCT. A respiration-correlated cone beam CT (RC-CBCT) and a free-breathing cone beam CT (FB-CBCT) were acquired. The ‘RCCT method’ consisted of calculating the mean target position on both the RCCT and RC-CBCT, registering the RCCT to the RC-CBCT, and determining the shift in the mean target position from the planned mean position. The ‘AVG-CT method’ consisted of registering the AVG-CT to the FB-CBCT. The ability of each to measure the shift in the mean target position was compared, both in a respiratory phantom and in eight patients.
Results
In phantom, the RCCT and AVG-CT methods were able to measure the true mean target position to within 0.15 cm and 0.10 cm, respectively. In the patient study, the mean error between the methods was 0.13 cm (LR), 0.14 cm (AP), and 0.10 cm (CC). The error was not observed to vary with tumor position or magnitude of tumor motion.
Conclusions
Respiration may impact the online image guidance process. The RCCT method enables localization of the mean tumor position and measurement of changes in the motion pattern, while the AVG-CT method is simple, fast, and easily implemented. We found the methods to be nearly equivalent in detecting shifts in the mean tumor position.
Keywords: Image guidance, respiratory motion, lung cancer, cone-beam CT
Introduction
The effect of respiration on the dose distribution has been the focus of much study in the past decade, which has lead directly to the development of motion compensation technology – respiratory gating (1;2) and active breathing control (3) being prime examples. A more limited field of study, at least with respect to radiotherapy, has been the effect of respiration on imaging used for treatment planning. Balter et al. explored the uncertainties induced by respiration in helical planning CT images (4). Chen et al. analyzed these same uncertainties in phantom (5). Essentially, these uncertainties can be grouped into systematic and random effects (6). With a modern multislice CT, the entire lung volume can be scanned within a single respiration cycle. If the tumor is not large, it will be nearly ‘frozen’ in the image, as the scan time around the tumor location is fast compared to the speed of tumor motion, minimizing random blurring artifact. However, this ‘frozen’ image of the tumor is captured at an arbitrary position within the respiration cycle. Lacking knowledge of this position within the cycle, the tumor cannot be repositioned for treatment at the same position, and thus systematic error will be introduced into the treatment process. For larger tumors (or fast breathers), the image of the tumor may be deformed from the true shape due to motion-induced artifact.
Several methods have been proposed which will reduce these uncertainties in the imaging process, including gated or breath hold imaging. For free-breathing planning and delivery, the simplest method is to require that the tumor be imaged and treated at the mean (temporally-averaged) position in the respiratory cycle (7–9). In this paper, we will consider two methods for acquiring an image at the mean position: the first is to acquire a ‘slow’ CT (10) averaged over multiple respiration cycles (AVG-CT), the second method is the acquisition of a respiration-correlated CT (RCCT) and retrospective calculation of the mean position, similar to the mid-ventilation image approach of Wolthaus et al. (9)
Both the AVG-CT and RCCT approaches were proposed with the purpose of better modeling respiration in the treatment planning process. However, the applicability of these approaches for volumetric online image guidance has not been evaluated. In this paper, we have constructed a corresponding image guidance process for each of these two methods using cone beam CT as the online guidance modality.
The goals of this study were to develop and compare two dynamic image guidance strategies. Each was designed to compensate for respiration-induced error in planning and online imaging, one approach based on the AVG-CT, and the other based on RCCT. The goal of each dynamic guidance method was to determine the required shift to localize the mean respiratory position of the target to the planned mean position, and to allow for adjustment of the patient position online to correct for this error. The accuracy of the two approaches was quantified in a phantom study, and then the approaches were compared in a patient study.
Methods and Materials
CT Image Acquisition
A RCCT was acquired on a multislice helical CT simulator (Brilliance Big Bore, Philips Medical Systems, Andover, MA) for use as a reference image in the RCCT method. The RCCT was sorted into ten phases, using equally-distributed temporal bins. RCCT generation on this scanner has been described in detail previously (11). An AVG-CT was generated by averaging each voxel intensity of the RCCT over time, producing a temporally-averaged dataset. The AVG-CT was used as the reference image for the AVG-CT method. Two methods for temporal averaging were evaluated: directly averaging the voxel intensity, and using a smoothing kernel to perform estimation of the probability density prior to averaging. Directly averaging the voxel intensities was found to be equivalent to using kernel density estimation to produce the AVG-CT, so direct averaging was used in this study.
Cone Beam CT Image Acquisition
Free breathing cone beam CT (FB-CBCT) acquisition was performed on a commercial system (Synergy, Elekta Oncology Systems). The clinical cone beam CT system requires approximately two minutes to acquire a full cone beam CT. For this study, the gantry speed was slowed to allow a four minute acquisition for respiration-correlated cone beam CT (RC-CBCT) generation. Similar to the process described above for CT, two types of images were reconstructed from the FB-CBCT acquisition. First, all of the projection data was reconstructed into a static FB-CBCT scan. Second, a RC-CBCT image was generated from the FB-CBCT acquisition. RC-CBCT acquisition followed a similar method as that described by Sonke et al. (12). An in-house algorithm was used to detect the cranio-caudal position of the diaphragm apex in each raw projection image of the cone beam CT. The resulting position-projection curve was used to sort the projections into six bins equally spaced in time. Six phases were used for RC-CBCT, instead of the ten used for RCCT, in order to achieve acceptable image quality while limiting the patient dose to 6 cGy or less per scan. A 180 degree plus half fan angle (approximately 200 degree) gantry rotation was used, while the gantry speed was reduced by approximately a factor of two from the standard clinical scanning speed to produce approximately 700 projections per RC-CBCT acquisition.
AVG-CT Guidance Method
In order to perform an error-free registration of a reference image and an online treatment image, the images must contain the same pattern of random and systematic artifacts. For this method, we hypothesize that an AVG-CT produces an image of the tumor centered at the mean position of the tumor in the respiration cycle. Therefore, if AVG-CTs are utilized both as reference and treatment images, the mean position of the tumor should be aligned by registering the two images. The AVG-CT from a helical CT simulator was used as the reference image. For the online treatment image, the FB-CBCT was used as acquired with the commercial system. The FB-CBCT scan period of two to four minutes equates to dozens of respiration cycles. Due to this slow acquisition time, FB-CBCT is a form of AVG-CT. To determine the target position error per fraction, the reference image (AVG-CT) was registered to the FB-CBCT. A mask was first applied to the image sets so that only the target was used in the registration process. Commercial registration software (XVI v3.5, Elekta Oncology Systems, Crawley, UK) was used to perform an automatic registration using the correlation ratio of all voxel intensities in the masked region (13). Rigid-body translation and rotation of the image sets about the treatment isocenter was allowed during the registration, but rotations were eliminated after the best registration match was found.
RCCT Guidance Method
For the second guidance strategy, RCCTs were used to directly calculate the shift in the mean tumor position between planning and treatment fractions. Similar to the AVG-CT method described already, this method calculates the relative change (between a planning image and treatment image) in the mean tumor position, averaged over the respiration cycle. For this method, the RCCT from which the AVG-CT was generated was also used as the reference image. The RC-CBCT was used as the treatment image. Guidance using RCCT relies on the accurate calculation of the mean tumor position using the RCCT image data. The end inhalation phase image (phase 0%) was selected to be the reference phase image. Each phase image in the RCCT was registered to the reference phase image using the same gray value algorithm described for the AVG-CT method above. If rotations and scaling are ignored in the registration procedure, the transformation matrix reduces to a three-component translation vector T(Ii,Ij), where Ii is the reference image set and Ij is the secondary image set. The mean position can then be calculated from:
| (1) |
where T̄ is the translation vector from the reference phase image to the mean position, and Np is the number of phase images. To implement Equation (1), each of the individual phase images was registered to the reference phase image, and the resulting Np translation vectors were averaged.
A reference point is required to define the registration between a planning image and a treatment image. The centroid of the mean tumor position was determined by delineating the gross tumor volume on the reference phase image, calculating the centroid of the delineation, and then applying the translation T̄ to this point. The centroid of the mean tumor position was then used as the reference point. This same reference point was used for both the AVG-CT strategy and this RCCT strategy.
To register the RCCT to the RC-CBCT, an automatic intensity-based method was utilized. First, the translation vector for the RCCT, T̄p , was calculated using Equation (1). This matrix represented the translation from the reference phase of the RCCT to the mean tumor position as measured from the RCCT. A translation vector was then calculated for the RC-CBCT, using the end inhalation phase of the RC-CBCT as the reference phase image, and registering each phase image of the RC-CBCT to this reference phase image. This translation vector was designated T̄cbct , and represented the translation from the reference phase of the RC-CBCT to the daily mean tumor position, in the coordinate system of the RC-CBCT. Finally, the reference phases of the RCCT and RC-CBCT were registered to produce a translation Tp-cbct. The shift in the mean tumor position is then given by:
| (2) |
Phantom Studies
A small rubber sphere was placed on an oscillating platform, and was set into motion in a sawtooth pattern of varying magnitude. The motion was one-dimensional, simulating cranio-caudal motion only. A RCCT was acquired with 2cm motion magnitude and approximately 5s period. A standard helical CT of the stationary object at the nominal mean position was acquired as well. The phantom was set up in the same manner on the treatment table, and a cone beam CT was acquired with the stationary phantom offset from the treatment isocenter by approximately 1cm in the left –right (LR), anterior-posterior (AP) and cranio-caudal (CC) directions. Three FB-CBCT scans were acquired with the motion magnitude (peak-to-trough distance) set to 1cm, 2cm, and 3cm, respectively. The FB-CBCT scan of the stationary sphere was registered to the stationary planning scan to determine the nominal offset of the sphere on the treatment table. Both the AVG-CT and RCCT guidance methods were applied, and the mean position of the sphere during ‘treatment’ was compared to the planned position for both guidance methods.
Patient Studies
Eight patients were enrolled on an imaging study approved by William Beaumont Hospital’s institutional review board. Each patient received a RCCT during simulation, and the planning isocenter was placed at the mean tumor position as determined from the RCCT for use as a reference point. The RCCT was also converted into an AVG-CT as described above. Once per week during treatment, a FB-CBCT was acquired immediately following treatment. Each FB-CBCT was reconstructed in full, and sorted into a RC-CBCT. The RCCT and AVG-CT guidance methods were applied using these image data. The measured shifts were compared between the two methods.
Results
Phantom Studies
Figure 1 shows the actual phantom motion curve, and the interpolated curves generated from the RCCT and RC-CBCT registration data, CC direction only. The actual excursion (peak-to-trough distance) in the CC direction was 2.0 cm. The excursion was measured to be 1.7 cm from the RCCT scan and 1.8 cm from the RC-CBCT scan. For the nominal 1 cm and 3 cm motion patterns, the excursions from RC-CBCT were 1.0 and 2.4 cm, respectively. The ‘sawtooth’ pattern was chosen because it is a particularly difficult pattern to reproduce with RCCT due to the large change in velocity at end of range and the high constant speed. A more typical patient respiratory pattern, with a smoother transition between inhalation and exhalation, should produce less error in the excursion measurement.
Figure 1.
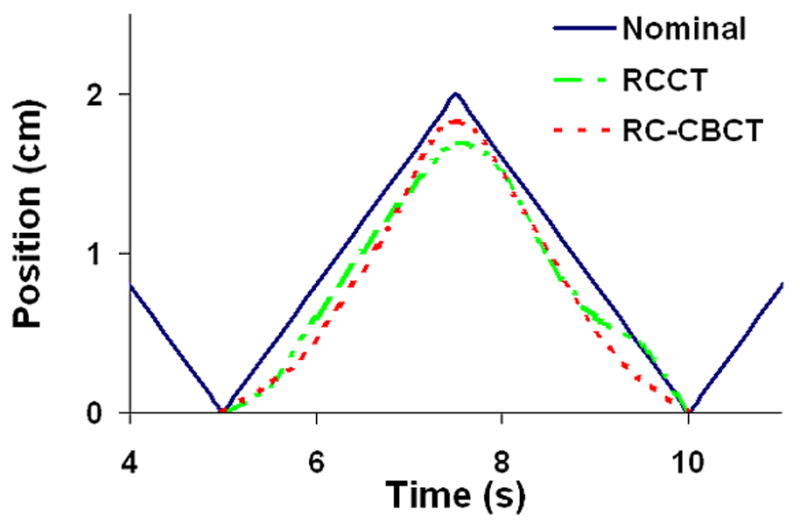
Position – time curve for the oscillating sphere, cranio-caudal direction. ‘Nominal’ is the actual motion pattern of the sphere. ‘RCCT’ is the interpolated curve generated from the centroid positions of the sphere from the RCCT image. ‘RC-CBCT’ is the corresponding interpolated curve from the RC-CBCT image. All curves were normalized to the zero position, which corresponded to ‘end inhalation’, the most inferior position.
Figure 2 shows coronal sections of the sphere from both CT and CBCT imaging. The trade-offs between the two dynamic imaging techniques are evident here. Both the AVG-CT and FB-CBCT (Fig. 2b) images show obvious motion blurring inherent in slow CT scans. However, the FB-CBCT, utilizing the fully sampled set of projection data, contains less spatial reconstruction artifact than the RC-CBCT image in Fig. 2c. Conversely, the RC-CBCT resolves the motion clearly, but contains streaking and ‘ghosting’ artifact due to low angular sampling.
Figure 2.
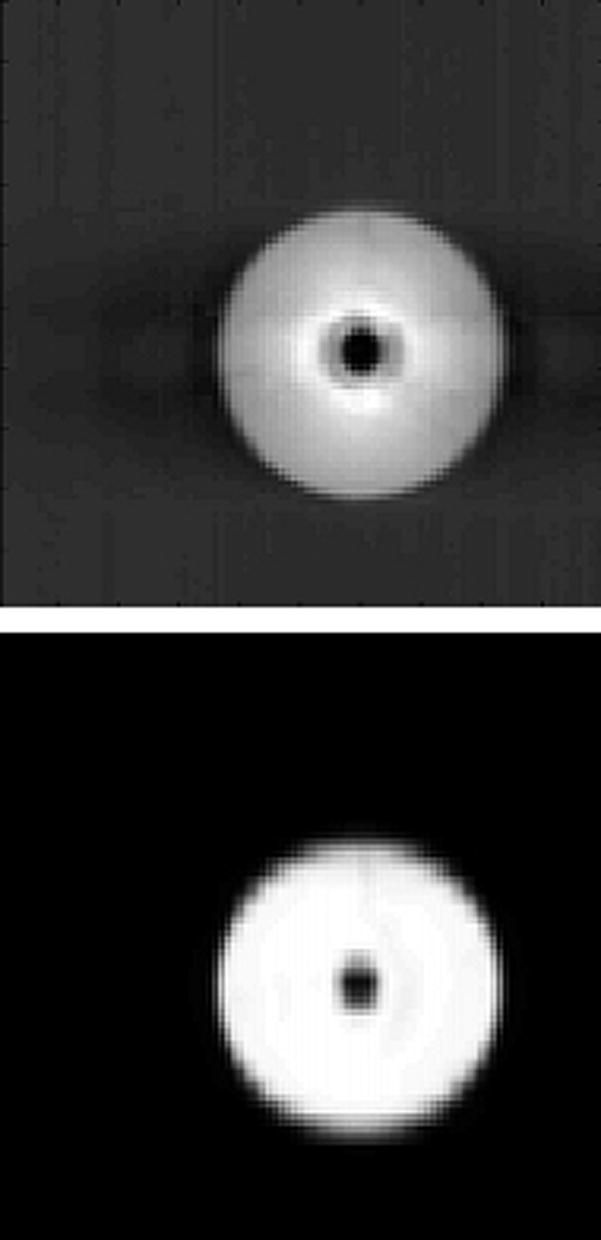
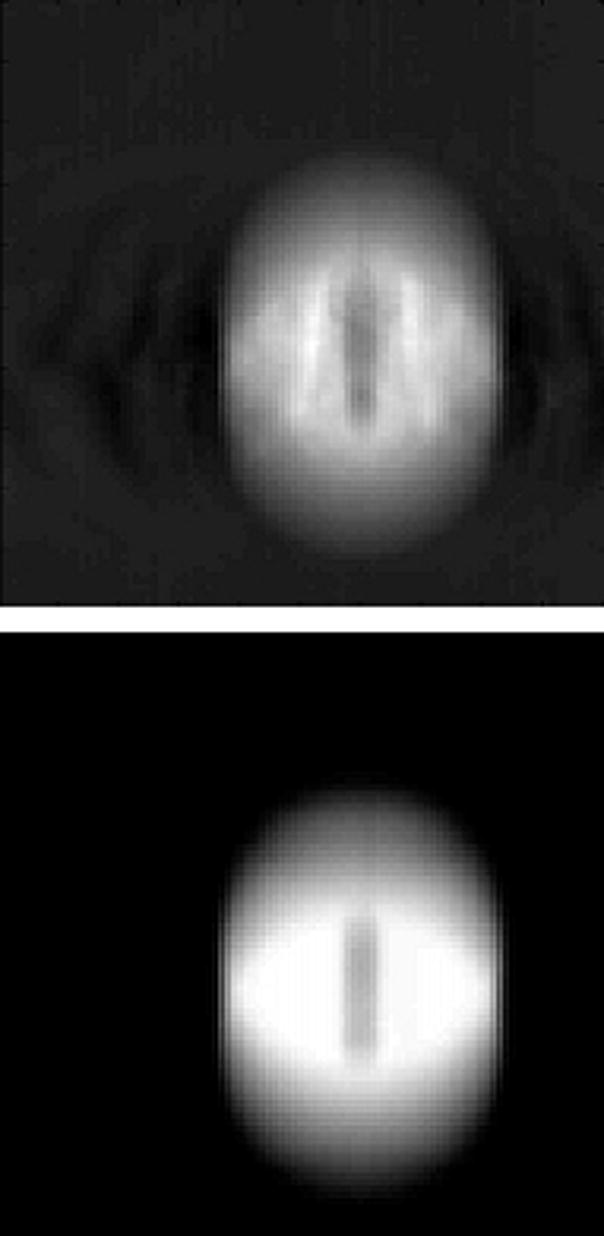
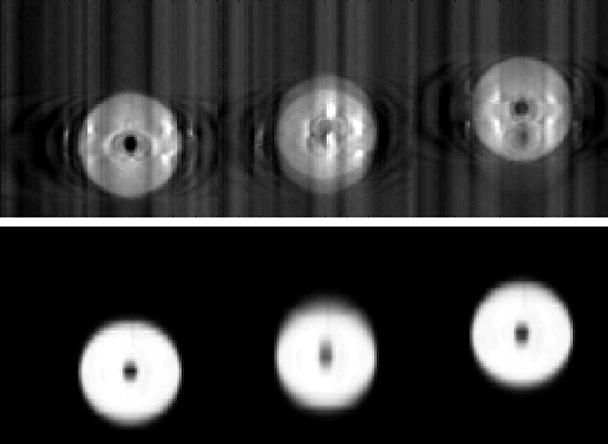
Coronal sections from the CT images of the sphere. In the figure, the top image is from the CBCT and the bottom is from the reference (diagnostic) CT. (A) Stationary phantom. (B) Phantom moving with 2 cm amplitude: the top image is the FB-CBCT, the bottom image is the AVG-CT. (C) Phantom moving with 2 cm amplitude: the top image is the RC-CBCT, 3 selected phases, the bottom image is the RCCT, corresponding 3 phases.
The actual shift of the stationary sphere from the planned position was −0.86 cm laterally, −0.98 cm longitudinally, and 0.95 cm vertically (positive is towards the right when facing the gantry, towards the gantry longitudinally, and towards the ceiling). The difference (from this nominal measurement) in the shift as measured by the AVG-CT and RCCT methods is listed in Table 1. For the AVG-CT method, the maximum error in detecting the mean position was less than 0.1 cm, with 95% confidence of detecting the mean position within 0.09 cm. For the RCCT method, the mean position was calculated in two ways. For both, Equation (2) was used to calculate the shift in the mean position. For the ‘Measured’ data of Table 1, both T̄p and T̄cbct were calculated directly using Equation (1). For the ‘Interpolated’ column, the translation vector data were fit to a curve using cubic interpolation, and the mean positions T̄p and T̄cbct were calculated from this interpolated data. Interpolating or using the measurements directly made little difference in calculating the mean position. The 95% confidence value of detecting the mean position with the RCCT method was 0.15 cm.
Table 1.
Difference in the measured shift from the nominal measured shift. (RC-CBCT = respiration-correlated cone beam CT, FB-CBCT = free-breathing cone beam CT, SD = standard deviation)
| Motion | Axis | RC-CBCT Interpolated (cm) | RC-CBCT Measured (cm) | FB-CBCT (cm) |
|---|---|---|---|---|
| 1cm | Lateral | 0.00 | 0.01 | 0.04 |
| Vertical | −0.13 | −0.13 | 0.02 | |
| Longitudinal | 0.03 | 0.03 | 0.04 | |
| 2cm | Lateral | 0.04 | 0.03 | 0.04 |
| Vertical | −0.12 | −0.12 | 0.00 | |
| Longitudinal | −0.09 | −0.09 | 0.02 | |
| 3cm | Lateral | −0.03 | −0.03 | 0.05 |
| Vertical | 0.00 | −0.01 | 0.00 | |
| Longitudinal | 0.04 | 0.04 | −0.09 | |
| Mean Absolute Error | 0.06 | 0.05 | 0.03 | |
| SD Absolute Error | 0.05 | 0.05 | 0.03 | |
| 95% Confidence | 0.15 | 0.15 | 0.09 | |
The error in detecting the shift in the mean position was similar for all three motion magnitudes from 1 cm to 3 cm, even with the errors in measuring the motion curve as evident in figure 1. Figure 3 shows profiles of voxel intensities from a static CT and CBCT along the CC axis through the center of the sphere. For the stationary sphere (Fig. 3a), the images of the sphere from the static CT and CBCT differ, however, registration matched the edges of the object well. Figure 3b shows the profile (from the AVG-CT) of the sphere blurred due to motion. While the blurred AVG-CT profile does not exactly match the FB-CBCT profile in the same figure, registration matches the blurred edges of the object correctly. In Figure 3c, the AVG-CT was captured with a 2 cm motion magnitude and the FB-CBCT with a 3 cm motion magnitude. The sphere profiles have different gradients due to the different motion magnitudes, but gray value registration enabled an accurate match of the mean position of the sphere in these different images.
Figure 3.
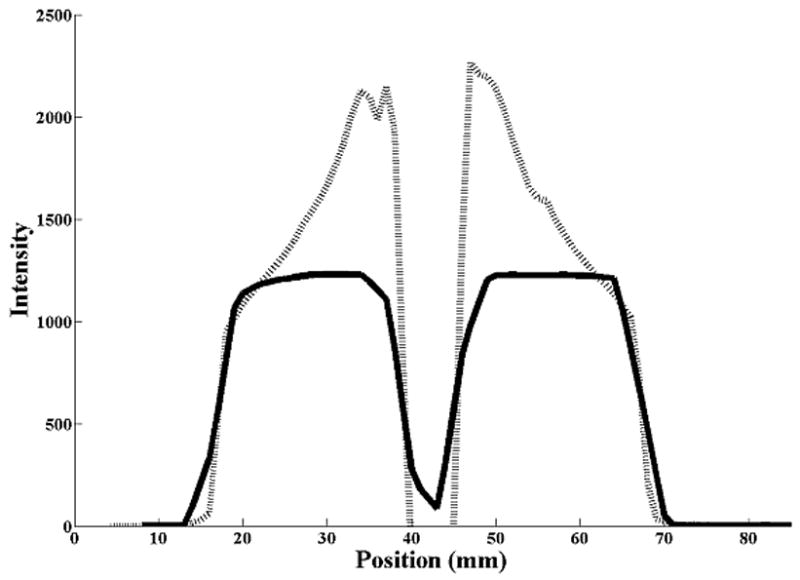
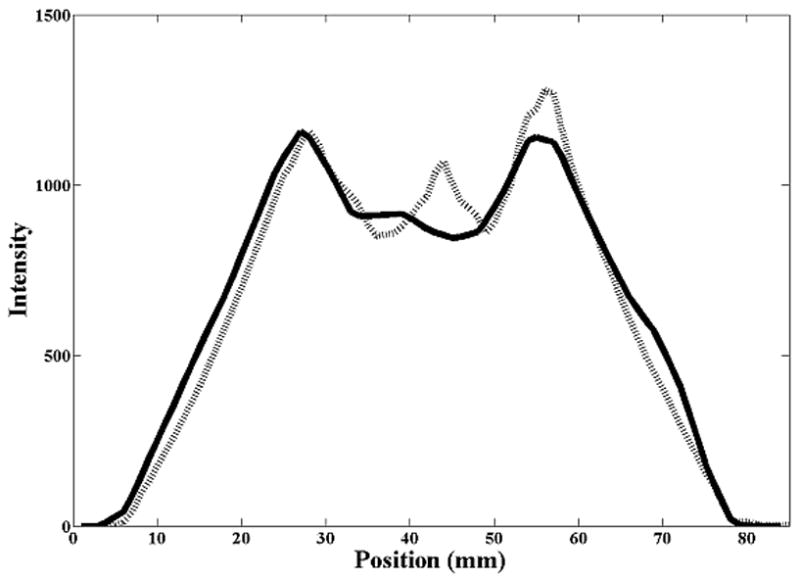
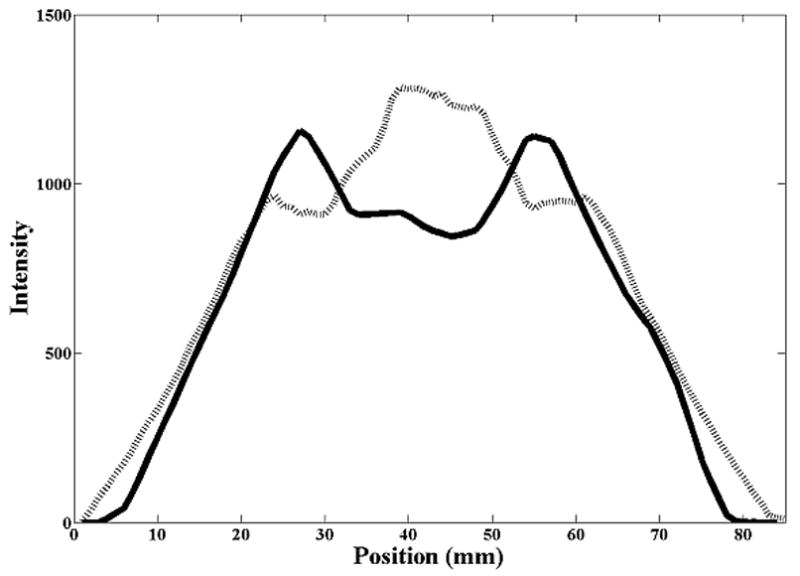
Cranio-caudal intensity profiles through the center of the rubber sphere, after registration of the image sets. The solid line is from the reference (diagnostic) CT, the dashed line from the CBCT. (A) Stationary phantom. (B) Phantom moving with 2 cm amplitude: solid line profile is from the AVG-CT, dashed line profile from the FB-CBCT. (C) Phantom moving with 3 cm amplitude: solid line profile is from the AVG-CT, dashed line profile from the FB-CBCT.
Patient Studies
The mean tumor excursion for the eight subjects was 0.27 cm (LR), 0.50 cm (AP), and 1.07 cm (CC), as measured from RCCT. Individual measurements are reported in Table 2. Table 2 also lists the range of the excursion estimated from the RC-CBCT scans. Thirty-three total CBCT scans in eight patients were performed and analyzed. The number of CBCT sessions per patient varied between one and seven for several reasons, including treatment course length (a maximum of one RC-CBCT session was allowed per week), treatment interruption, and repairs to the CBCT equipment.
Table 2.
Tumor excursion from RCCT and RC-CBCTs for the study population. Tumor excursion was measured as the difference in centroid position between the end inhalation and end exhalation phase images. (LR = left to right direction, AP = anterior-posterior direction, CC = cranio-caudal direction, CBCT = cone beam CT, RCCT = planning respiration-correlated CT, RC-CBCT = respiration-correlated cone beam CT).
| Tumor Excursion, RCCT | Tumor Excursion Range, RC-CBCTs | ||||||
|---|---|---|---|---|---|---|---|
| Subject | LR (cm) | AP (cm) | CC (cm) | Number of CBCTs | LR (cm) | AP (cm) | CC (cm) |
| 1 | 0.15 | 0.20 | 0.39 | 3 | 0.10–0.20 | 0.10–0.20 | 0.20–0.30 |
| 2 | 0.08 | 0.30 | 0.61 | 3 | 0.15–0.18 | 0.30–0.52 | 0.80–0.98 |
| 3 | 0.31 | 0.45 | 0.99 | 3 | 0.07–0.14 | 0.41–0.50 | 0.61–0.83 |
| 4 | 0.37 | 0.22 | 0.80 | 1 | 0.55–0.55 | 0.38–0.38 | 0.72–0.72 |
| 5 | 0.16 | 0.18 | 0.88 | 7 | 0.08–0.32 | 0.10–0.30 | 1.07–1.37 |
| 6 | 0.34 | 0.72 | 1.84 | 7 | 0.15–0.44 | 0.14–0.88 | 0.94–1.89 |
| 7 | 0.37 | 1.44 | 1.15 | 5 | 0.14–0.57 | 0.71–1.35 | 1.01–1.30 |
| 8 | 0.34 | 0.45 | 1.88 | 4 | 0.07–0.66 | 0.40–0.58 | 1.20–1.83 |
| Mean | 0.27 | 0.50 | 1.07 | ||||
Figure 4 shows the AP-CC tumor trajectory for Subject 6 from the RCCT acquired during planning and the RC-CBCT during the sixth week of treatment. The tumor trajectory has changed from planning to treatment, with the mobility of the tumor having decreased. The mean position has shifted in the AP direction by 0.7 cm, and by 0.1 cm in the CC direction.
Figure 4.
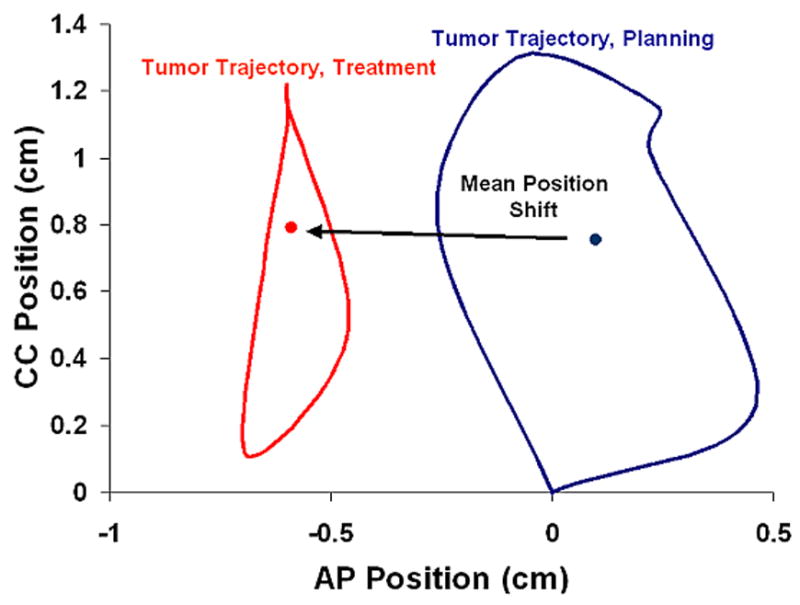
AP-CC tumor trajectory during planning (RCCT) and treatment week six (RC-CBCT). The mean tumor position is the represented by the dot for each RCCT.
Figure 5 shows the correlation between the mean position shift as measured by the AVG-CT and RCCT methods. The slope of the linear fit (ideally equal to 1) was 0.96, 0.97, and 0.97 in the LR, AP, and CC directions, respectively. The correlation between the mean position as measured by the RCCT and AVG-CT methods was very high, with a Pearson correlation coefficient of 0.96 in the LR direction, and 0.99 in the AP and CC directions. The mean absolute difference (one standard deviation in parentheses) in the mean position shift as measured by both methods was 0.13 cm (0.08 cm) in the LR direction, 0.14 cm (0.10 cm) in the AP direction, and 0.10 cm (0.07 cm) in the CC direction. The 95% confidence value in measuring the mean position shift between methods was 0.26 cm (LR), 0.33 cm (AP), and 0.24 cm (CC).
Figure 5.
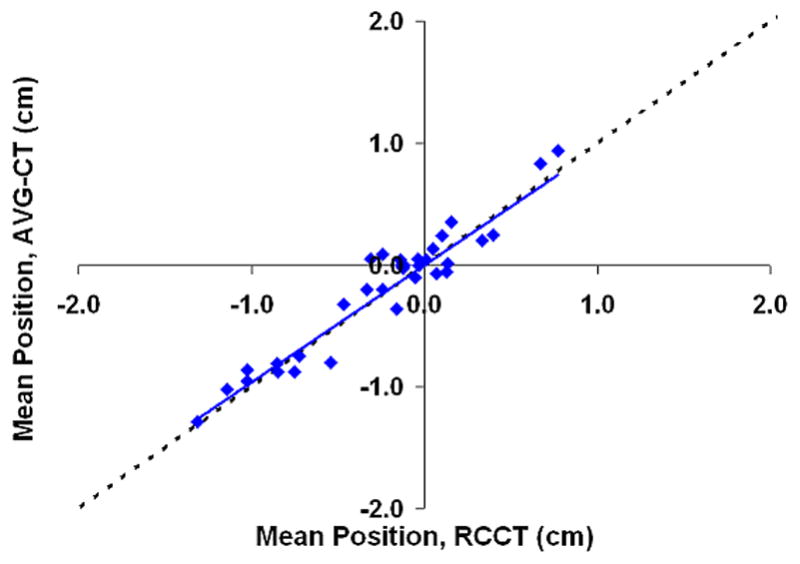
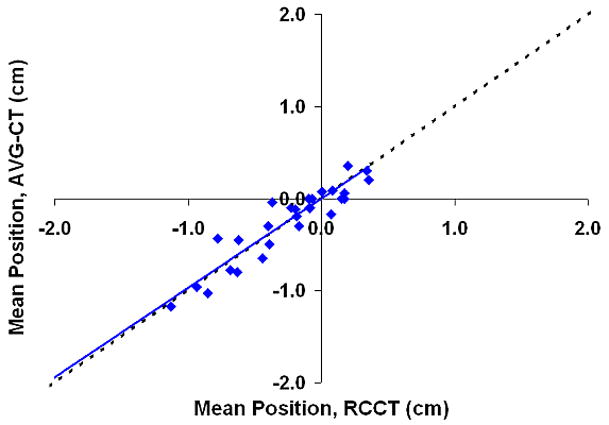
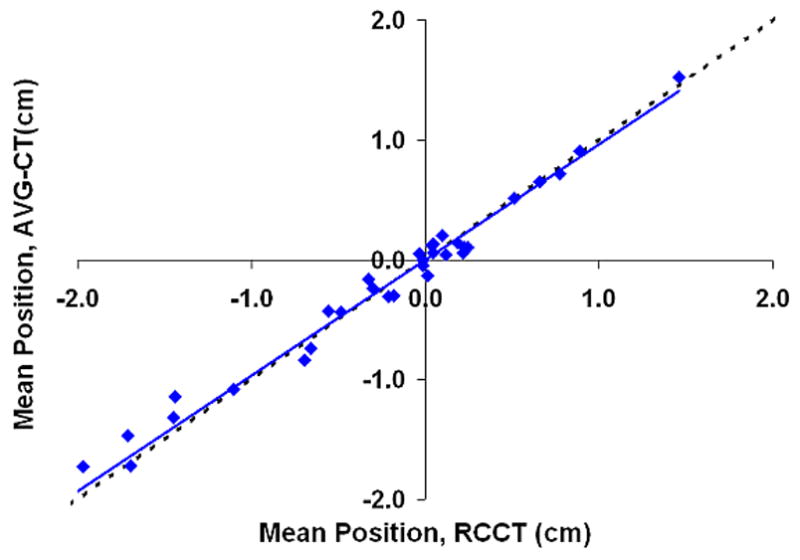
Shift in the mean tumor position in relation to the planned mean position, eight patients, measurements using the AVG-CT method vs. measurements using the RCCT method. The dashed line represents exact one-to-one correlation. The solid line is the linear fit of the data. (A) Lateral direction. (B) Anterio-posterior direction. (C) Cranio-caudal direction.
The large negative shifts from the planned position in the AP and CC direction evident in Figures 5b and 5c are primarily due to a single patient, Subject 6. This patient demonstrated very large (2–3 cm) shifts in the mean tumor position during treatment in relation to the planned position. The shifts were not mainly related to bony setup error, as bony alignment of this patient demonstrated errors less than 5 mm; the major effect was a shift in the tumor position in the lung, relative to the bony anatomy. The mean difference in detecting the tumor position shift between the RCCT and AVG-CT methods was similar for this patient and the value reported for study population above.
Discussion
Respiration degrades image quality and induces artifact that can inhibit accurate localization of the target during treatment. Two methods have been presented in this study to enable online target localization in the presence of respiration. The first consisted of creating respiration-correlated CTs from both the reference and online treatment scans, and registering the individual phase images to accurately measure the shift in the mean tumor position from planning to treatment. This method affords the ability to quantify some measure of the respiration pattern (excursion, standard deviation of the motion, etc.). Such metrics allow for the evaluation of the usefulness of the original treatment plan, if respiration was included in the planning procedure. The frequency of such evaluation has not been well studied to date. In two previous studies (8; 14), we found that the variability of the respiratory pattern was not so large that the dose distribution is affected greatly. Results from other studies generally agree. Bosmans et al. (15) found that while the tumor volume changes greatly throughout the course of treatment, the motion pattern was relatively stable. Britton et al. observed a small increase in tumor mobility as treatment progressed (16), while Plathow et al. reported on a significant decrease in tumor mobility two to three months post-treatment for lower lobe tumors (17).
A major issue with the RCCT method of online localization is relatively poor image quality of RC-CBCT. RC-CBCT requires a prolonged scan time to achieve appropriate angular sampling with multiple phase image reconstruction. The more phases required, the slower the scan speed should be, for a single-rotation scan. In order to keep the patient dose low from this procedure, we limited the number of reconstructed phase images to six per scan. Still, the phase image quality was relatively poor due to angular sampling artifacts in the filtered backprojection reconstruction.
The second method of target localization, the AVG-CT method, consisted of registering an AVG-CT scan to a free-breathing CBCT scan. This method was found here to be simple and accurate in relation to the RCCT method. Phantom studies demonstrated that an AVG-CT and FB-CBCT could be accurately aligned, even if the motion artifact in both images was not the same due to a change in the motion pattern. Several differences between the AVG-CT and FB-CBCT exist. Images of the stationary sphere demonstrate the disparity in image quality between fan beam imaging on a CT simulator and onboard cone beam imaging for radiotherapy localization. These image quality issues in CBCT due to scatter in the projection images and cone beam artifact have been presented in detail by others (18; 19). However, the difference in the slow scanning technique for a CT simulator and a CBCT scanner also may introduce some variability. Smeenk demonstrated that the gantry rotation speed effects motion artifact in ‘slow’ CT scanning (20). In the current study, the RCCT was produced by scanning with a gantry rotation speed of 0.5s per revolution and a patient-dependent pitch of around 0.2, while the CBCT was acquired with a gantry rotation speed of 3.6 minutes per revolution. Still, the difference in artifact between the scanning techniques was small enough that the images could be accurately registered to within 1mm.
The AVG-CT method, in contrast to the RCCT method, was implemented in our clinic with commercially-available software. The AVG-CT image was generated and transferred to the treatment planning system using an available clinical function of the Philips CT simulation package. FB-CBCT acquisition and registration were also accomplished on clinical systems. The AVG-CT method thus poses the advantage of ease of implementation immediately in the community. Additionally, the AVG-CT method required a single registration, while the RCCT method required 15 registrations (9 phase registrations to the reference phase of the RCCT, 5 phase registrations to the reference phase of the RC-CBCT, 1 registration of the reference phase of RCCT to the reference phase of the RC-CBCT). The AVG-CT method will also reduce the time required for localization compared to the RCCT method, which becomes paramount for protocols such as radiosurgery or hypofractionated radiotherapy in the thorax.
One concern with the AVG-CT method is the accuracy if the target is adjacent to a boundary (such as the chest wall, diaphragm, or mediastinum). In such a case the blurring effect of respiration may obscure the tumor boundary and prevent accurate registration. Subjects 6 and 7 had tumors near the chest wall and Subject 8’s tumor was located adjacent to the diaphragm. For none of these cases was the accuracy of the AVG-CT method worse than the RCCT method, compared to the other subjects. However, tumors attached to the mediastinum or hilum were not studied here.
Use of the AVG-CT method for target localization does not necessarily require the use of an AVG-CT for dose calculation and structure delineation. For example, if a RCCT is acquired, the mid-ventilation planning method of Wolthaus could be used for structure delineation and dose calculation. The AVG-CT could be generated and registered to the mid-ventilation image in the treatment planning system (in fact, if both were generated from the same RCCT, the images would be self-registered by definition). If the transformation between the planning CT and AVG-CT is known, enabling transfer of the isocenter coordinates to the AVG-CT, the planning CT does not need to be used as the reference image for target localization.
Conclusions
Two strategies for online volumetric target localization in the presence of respiration were compared in phantom and in a patient subpopulation. The methods were found equivalent in localizing the mean position of the target in the respiration cycle. The RCCT method provides the advantage of allowing for the measurement of changes in the respiratory pattern during the treatment course. The AVG-CT method is faster and simpler, and can be implemented with standard clinic equipment and software.
Acknowledgments
Supported in part by NCI Grant-R01 CA091020.
Footnotes
Presented at the 48th Annual Meeting of the American Society for Therapeutic Radiology and Oncology, Philadelphia, Pennsylvania, November, 2006
Conflict of Interest
William Beaumont Hospital holds a research agreement with Elekta Oncology Systems.
Publisher's Disclaimer: This is a PDF file of an unedited manuscript that has been accepted for publication. As a service to our customers we are providing this early version of the manuscript. The manuscript will undergo copyediting, typesetting, and review of the resulting proof before it is published in its final citable form. Please note that during the production process errors may be discovered which could affect the content, and all legal disclaimers that apply to the journal pertain.
Reference List
- 1.Ohara K, Okumura T, Akisada M, et al. Irradiation synchronized with respiration gate. Int J Radiat Oncol Biol Phys. 1989;17(4):853–857. doi: 10.1016/0360-3016(89)90078-3. [DOI] [PubMed] [Google Scholar]
- 2.Shimizu S, Shirato H, Ogura S, et al. Detection of lung tumor movement in real-time tumor-tracking radiotherapy. Int J Radiat Oncol Biol Phys. 2001;51(2):304–310. doi: 10.1016/s0360-3016(01)01641-8. [DOI] [PubMed] [Google Scholar]
- 3.Wong JW, Sharpe MB, Jaffray DA, et al. The use of active breathing control (ABC) to reduce margin for breathing motion. Int J Radiat Oncol Biol Phys. 1999;44(4):911–919. doi: 10.1016/s0360-3016(99)00056-5. [DOI] [PubMed] [Google Scholar]
- 4.Balter JM, Ten Haken RK, Lawrence TS, et al. Uncertainties in CT-based radiation therapy treatment planning associated with patient breathing. Int J Radiat Oncol Biol Phys. 1996;36(1):167–174. doi: 10.1016/s0360-3016(96)00275-1. [DOI] [PubMed] [Google Scholar]
- 5.Chen GT, Kung JH, Beaudette KP. Artifacts in computed tomography scanning of moving objects. Semin Radiat Oncol. 2004;14(1):19–26. doi: 10.1053/j.semradonc.2003.10.004. [DOI] [PubMed] [Google Scholar]
- 6.van Herk M, Witte M, van der Geer J, et al. Biologic and physical fractionation effects of random geometric errors. Int J Radiat Oncol Biol Phys. 2003;57(5):1460–1471. doi: 10.1016/j.ijrobp.2003.08.026. [DOI] [PubMed] [Google Scholar]
- 7.Engelsman M, Sharp GC, Bortfeld T, et al. How much margin reduction is possible through gating or breath hold? Phys Med Biol. 2005;50(3):477–490. doi: 10.1088/0031-9155/50/3/006. [DOI] [PubMed] [Google Scholar]
- 8.Hugo GD, Yan D, Liang J. Population and patient-specific target margins for 4D adaptive radiotherapy to account for intra- and inter-fraction variation in lung tumour position. Phys Med Biol. 2007;52(1):257–274. doi: 10.1088/0031-9155/52/1/017. [DOI] [PubMed] [Google Scholar]
- 9.Wolthaus JW, Schneider C, Sonke JJ, et al. Mid-ventilation CT scan construction from four-dimensional respiration-correlated CT scans for radiotherapy planning of lung cancer patients. Int J Radiat Oncol Biol Phys. 2006;65(5):1560–1571. doi: 10.1016/j.ijrobp.2006.04.031. [DOI] [PubMed] [Google Scholar]
- 10.Lagerwaard FJ, van Sornsen de Koste JR, Nijssen-Visser MR, et al. Multiple “slow” CT scans for incorporating lung tumor mobility in radiotherapy planning. Int J Radiat Oncol Biol Phys. 2001;51(4):932–937. doi: 10.1016/s0360-3016(01)01716-3. [DOI] [PubMed] [Google Scholar]
- 11.Keall PJ, Starkschall G, Shukla H, et al. Acquiring 4D thoracic CT scans using a multislice helical method. Phys Med Biol. 2004;49(10):2053–2067. doi: 10.1088/0031-9155/49/10/015. [DOI] [PubMed] [Google Scholar]
- 12.Sonke J, Remeijer P, van Herk M. Respiratory-Correlated Cone Beam CT: Obtaining a Four-Dimensional Data Set. Med Phys. 2003;30(6):1415. doi: 10.1118/1.1869074. [DOI] [PubMed] [Google Scholar]
- 13.Roche A, Malandain G, Pennec X, et al. The correlation ratio as a new similarity measure for multimodal image registration. Proceedings of MICCAI’98. Lecture Notes in Computer Science. 1998;1496:1115–1124. [Google Scholar]
- 14.Hugo G, Vargas C, Liang J, et al. Changes in the respiratory pattern during radiotherapy for cancer in the lung. Radiother Oncol. 2006;78(3):326–331. doi: 10.1016/j.radonc.2006.02.015. [DOI] [PubMed] [Google Scholar]
- 15.Bosmans G, van BA, Dekker A, et al. Intra-patient variability of tumor volume and tumor motion during conventionally fractionated radiotherapy for locally advanced non-small-cell lung cancer: a prospective clinical study. Int J Radiat Oncol Biol Phys. 2006;66(3):748–753. doi: 10.1016/j.ijrobp.2006.05.022. [DOI] [PubMed] [Google Scholar]
- 16.Britton KR, Starkschall G, Tucker SL, et al. Assessment of gross tumor volume regression and motion changes during radiotherapy for non-small-cell lung cancer as measured by four-dimensional computed tomography. Int J Radiat Oncol Biol Phys. 2007 doi: 10.1016/j.ijrobp.2007.01.021. [DOI] [PubMed] [Google Scholar]
- 17.Plathow C, Hof H, Kuhn S, et al. Therapy monitoring using dynamic MRI: Analysis of lung motion and intrathoracic tumor mobility before and after radiotherapy. Eur Radiol. 2006;16(9):1942–1950. doi: 10.1007/s00330-006-0237-y. [DOI] [PubMed] [Google Scholar]
- 18.Letourneau D, Wong JW, Oldham M, et al. Cone-beam-CT guided radiation therapy: technical implementation. Radiother Oncol. 2005;75(3):279–286. doi: 10.1016/j.radonc.2005.03.001. [DOI] [PubMed] [Google Scholar]
- 19.Siewerdsen JH, Jaffray DA. Cone-beam computed tomography with a flat-panel imager: magnitude and effects of x-ray scatter. Med Phys. 2001;28(2):220–231. doi: 10.1118/1.1339879. [DOI] [PubMed] [Google Scholar]
- 20.Smeenk C, Gaede S, Battista JJ. Delineation of moving targets with slow MVCT scans: implications for adaptive non-gated lung tomotherapy. Phys Med Biol. 2007;52(4):1119–1134. doi: 10.1088/0031-9155/52/4/017. [DOI] [PubMed] [Google Scholar]


