

Abstract
Cytochromes P450 (CYP) are down regulated in hepatocytes in response to inflammation and infection. This effect has been extensively studied in animal models but significantly less is known about responses in humans and even less about responses in the absence of inducing agents. This paper focuses on the effects of bacterial lipopolysaccaride (LPS), interleukin-6 (IL-6), tumor necrosis factor α (TNF), interferon γ (IFN), transforming growth factor β (TGF) and interleukin-1 β (IL-1) on expression of CYP2B6 and the CYP2C mRNAs in human hepatocytes. These effects were compared to responses of the better-studied and more abundant CYP3A4. CYP3A4 and 2C8 were down regulated by all cytokine treatments. CYP2C18, which is expressed at very low levels in liver, was unaffected by cytokine treatments. The other CYP2Cs and CYP2B6 showed cytokine-specific effects. CYP2C9 and 19 showed almost identical response patterns, being down regulated by IL-6 and TGF but not significantly affected by LPS, TNF, IFN, or IL-1. CYP2B6 mRNA responded only to IL-6 and IFN. IL-6 down-regulated the mRNAs of all CYPs studied. Western blot analysis of CYP protein expression supported the mRNA data to a large extent, although some inconsistencies were observed. Our results show that human CYP2C8, 2C9, 2C18, 2C19, 2B6 and 3A4 responses to inflammation are independently regulated, and indicate that this fine control may have a critical effect on human drug responses in disease states.
The liver responds to inflammation and infection by increasing levels of acute phase proteins and concurrently down-regulates liver specific proteins involved in drug metabolism (Morgan, 1997; Renton, 2004; Aitken et al., 2006). Cytochromes P450 (CYPs) are the major drug metabolizing enzymes in the liver and are significantly down-regulated by infection and inflammatory stimuli (Morgan, 1997; Aitken et al., 2006). The rapid down-regulation of CYP mRNAs (Morgan, 1997) has led to a focus on transcription as the primary mechanism of these effects, and this view is supported by the size and speed of transcriptional down-regulation as demonstrated in rats in vivo (Cheng et al., 2003). In humans, this down-regulation is associated with decreased drug clearance (Kraemer et al., 1982; Rivory et al., 2002; Carcillo et al., 2003; Renton, 2004) and can result in increased incidence of drug toxicity (Kraemer et al., 1982).
Three lines of evidence support a major role of inflammatory cytokines as the mediators of CYP regulation in the liver during inflammation. Firstly, cytokines can down-regulate CYP expression in cultures of rodent and human hepatocytes (Abdel-Razzak et al., 1993; Morgan, 1997; Sunman et al., 2004; Aitken et al., 2006). Secondly, mice with null mutations in cytokine or cytokine receptor genes display diminished CYP down-regulation in response to some inflammatory stimuli (Siewert et al., 2000; Ashino et al., 2004). Thirdly, CYP-dependent drug clearance has been correlated inversely with plasma interleukin-6 (IL-6) in tumor patients (Rivory et al., 2002) and in congestive heart failure patients (Frye et al., 2002).
Studies of CYP regulation in human hepatocytes have confirmed that inflammatory cytokines regulate human CYP gene expression, and that the effects of individual cytokines can be CYP gene-specific (Abdel-Razzak et al., 1993; Abdel-Razzak et al., 1994; Abdel-Razzak et al., 1995; Muntane-Relat et al., 1995; Donato et al., 1997; Morgan, 1997; Donato et al., 1998; Guillen et al., 1998; Sunman et al., 2004; Aitken et al., 2006). Many of these studies have focused on cytokine regulation of drug-induced CYP expression (Abdel-Razzak et al., 1994; Abdel-Razzak et al., 1995; Muntane-Relat et al., 1995; Guillen et al., 1998; Sunman et al., 2004). However, as discussed in a recent review (Aitken et al., 2006), regulation of constitutive CYP expression by cytokines is likely to be independent of nuclear receptors such as CAR and PXR, which play such a critical role in inflammatory down-regulation of inducible CYP expression.
There is very little information about the regulation of the constitutive expression of human hepatic CYPs in general, and of CYP2B6 and the CYP2C subfamily in particular, by cytokines. Only one study focused on human CYP2C responses to inflammation in the absence of chemical inducers. However, the CYP2C subfamily members were not distinguished, and the effect was only seen after a 72 h incubation. (Abdel-Razzak et al., 1993). Two studies reported that CYP2B6-dependent catalytic activity was decreased after incubation of hepatocytes with interferon γ (IFN) or hepatocyte growth factor, but RNA or protein expression were not studied (Donato et al., 1997; Donato et al., 1998). The CYP2Cs and CYP2B6 each have significant roles in drug metabolism (Goldstein and de Morais, 1994; Shimada et al., 1994; Totah and Rettie, 2005). Therefore there is a need to understand how they are regulated by inflammatory cytokines, in order to recognize and predict the effects of different diseases, with different cytokine profiles and time courses, on drug clearance. We hypothesized that constitutive expression of human CYP2C subfamily members and CYP2B6 would be differentially regulated by cytokines in primary human hepatocyte cultures, and that this regulation would be different from that of the well-studied CYP3A4, which is responsible for the metabolism of more than 50% of currently available drugs (Schuetz, 2004).
In this study, we characterized the regulation of CYPs 2B6, 2C8, 2C9, 2C18, 2C19 and 3A4 by agents associated with inflammatory responses that were previously shown to regulate CYPs in primary rodent hepatocytes: interleukin-1β (IL-1), IL-6, tumor necrosis factor α (TNF), IFN, transforming growth factor-β (TGF) and bacterial lipopolysaccharide (LPS). As discussed above, both rodent and human studies to date indicate that pretranslational mechanisms are the primary cause of decreased CYP enzyme expression and activity. For this reason and because of the limited availability of human hepatocytes, we focused on the regulation of CYP mRNAs. Our results support our hypothesis that these important drug-metabolizing enzymes show differential responses to cytokines, indicating that the influence of inflammation on human drug metabolism is likely to be disease- and drug-specific.
METHODS
Reagents
All reagents were purchased from Sigma-Aldrich (St Louis, MO) unless otherwise stated. IL-6 was from Calbiochem (EMD Biosciences, San Diego, CA), TNF and TGF were from Invitrogen (Carlsbad, CA), and IFN was from BD Pharmagen (San Diego, CA). All cytokines were reconstituted and stored according to manufacturer specifications as high concentration stocks. Antibodies were purchased to CYP3A4, CYP2C9 (Xenotech, Lenexa, KA), CYP2B6 (Gentest, BD biosciences, Discovery Labwear, Bedford, MA) and glyceraldehyde 3-phosphate dehydrogenase (GAPDH) (EnCor Biotech, Alachua, FL). Supersomes (microsomes of insect cells expressing CYP enzymes) were from Gentest.
Human Hepatocyte Cultures
These studies were carried out in accordance with the Declaration of Helsinki, and were designated exempt from review by the Emory University Institutional Review Board. Human hepatocytes were received from Dr Steven Strom at the University of Pittsburgh via the NIH-sponsored Liver Tissue Procurement and Distribution System program. They were prepared within 24 h of procurement from livers not suitable for transplantation. Details on liver donors are provided in Table 1. Hepatocytes were isolated as described in Strom et al. (Strom et al., 1996) by a three-step collagenase perfusion technique and plated on collagen coated 12 well plates (10 × 106 cells per plate) or T25 flasks (3 × 10⁶ cells per flask). Cells were cultured for 48 h prior to delivery in hepatocyte maintenance media (HMM) (Cambrex Bioscience Walkersville Inc.). Upon receipt, media were changed to Williams E cell culture media supplemented with 150 nM insulin, 3 nM dexamethasone and 100 Units/ml penicillin/streptomycin. Cells were incubated for a further 24-48 h. Cells were maintained at 37 °C in 5% CO2 throughout the experiment with the exception of the shipping period. All cells were cultured for a minimum of 72 h between isolation and treatment. Media were changed every 24 h.
Table 1.
Donor Information
| Cell ID | Sex | Age | Race | Cause of Death |
|---|---|---|---|---|
| 1200 | F | 53 | Caucasian | Cerebrovascular accident |
| 1205 | M | 45 | Hispanic | Cerebrovascular accident |
| 1261 | M | 21 months | Caucasian | Cerebrovascular accident |
| 1274 | F | 55 | Black | Anoxia due to cardiac arrest |
| 1280 | F | 36 | Caucasian | Anoxia due to cardiac arrest |
| 1281 | M | 16 | Caucasian | Head Trauma |
| 1294 | M | 14 | Caucasian | Anoxia |
| 1315 | F | 84 | Caucasian | Unknown |
| 1318 | M | 15 months | Caucasian | Unknown |
Treatments
Cytokines were diluted from stock solutions into media just prior to treatment. Final concentrations of IL-6, TNF, IFNγ and TGF were 10ng/mL and of IL-1 was 5 ng/mL. A stock solution of 1 mg/mL LPS was prepared in phosphate buffered saline (PBS) and diluted to a final concentration of 10 μg/mL. PBS was added to equalize the final volume of diluent in all cultures. Control cells were treated with media plus an appropriate volume of PBS. Hepatocytes were harvested 24 h after initiation of treatment, unless otherwise indicated. The cytokine concentrations used were based on maximal effects measured in our laboratory for CYP2C11 in rat hepatocytes.
Preparation of Cell Lysates and RNA
Media were removed from T25 flasks or 12 well plates and cells were washed twice in ice cold PBS. For preparation of cell lysates, flasks were scraped to release cells into PBS and the cells were pelleted, resuspended in 200 μL of cell lysis buffer (50 mM Tris pH 7.4, 0.1% SDS, 0.5% NP40, 1% EDTA), and sonicated for 10-12 seconds with a Microson ultrasonic cell disruptor on power setting 15. A protease inhibitor cocktail containing 4-(2-aminoethyl) benzenesulfonyl fluoride, pepstatinA, E-64, bestatin, leupeptin, and aprotinin were added, and lysates were stored at -80°C. Protein levels were measured using the BSA assay from Pierce Biotechnology (Rockford, IL). Total RNA was prepared from 12-well plates using Trizol (Invitrogen, Carlsbad, CA) according to the manufacturers directions. RNA concentrations and quality were determined spectrophotometrically by measuring absorbance at 260nm and 260/280nm ratio.
Real Time Reverse Transcriptase- PCR (RT-PCR)
Purified total RNA was reverse transcribed using the Superscript first strand synthesis system for RT-PCR kit (Invitrogen) according to the manufacturer’s instructions. Primers for the human CYPs studied are listed in Table 2. Where possible, published primer pairs were utilized including those for CYP2B6, CYP3A4 and CYP2C19 from (Rodriguez-Antona et al., 2000); and CYP2C18 (Nishimura et al., 2002). Primers for GAPDH, CYP2C8 and CYP2C9 were designed using the Primer Select software program (DNASTAR, Inc., Madison, WI). All primers were subjected to BLASTn analysis to exclude any oligonucleotides with high similarity to other human P450 mRNA transcripts
Table 2.
RT-PCR Primer List
| CYP | RT-PCR Primer | Annealing Temp. (°C) | Product Size (base pairs) | Reference |
|---|---|---|---|---|
| 2C8 | Fwd tgt ggt cct ggt gct gtg
Rvd ata ttg ggg aat tgc ctc tt |
53 | 296 | |
| 2C9 | Fwd aca gct aaa gct cag gaa gag att gaa cg
Rvd gca ggc tgg tgg gga gaa ggt c |
58 | 142 | |
| 2C18 | Fwd agg ata ttg aca tca ccc cca
Rvd tca gac agg aat gaa gca gag ct |
53 | 79 | (Nishimura et al., 2002) |
| 2C19 | Fwd aca gat agt gaa att tgg ac
Rvd ttc atg cct ttc tca gca gg |
58 | 277 | (Rodriguez-Antona et al., 2000) |
| 3A4 | Fwd cct tac aca tac aca ccc ttt gga agt
Rvd agc tca atg cat gta cag aat ccc cgg tta |
58 | 382 | (Rodriguez-Antona et al., 2000) |
| 2B6 | Fwd atg ggg cac tga aaa aga ctg a
Rvd aga ggc ggg gac act gaa tga c |
58 | 283 | (Rodriguez-Antona et al., 2000) |
| GAPDH | Fwd gga cca cca gcc cca gca aga g
Rvd gag gag ggg aga ttc agt gtg gtg |
53-58 | 103 |
Real time RT-PCR analysis was carried out on ABI 7300 sequence detection system (Applied Biosystems, Foster City, CA) to quantify relative P450 mRNA expression in human hepatocytes. Reactions were carried out in a total volume of 25 μL using Sybr green master mix reagent (Applied Biosystems, Foster City, CA), 2 μl of template cDNA and 10 μM forward and reverse primers. All reactions were carried out in duplicate. Assay plates were incubated at 50 °C for 2 minutes, 95 °C for 10 minutes followed by 40 cycles of 95°C for 15 seconds plus 1 minute at the relevant annealing temperature (see Table 2 for details). Levels of the mRNA for the housekeeping gene GAPDH were monitored in parallel in order to normalize the total amount of cDNA in each sample. Results are expressed as relative levels of P450 mRNA and were normalized to control samples fixed at an arbitrary value of one. Livak and Schmittgen (Livak and Schmittgen, 2001) described the Ct method, which was used to calculate the amount of target P450 in a treated sample normalized to GAPDH and relative to the control P450 samples. A single PCR product of expected size was confirmed by agarose gel electrophoresis for each primer set, and the specificities of the CYP2C8, 2C9 and 2C19 primers were verified by sequencing the products. Specificity was also confirmed on a routine basis by checking product dissociation curves in each reaction well.
Western Blotting
SDS-PAGE and Western blotting were used to measure P450 protein levels. Equal amounts of cell lysate (10-25 μg) were loaded into each lane of a 5-15% gradient polyacrylamide gel (Criterion Tris-HCl gel, BioRad, Hercules, CA) for analysis and transferred onto a nitrocellulose membrane. Blots were probed with antibodies to CYP3A4, CYP2C9 and CYP 2B6. The CYP2C9 antibodies cross-reacted to a limited extent with CYP2C19; however CYP2C9 and 2C19 could be distinguished by their different mobilities on the gels, and the antibody detected only CYP2C9 in cell lysates under the conditions used (see Fig 2A). Blots were blocked according to the antibody manufacturers directions and incubated overnight at 4 °C with the respective primary antibodies diluted according to manufacturers specifications in PBS containing 0.05% Tween 20 (PBS-Tween). Nitrocellulose filters were then washed 3 times for 10mins in PBS-Tween at room temperature prior to the application of horseradish peroxidase coupled secondary antibody (Pierce, Rockford, IL) for 1 h at room temperature. The membranes were washed again 3 times for 10 min in PBS-Tween prior to visualization using an enhanced chemiluminescence detection system (Supersignal West Pico, Pierce Rockford, IL). The intensities of stained bands were measured by densitometry using Kodak Imaging Software 4.0.1, (Eastman Kodak, New Haven, CT).
Fig 2.
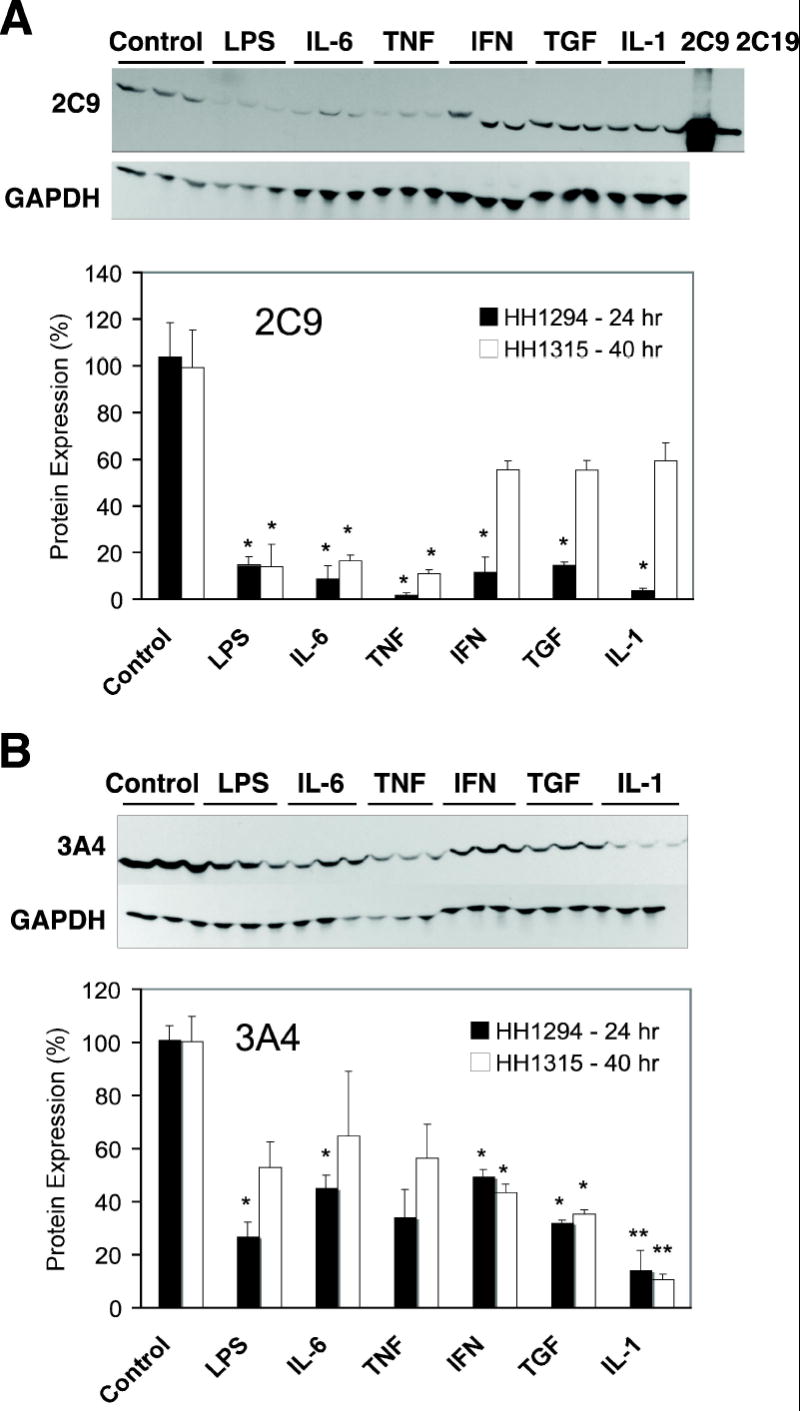
Regulation of human CYP 2C and 3A protein expression by cytokines. Cells from patient HH1294 or HH1315 were cultured in T25 flasks, and treated with phosphate-buffered saline (1 μl/ml, Control), lipopolysaccharide (LPS, 10 μg/ml), interleukin-6 (IL-6, 10ng/ml)), tumor necrosis factor-α (TNF, 10ng/ml)), interferon-γ (IFN, 10ng/ml)), tumor growth factor-β (TGF, 10ng/ml) or interleukin-1 (IL-1, 5ng/ml) for 24 or 40 hr, respectively. Cell lysates were prepared and Western blot assays for (A) CYP2C9 and (B) CYP3A4 were performed as described in Methods. Lanes marked 2C9 and 2C19 were loaded with 1 μg of insect cell microsomes (Supersomes) expressing the respective CYPs. In each section, the upper panels show Western blots of HH1315 (40 h treatment) probed for CYP2C9 or CYP3A4. Blots reprobed with antibody to glyceraldehyde 3-phosphate dehydrogenase (GAPDH) are displayed under the respective CYP blots. In the lower panels, relative levels of CYP proteins were quantified, normalized to GAPDH to account for any loading or transfer discrepancies, and plotted as a percentage of the control group mean. Data represent the means ± S.E.M. of three independent samples for each group. Significant differences compared with control are denoted by *=p < 0.05 and **= p < 0.005.
Statistical Analysis
Control and treatment groups were compared by one-way analysis of variance and a Dunnett’s test utilizing SPSS (SPSS Inc., Chicago, IL).
RESULTS
Effects of cytokine treatments on CYP2C mRNAs in human hepatocytes
Results are presented as the average of 9 human hepatocyte preparations (Table 1) ranging from 15 months to 84 years of age. CYP2C8 was significantly down-regulated by all treatments tested (Fig 1A). LPS caused the greatest effect, resulting in a decrease in mRNA by about 80% compared with control. All the individual cytokines decreased CYP2C8 to between 40-60 % of control. The LPS effect was approximately twice the decrease seen with individual cytokines, suggesting that at least 2 pathways of down-regulation exist for LPS. In contrast, CYP2C9 mRNA was only significantly affected by IL-6 and TGF (Fig 1B). These cytokines decreased mRNA levels by 30-50%. CYP2C19 (Fig 1D) was also down-regulated in a similar pattern to CYP2C9, with IL-6 and TGF displaying significant effects while IL-1 and TNF clearly had no effect. CYP2C18 mRNA was also examined although current data suggest that the protein is not expressed in the human liver. Unlike the other CYP2Cs, none of the inflammatory cytokines showed any significant effects on the very low constitutive levels of CYP2C18 mRNA (Fig 1C).
Fig 1.
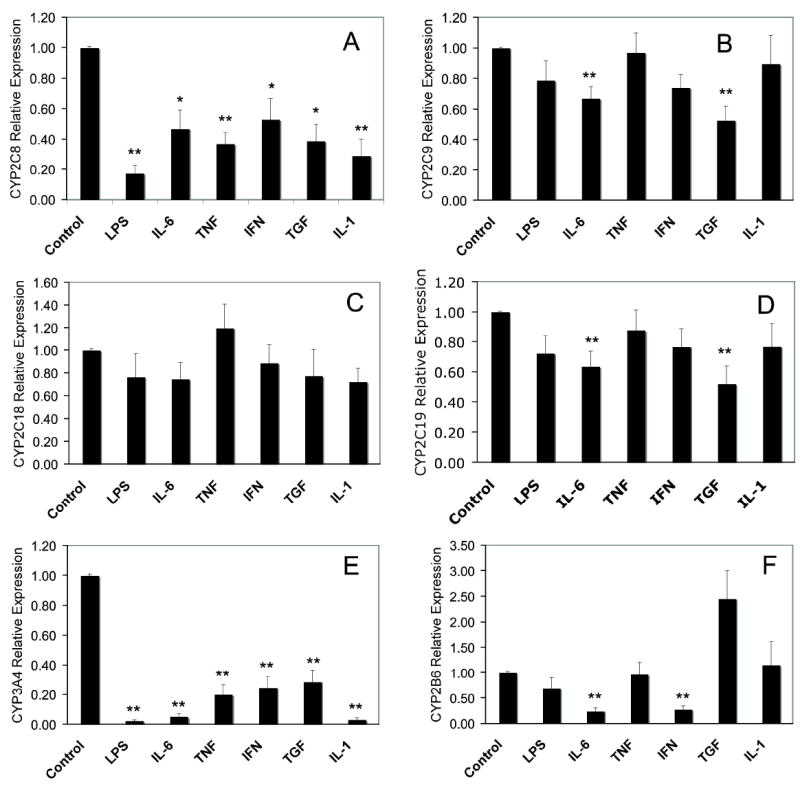
Effects of cytokines on CYP mRNA expression in human hepatocytes. Cells were treated with phosphate-buffered saline (1 μl/ml, Control), lipopolysaccharide (LPS, 10 μg/ml), interleukin-6 (IL-6, 10ng/ml)), tumor necrosis factor-α (TNF, 10ng/ml)), interferon-γ (IFN, 10ng/ml)), transforming growth factor-β (TGF, 10ng/ml) or interleukin-1 (IL-1, 5ng/ml) for 24 h and mRNA levels of (A) CYP2C8, (B) CYP2C9, (C) CYP2C18, (D) CYP2C19, (E) CYP3A4 and (F) CYP2B6 were determined as described in Methods. All treatments were carried out in triplicate for each individual and the results are the means ± S.E.M. of 9 subjects in each group. Significant differences compared with control are denoted by *=p < 0.05 and **= p < 0.005.
Effects of cytokine treatments on CYP3A4 and CYP2B6 mRNAs
As with the CYP2C mRNA, all data were averaged from the same 9 individuals shown in table 1. CYP3A4 was significantly down-regulated to 20% or less of control in response to LPS and all the cytokines tested, with LPS, IL-6 and IL-1 resulting in levels below 5% of control (Fig 1E). These responses are qualitatively similar to those of CYP2C8, although generally larger in magnitude. CYP2B6 exhibited a very different cytokine response pattern with only IL-6 and IFNγ significantly decreasing mRNA levels by 80 % (Fig 1F). TGF treated cells showed a trend towards a 2.5 fold induction of CYP2B6 mRNA levels, which just failed to reach statistical significance. Data for CYP3A7 was also collected from the 2 infant samples used in this study. In the samples tested, the CYP3A7 down-regulation pattern was similar to that of CYP3A4 (data not shown). IL-6 was the only cytokine that showed any noticeable difference: CYP3A7 mRNA decreased to 25 % of control with IL6 treatment, whereas the decline in CYP3A4 mRNA was to about 10% of control.
Regulation of CYP protein expression by cytokines
To determine whether regulation of human CYP mRNAs is reflected in corresponding changes in protein expression, we analyzed protein expression of CYP2C9, CYP3A4 and CYP2B6 in hepatocytes from 2 individuals designated as 1315 and 1294. Protein samples were collected after treatment for 40 and 24 h respectively. Western blotting results are shown in Figs 2 and 3. Note that mRNA levels were measured after 24 h treatment in these samples and the results for these two preparations were representative of the compiled results shown in Fig 1. CYP2C9 protein was down-regulated by all agents tested after 24 h treatment in HH1294 (Fig 3). After 40 h of treatment, protein levels of CYP2C9 were still profoundly suppressed in LPS, IL-6 and TNF-treated HH1315 hepatocytes, but were not significantly different from control in cells treated with IFN, TGF or IL-1 (Fig 3).
Fig 3.
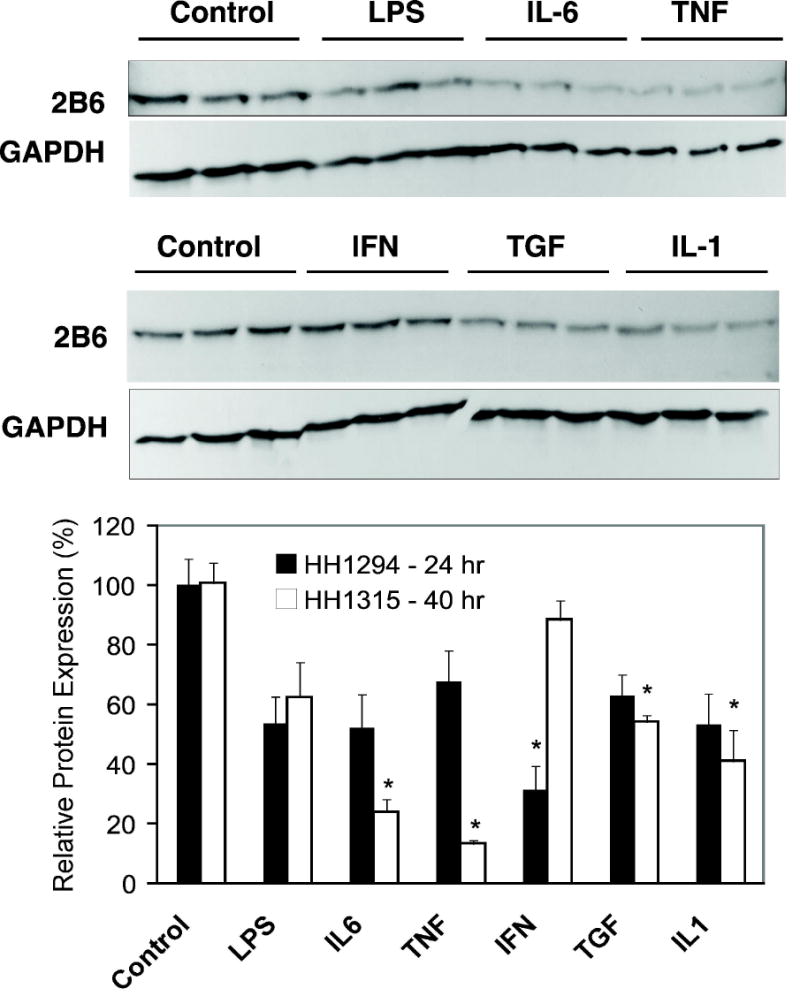
Regulation of human CYP 2B6 protein expression by cytokines. Cells from patient HH1294 or HH1315 were cultured in T25 flasks, and treated with phosphate-buffered saline (1 μl/ml, Control), lipopolysaccharide (LPS, 10 μg/ml), interleukin-6 (IL-6, 10ng/ml)), tumor necrosis factor-α (TNF, 10ng/ml)), interferon-γ (IFN, 10ng/ml)), tumor growth factor-β (TGF, 10ng/ml) or interleukin-1 (IL-1, 5ng/ml) for 24 or 40 hr, respectively. Cell lysates were prepared and Western blot assays for CYP2B6 were performed as described in Methods. Upper panel, Western blots of HH1315 (40 h treatment) probed for CYP2B6. Blots reprobed with antibody to glyceraldehyde 3-phosphate dehydrogenase (GAPDH) are displayed under the CYP blots. Lower panel, relative levels of CYP2B6 proteins were quantified, normalized to GAPDH to account for any loading or transfer discrepancies, and plotted as a percentage of the control group mean. Data represent the means ± S.E.M. of three independent samples for each group. Significant differences compared with control are denoted by *=p < 0.05.
CYP3A4 protein levels at 24 and 40 h of treatment in the two preparations were very similar with each treatment, and significant effects of each cytokine, except TNF, were observed at one of the two time points (Fig 3). Cells treated with TNF trended towards the same effects as most of the other treatments, but missed statistical significance. The protein levels of TNF, IFNγ, TGF and IL-1-treated hepatocytes showed good agreement with mRNA levels. However, LPS and IL-6 down-regulated mRNA levels by 90% at 24 h, whereas protein levels were only reduced to about 25-50% of control 24 or 40 h post-treatment.
The effects of cytokines on CYP2B6 protein expression are shown in Fig 4. Consistent with the mRNA results, IL6 at 24 h and IFN at 40 h both down-regulated CYP2B6 protein, whereas LPS had no effect. However TNF, TGF and IL-1 at 24 h each caused down-regulation of CYP2B6 protein to 13, 54 and 42% of control respectively (Fig 4), whereas no effect on CYP2B6 mRNA was observed.
DISCUSSION
In this paper, we present for the first time a detailed characterization of the effects of agents involved in the inflammatory response on the constitutive (inducer-free) expression of CYP2B6 and individual members of the CYP2C subfamily. The results confirm our hypothesis that some of these important drug-metabolizing CYPs show differential responses to cytokines, in contrast to others, which seem to be nonspecifically down-regulated by all stimuli tested.
Much of the down-regulation of drug-inducible CYP expression by cytokines can be ascribed to effects on the nuclear receptors that mediate drug induction. The effects of interleukin-1β (IL-1β) on human CYP expression induced by drugs that act via the constitutive androstane receptor (CAR) have been shown to involve the down-regulation of CAR expression (Assenat et al., 2004). On the other hand, cytokines can down-regulate pregnane X receptor (PXR) – or aryl hydrocarbon receptor – induced CYP expression via receptor down-regulation (Beigneux et al., 2002) and/or inhibition of receptor function (Tian et al., 1999; Zhou et al., 2006). But down-regulation of constitutive CYP expression does not require PXR (Richardson and Morgan, 2005). Therefore results from studies on drug-induced expression can not be extrapolated to constitutive expression. Indeed, the constitutive expression of CYP3A4 is down-regulated by Oncostatin M (Guillen et al., 1998), a member of the IL-6 family, IL-1 and IL-6 (Sunman et al., 2004), interferon-γ (IFN) (Donato et al., 1997) and hepatocyte growth-factor (Donato et al., 1998). The effect of IL-6 appears to be partially mediated by the induction of a truncated form of CCAAT enhancer binding protein (C/EBP)β, lacking a transactivation domain, that antagonizes the positive regulation by other C/EBP isoforms and hepatic nuclear factor-3γ (Jover et al., 2002)(Rodriguez-Antona et al., 2003; Martinez-Jimenez et al., 2005).
An inspection of the consolidated mRNA data identifies four distinct patterns of transcriptional response among the CYPs studied, and this is summarized in Table 3. In group 1, CYPs 2C8 and 3A4 were down-regulated by all of the agents tested. Therefore we predict that most infections or diseases associated with inflammation will down-regulate these CYPs. While CYP3A4 is responsible for the metabolism of many drugs (Schuetz, 2004), CYP2C8 catalyzes retinol and retinoic acid oxidation (Totah and Rettie, 2005). In group 2, CYPs 2C9 and 2C19 were down-regulated by IL-6 and TGF only. In group 3, CYP2B6 was sensitive to LPS, IL6 and IFN only. Therefore, we predict that regulation of group 2 and 3 CYPs may depend on the exact nature of the infection or inflammatory stimulus. The CYP2Cs constitute 10-20% of the total P450 content in the human liver, with CYPs 2C9 and 2C19 being the most abundant (Shimada et al., 1994). CYPs 2C9 and 2C19 metabolize many commonly used drugs, including antibacterials, anticoagulants, antidiabetic and nonsteroidal anti-inflammatory agents (Goldstein and de Morais, 1994; Totah and Rettie, 2005). CYP2B6 is responsible for only 3-5% of hepatic CYP but is involved in metabolism of about 25% of all drugs (Gervot et al., 1999; Lang et al., 2001). However, interindividual variation in CYP2B6 levels is extensive and its overall low expression makes this P450 difficult to study. In group 4, the very low expression of CYP2C18 was unaffected by any treatment. The significance of CYP2C18 in drug metabolism is unclear, because although the mRNA is expressed in liver, CYP2C18 protein has not been detected (Lapple et al., 2003).
Table 3.
Summary of the effects of inflammatory agents on CYP mRNAs
| CYP mRNA | LPS | IL-6 | TNF | IFN | TGF | IL-1 |
|---|---|---|---|---|---|---|
| CYP2C8 | ↓ | ↓ | ↓ | ↓ | ↓ | ↓ |
| CYP2C9 | ↔ | ↓ | ↔ | ↓ | ↓ | ↔ |
| CYP2C18 | ↔ | ↔ | ↔ | ↔ | ↔ | ↔ |
| CYP2C19 | ↓ | ↓ | ↔ | ↔ | ↓ | ↔ |
| CYP3A4 | ↓ | ↓ | ↓ | ↓ | ↓ | ↓ |
| CYP2B6 | ↓ | ↓ | ↔ | ↓ | ↔ | ↔ |
Notably, despite these differential patterns of regulation, all CYPs studied except 2C18 were down-regulated by IL-6, albeit to differing extents. This, combined with the previously mentioned correlations of IL-6 plasma levels with CYP-dependent drug clearance and the attenuation of CYP down-regulation by some inflammatory stimuli in IL-6-null mice, is consistent with a prominent physiological role of this cytokine in CYP regulation. Obviously, it is possible that the regulation of CYP expression by cytokines will have different time- and concentration-dependencies that may affect the accuracy of the above predictions. Because of the limited availability of material, we were compelled to use concentrations and times that have proven optimal in rat hepatocytes.
The relatively rapid down-regulation of CYP mRNAs we observed can be contrasted with a previous report that IL-1, IL-6 and TNF treatments resulted in a 50% suppression of CYP2C and CYP3A mRNAs, but only after 72 h of treatment (Abdel-Razzak et al., 1993). However, these results were inconsistent across cultures. We were able to study the human CYP2Cs individually along with CYP3A4 and 2B6 in a larger number of human samples and obtain a detailed profile of human CYP response to a wider range of cytokines. We saw no effect of IL-1 on CYP2C9, 18 or 19 with only CYP2C8 mRNA showing much response after 24 h. This suggests that the decline they reported may have reflected mainly CYP2C8.
IFNγ is released mainly from T-cells in response to antigenic stimulation or LPS treatment. Rat CYP2C11 was unaffected by IFNγ (Tapner et al., 1996), but here we found significant down-regulation of CYP2C8 mRNA and CYP2C9 protein in hepatocytes. Donato et al (1997) previously reported that IFN down-regulated activities of CYP1A2, 2A6, 2B6 and 3A4 in human hepatocytes, as well as mRNA and protein expression of CYP1A2 and 3A4. Interestingly, they concluded that these effects were nitric oxide (NO)-dependent, because they were inhibited by an NO synthase inhibitor (Donato et al., 1997). The effects of IFN in our cultures were not NO-dependent, because we measured NO production in all of our experiments and the only treatments that stimulated NO production were IL-1 and LPS (results not shown). The possible role of NO in regulation of human CYP mRNAs and proteins by LPS and IL-1 remains to be elucidated.
TGF is an anti-inflammatory agent, which suppresses other cytokine production but down-regulates rat CYP2C11 (Iber and Morgan, 1998) and drug inducible human CYP1A1 and 1A2 (Abdel-Razzak et al., 1994). We observed down-regulation of all 3 CYP2Cs and CYP3A4 at the mRNA level, but there was no significant effect on CYP2B6 mRNA
In general, the response of CYP3A4 protein was in good agreement with the mRNA data. For CYP3A4, LPS and IL-6 down-regulated the mRNA by 90% 24 h post treatment. Since only IL6 and TGF down-regulated CYP2C9 and 2C19 mRNAs, the down-regulation of CYP2C9 protein at 24 h by all treatments suggests that LPS, IL-6, TNF, IFN and IL-1 may inhibit translation and/or stimulate degradation of CYP2C9 protein. It must be recognized that conclusions of this type, drawn from single time point analyses, are speculative. Alternatively, these agents could have produced a transient decline in CYP2C9 mRNA that had recovered by 24 h. In our hands, the low expression levels of CYP2B6 in uninduced hepatocytes made CYP2B6 protein analysis especially challenging. IL-6 and IFN clearly down-regulated both protein and RNA of CYP2B6, while TNF, TGF and IL-1 had little effects on the mRNA but caused significant down-regulation of CYP2B6 protein. Again, one could speculate that as seen with CYP2C9, posttranscriptional mechanisms may be involved. More detailed kinetic analyses are required to construct a better picture of any posttranscriptional regulation and the mechanisms involved. However, the limited availability, genetic variability, and culturing tolerances of human hepatocytes makes this work challenging.
Cytokines trigger very specifically controlled responses to infection and inflammation and these studies are critical in furthering our understanding of human drug metabolism and the responses of individuals to drugs after inflammation or infection. Although primary cultures of human hepatocytes represent the best model for studying human CYP responses to inflammation and infection, it is important to recognize the potential for variability in this system. We addressed this by testing the effects of cytokines in a large number of individuals from a range of ethnic groups and ages. Remarkably, the effects of cytokines on CYP mRNA expression in hepatocytes from these individuals were quite consistent, reflected by the relatively low variability of the data. Our results clearly show that the CYP2C responses to cytokines differ from each other and from CYP2B6 and 3A4. These data suggest strongly that, even with the overlapping effects of cytokines, human P450s are independently regulated in response to inflammation and infection. This variability in response to cytokines may be critical for patient care, since it predicts that CYPs are likely to be differentially regulated at different stages and by different mechanisms, in response to inflammatory attack or disease. This prediction is borne out by the differential sensitivity of CYP-dependent clearance observed in infectious liver disease (Frye et al., 2006).
Acknowledgments
This work was supported by grants GM46897 and GM069971 from the National Institutes of Health (E.T.M.). Hepatocytes were provided by Dr. Steven Strom via the Liver Tissue Procurement and Distribution System, NIH Contract N01-DK-9-2310. This work was presented in part at Experimental Biology 2006. Aitken AE and Morgan ET (2006) Regulation of Human Cytochrome P4502C mRNAs by cytokines. FASEB J 20 Suppl. S: A425.4.
Abbreviations
- CAR
constitutive androstane receptor
- C/EBP
CCAAT enhancer binding protein
- CYP
cytochrome P450
- GAPDH
glyceraldehydes 3-phosphate dehydrogenase
- IFN
interferon γ
- IL-1
interleukin-1β
- IL-6
interleukin-6
- LPS
lipopolysaccaride
- NO
nitric oxide
- PBS
phosphate buffered saline
- PXR
pregnane X receptor
- RT-PCR
reverse transcriptase-polymerase chain reaction
- TGF
transforming growth factor β
- TNF
tumor necrosis factor α
References
- Abdel-Razzak Z, Corcos L, Fautrel A, Campion JP, Guillouzo A. Transforming growth factor-beta 1 down-regulates basal and polycyclic aromatic hydrocarbon-induced cytochromes P-450 1A1 and 1A2 in adult human hepatocytes in primary culture. Mol Pharmacol. 1994;46:1100–1110. [PubMed] [Google Scholar]
- Abdel-Razzak Z, Corcos L, Fautrel A, Guillouzo A. Interleukin-1 beta antagonizes phenobarbital induction of several major cytochromes P450 in adult rat hepatocytes in primary culture. FEBS Lett. 1995;366:159–164. doi: 10.1016/0014-5793(95)00513-9. [DOI] [PubMed] [Google Scholar]
- Abdel-Razzak Z, Loyer P, Fautrel A, Gautier JC, Corcos L, Turlin B, Beaune P, Guillouzo A. Cytokines down-regulate expression of major cytochrome P-450 enzymes in adult human hepatocytes in primary culture. Mol Pharmacol. 1993;44:707–715. [PubMed] [Google Scholar]
- Aitken AE, Richardson TA, Morgan ET. Regulation of drug-metabolizing enzymes and transporters in inflammation. Annu Rev Pharmacol Toxicol. 2006;46:123–149. doi: 10.1146/annurev.pharmtox.46.120604.141059. [DOI] [PubMed] [Google Scholar]
- Ashino T, Oguro T, Shioda S, Horai R, Asano M, Sekikawa K, Iwakura Y, Numazawa S, Yoshida T. Involvement of interleukin-6 and tumor necrosis factor alpha in CYP3A11 and 2C29 down-regulation by Bacillus Calmette-Guerin and lipopolysaccharide in mouse liver. Drug Metab Dispos. 2004;32:707–714. doi: 10.1124/dmd.32.7.707. [DOI] [PubMed] [Google Scholar]
- Assenat E, Gerbal-Chaloin S, Larrey D, Saric J, Fabre JM, Maurel P, Vilarem MJ, Pascussi JM. Interleukin 1beta inhibits CAR-induced expression of hepatic genes involved in drug and bilirubin clearance. Hepatology. 2004;40:951–960. doi: 10.1002/hep.20387. [DOI] [PubMed] [Google Scholar]
- Beigneux AP, Moser AH, Shigenaga JK, Grunfeld C, Feingold KR. Reduction in cytochrome P-450 enzyme expression is associated with repression of CAR (constitutive androstane receptor) and PXR (pregnane X receptor) in mouse liver during the acute phase response. Biochem Biophys Res Commun. 2002;293:145–149. doi: 10.1016/S0006-291X(02)00196-1. [DOI] [PubMed] [Google Scholar]
- Carcillo JA, Doughty L, Kofos D, Frye RF, Kaplan SS, Sasser H, Burckart GJ. Cytochrome P450 mediated-drug metabolism is reduced in children with sepsis-induced multiple organ failure. Intensive Care Med. 2003;29:980–984. doi: 10.1007/s00134-003-1758-3. [DOI] [PubMed] [Google Scholar]
- Cheng PY, Wang M, Morgan ET. Rapid transcriptional suppression of rat cytochrome P450 genes by endotoxin treatment and its inhibition by curcumin. J Pharmacol Exp Ther. 2003;307:1205–1212. doi: 10.1124/jpet.103.057174. [DOI] [PubMed] [Google Scholar]
- Donato MT, Gomez-Lechon MJ, Jover R, Nakamura T, Castell JV. Human hepatocyte growth factor down-regulates the expression of cytochrome P450 isozymes in human hepatocytes in primary culture. J Pharmacol Exp Ther. 1998;284:760–767. [PubMed] [Google Scholar]
- Donato MT, Guillen MI, Jover R, Castell JV, Gomez-Lechon MJ. Nitric oxide-mediated inhibition of cytochrome P450 by interferon-gamma in human hepatocytes. J Pharmacol Exp Ther. 1997;281:484–490. [PubMed] [Google Scholar]
- Frye RF, Schneider VM, Frye CS, Feldman AM. Plasma levels of TNF-alpha and IL-6 are inversely related to cytochrome P450-dependent drug metabolism in patients with congestive heart failure. J Card Fail. 2002;8:315–319. doi: 10.1054/jcaf.2002.127773. [DOI] [PubMed] [Google Scholar]
- Frye RF, Zgheib NK, Matzke GR, Chaves-Gnecco D, Rabinovitz M, Shaikh OS, Branch RA. Liver disease selectively modulates cytochrome P450--mediated metabolism. Clin Pharmacol Ther. 2006;80:235–245. doi: 10.1016/j.clpt.2006.05.006. [DOI] [PubMed] [Google Scholar]
- Gervot L, Rochat B, Gautier JC, Bohnenstengel F, Kroemer H, de Berardinis V, Martin H, Beaune P, de Waziers I. Human CYP2B6: expression, inducibility and catalytic activities. Pharmacogenetics. 1999;9:295–306. [PubMed] [Google Scholar]
- Goldstein JA, de Morais SM. Biochemistry and molecular biology of the human CYP2C subfamily. Pharmacogenetics. 1994;4:285–299. doi: 10.1097/00008571-199412000-00001. [DOI] [PubMed] [Google Scholar]
- Guillen MI, Donato MT, Jover R, Castell JV, Fabra R, Trullenque R, Gomez-Lechon MJ. Oncostatin M down-regulates basal and induced cytochromes P450 in human hepatocytes. J Pharmacol Exp Ther. 1998;285:127–134. [PubMed] [Google Scholar]
- Iber H, Morgan ET. Regulation of hepatic cytochrome P450 2C11 by transforming growth factor-beta, hepatocyte growth factor, and interleukin-11. Drug Metab Dispos. 1998;26:1042–1044. [PubMed] [Google Scholar]
- Jover R, Bort R, Gomez-Lechon MJ, Castell JV. Down-regulation of human CYP3A4 by the inflammatory signal interleukin-6: molecular mechanism and transcription factors involved. Faseb J. 2002;16:1799–1801. doi: 10.1096/fj.02-0195fje. [DOI] [PubMed] [Google Scholar]
- Kraemer MJ, Furukawa CT, Koup JR, Shapiro GG, Pierson WE, Bierman CW. Altered theophylline clearance during an influenza B outbreak. Pediatrics. 1982;69:476–480. [PubMed] [Google Scholar]
- Lang T, Klein K, Fischer J, Nussler AK, Neuhaus P, Hofmann U, Eichelbaum M, Schwab M, Zanger UM. Extensive genetic polymorphism in the human CYP2B6 gene with impact on expression and function in human liver. Pharmacogenetics. 2001;11:399–415. doi: 10.1097/00008571-200107000-00004. [DOI] [PubMed] [Google Scholar]
- Lapple F, von Richter O, Fromm MF, Richter T, Thon KP, Wisser H, Griese EU, Eichelbaum M, Kivisto KT. Differential expression and function of CYP2C isoforms in human intestine and liver. Pharmacogenetics. 2003;13:565–575. doi: 10.1097/00008571-200309000-00005. [DOI] [PubMed] [Google Scholar]
- Livak KJ, Schmittgen TD. Analysis of relative gene expression data using real-time quantitative PCR and the 2(-Delta Delta C(T)) Method. Methods. 2001;25:402–408. doi: 10.1006/meth.2001.1262. [DOI] [PubMed] [Google Scholar]
- Martinez-Jimenez CP, Gomez-Lechon MJ, Castell JV, Jover R. Transcriptional regulation of the human hepatic CYP3A4: identification of a new distal enhancer region responsive to CCAAT/enhancer-binding protein beta isoforms (liver activating protein and liver inhibitory protein) Mol Pharmacol. 2005;67:2088–2101. doi: 10.1124/mol.104.008169. [DOI] [PubMed] [Google Scholar]
- Morgan ET. Regulation of cytochromes P450 during inflammation and infection. Drug Metab Rev. 1997;29:1129–1188. doi: 10.3109/03602539709002246. [DOI] [PubMed] [Google Scholar]
- Muntane-Relat J, Ourlin JC, Domergue J, Maurel P. Differential effects of cytokines on the inducible expression of CYP1A1, CYP1A2, and CYP3A4 in human hepatocytes in primary culture. Hepatology. 1995;22:1143–1153. [PubMed] [Google Scholar]
- Nishimura M, Yoshitsugu H, Naito S, Hiraoka I. Evaluation of gene induction of drug-metabolizing enzymes and transporters in primary culture of human hepatocytes using high-sensitivity real-time reverse transcription PCR. Yakugaku Zasshi. 2002;122:339–361. doi: 10.1248/yakushi.122.339. [DOI] [PubMed] [Google Scholar]
- Renton KW. Cytochrome P450 regulation and drug biotransformation during inflammation and infection. Curr Drug Metab. 2004;5:235–243. doi: 10.2174/1389200043335559. [DOI] [PubMed] [Google Scholar]
- Richardson TA, Morgan ET. Hepatic cytochrome P450 gene regulation during endotoxin-induced inflammation in nuclear receptor knockout mice. J Pharmacol Exp Ther. 2005;314:703–709. doi: 10.1124/jpet.105.085456. [DOI] [PubMed] [Google Scholar]
- Rivory LP, Slaviero KA, Clarke SJ. Hepatic cytochrome P450 3A drug metabolism is reduced in cancer patients who have an acute-phase response. Br J Cancer. 2002;87:277–280. doi: 10.1038/sj.bjc.6600448. [DOI] [PMC free article] [PubMed] [Google Scholar]
- Rodriguez-Antona C, Bort R, Jover R, Tindberg N, Ingelman-Sundberg M, Gomez-Lechon MJ, Castell JV. Transcriptional regulation of human CYP3A4 basal expression by CCAAT enhancer-binding protein alpha and hepatocyte nuclear factor-3 gamma. Mol Pharmacol. 2003;63:1180–1189. doi: 10.1124/mol.63.5.1180. [DOI] [PubMed] [Google Scholar]
- Rodriguez-Antona C, Jover R, Gomez-Lechon MJ, Castell JV. Quantitative RT-PCR measurement of human cytochrome P-450s: application to drug induction studies. Arch Biochem Biophys. 2000;376:109–116. doi: 10.1006/abbi.2000.1697. [DOI] [PubMed] [Google Scholar]
- Schuetz EG. Lessons from the CYP3A4 promoter. Mol Pharmacol. 2004;65:279–281. doi: 10.1124/mol.65.2.279. [DOI] [PubMed] [Google Scholar]
- Shimada T, Yamazaki H, Mimura M, Inui Y, Guengerich FP. Interindividual variations in human liver cytochrome P-450 enzymes involved in the oxidation of drugs, carcinogens and toxic chemicals: studies with liver microsomes of 30 Japanese and 30 Caucasians. J Pharmacol Exp Ther. 1994;270:414–423. [PubMed] [Google Scholar]
- Siewert E, Bort R, Kluge R, Heinrich PC, Castell J, Jover R. Hepatic cytochrome P450 down-regulation during aseptic inflammation in the mouse is interleukin 6 dependent. Hepatology. 2000;32:49–55. doi: 10.1053/jhep.2000.8532. [DOI] [PubMed] [Google Scholar]
- Strom SC, Pisarov LA, Dorko K, Thompson MT, Schuetz JD, Schuetz EG. Use of human hepatocytes to study P450 gene induction. Methods Enzymol. 1996;272:388–401. doi: 10.1016/s0076-6879(96)72044-x. [DOI] [PubMed] [Google Scholar]
- Sunman JA, Hawke RL, LeCluyse EL, Kashuba AD. Kupffer cell-mediated IL-2 suppression of CYP3A activity in human hepatocytes. Drug Metab Dispos. 2004;32:359–363. doi: 10.1124/dmd.32.3.359. [DOI] [PubMed] [Google Scholar]
- Tapner M, Liddle C, Goodwin B, George J, Farrell GC. Interferon gamma down-regulates cytochrome P450 3A genes in primary cultures of well-differentiated rat hepatocytes. Hepatology. 1996;24:367–373. doi: 10.1002/hep.510240213. [DOI] [PubMed] [Google Scholar]
- Tian Y, Ke S, Denison MS, Rabson AB, Gallo MA. Ah receptor and NF-kappaB interactions, a potential mechanism for dioxin toxicity. J Biol Chem. 1999;274:510–515. doi: 10.1074/jbc.274.1.510. [DOI] [PubMed] [Google Scholar]
- Totah RA, Rettie AE. Cytochrome P450 2C8: substrates, inhibitors, pharmacogenetics, and clinical relevance. Clin Pharmacol Ther. 2005;77:341–352. doi: 10.1016/j.clpt.2004.12.267. [DOI] [PubMed] [Google Scholar]
- Zhou C, Tabb MM, Nelson EL, Grun F, Verma S, Sadatrafiei A, Lin M, Mallick S, Forman BM, Thummel KE, Blumberg B. Mutual repression between steroid and xenobiotic receptor and NF-kappaB signaling pathways links xenobiotic metabolism and inflammation. J Clin Invest. 2006;116:2280–2289. doi: 10.1172/JCI26283. [DOI] [PMC free article] [PubMed] [Google Scholar]