Abstract
G-quadrplex DNA can exist in a rich variety of structural forms, ranging from unimolecular folded structures containing diverse types of loops and strand oreintations, to bimolecular dimeric structures, and finally to tetramolecular parallel-stranded structures. These diverse structures present numerous potential small molecule binding sites with distinctive properties. There is mounting evidence for important functional roles for G-quadruplex structures in biology. G-quadruplexes may participate in the maintainance of telomeres, in transcriptional regulation and, in mRNA, may act to modulate translation. G-quadruplexes thus represent an attractive target for new small-molecule therapeutic agents. Competition dialysis provides a useful tool for the discovery of small molecules that selectively recognize the unique structural features of G-quadruplexes. The principles and practice of the competition dialysis experiment are described here.
Keywords: G-quadruplexDNA, binding, dialysis, drug discovery, structural-selectivity
1. Introduction
The G-quadruplex structure was first described in 1962 in studies of guanosine gels completed in the Davies laboratory(1). While quadruplex DNA continued to be studied over the subsequent decades (2), the structure was regarded as a biophysical oddity, with little functional relevance. That situation changed when G-rich sequences capable of forming G-quadrplexes were found to be highly conserved in telomeres (3, 4). The finding that G-quadruplexes prevented replication of telomeric DNA by telomerase (5) suggested a new strategy for chemotherapy (6–10). Small molecules that would stabilize the quadruplex structure would lock the telomere into an unfavourable conformation for replication, and would interfere with normal telomere biology. The strategy was validated using a G-quadruplex interactive compound (11). G-quadrplex structures were subsequently found to be important structural elements in the promoters of many genes (12–15), and more recently a quadruplex structure was found in mRNA that appeared to modulate translation (16). The G-quaduplex represents an important new potential drug target.
DNA quadruplexes present a diversity of targetable structures (17, 18). Scheme I shows, in highly schematic form, some possible quadruplex structures. Individual strands can fold unimolecularly into a variety of structures, with diverse strand segment orientations and loop geometries. Two strands can combine to form bimolecular structures, again with diverse strand and loop orientations. Four strands can combine in a tetramolecular reaction, almost inevitably and exclusively featuring parallel strand orientations. All of these structures are characterized by unique groove geometries, loop structures, and base stacking geometries. Collectively these features present a variety of nooks, crannies and surfaces that might be selectively recognize by complementary structural features in small molecules. The challenge is to discovery such G-quadruplex selective molecules that recognize these structural features that might serve as lead compounds in a drug discovery effort. A few such small molecules exist, but a systematic effort to discover additional compounds is uregently needed.
Competition dialysis provides a useful quantitative tool for the discovery of structural-selective compounds that recognize particular nucleic acid structures (19–23). In the competition dialysis experiment, an array of nucleic acid structures is dialyzed against a common test ligand solution. When equilibrium is reached, the array of structures is in contact with the identical free ligand concentration, and measurement of the amount of ligand bound to each structure provides a direct measure of affinity for that structure. Structural preferences are immediately and simply visualized. The competition dialysis method has been widely used in a number of laboratories world wide. The principles and practice of the method as applied to quadruplex DNA will be described here.
2.1 Principle of method
The physical process of dialysis involves the diffusive flow of one or more solutes through a semi-permeable membrane. Molecules smaller in size than the membrane pores can freely diffuse across the membrane while larger molecules are retained inside the membrane. Dialysis is used routinely in basic science to remove impurities or to change solution conditions, for example, during the purification of nucleic acids and proteins (24). Competition dialysis is an extension of the dialysis method to study the equilibrium specificity of a test ligand for different nucleic acid forms (25, 26).
In a simple equilibrium dialysis assay, two chambers are separated by a semi-permeable membrane. A known concentration of receptor is placed in one of the chambers and a known ligand concentration in the other. An appropriate membrane is selected such that the ligand is free to pass from one chamber to the other, but the receptor is retained in one chamber. As the ligand diffuses, some of it will bind to the receptor and some will remain free in the solution. If the ligand affinity for the receptor is nonzero, an appreciable concentration of the ligand bind to the receptor. When equilibrium is reached, the concentration of free (unbound) ligand will be identical in all chambers, but the total concentration of ligand will be higher in the receptor chamber by the amount bound. How much is bound depends on the ligand affinity. In the competition dialysis assay, a number of receptors are placed in individual closed membrane chambers in a beaker containing a solution of the test ligand (the dialysate). Once equilibrium has been attained, the ligand concentration in each chamber is measured spectrophotometrically.
Muller and Crothers (26) made the first report of a competition dialysis method that was designed to study the preference of a ligand for GC or AT base pairs. Natural DNA samples of differing base composition were placed in two chambers separated by a central chamber in which the ligand was placed. After allowing the ligand to equilibrate between the three chambers, more ligand accumulated in the receptor chamber containing the DNA with the higher percentage of the preferred base or base pair. Analysis using simple probability concepts allowed surprisingly detailed inferences about the exact nature of the preferred ligand binding site (25).
The competition dialysis assay (22) is a simple and straightforward extension of Crothers’ original method. Instead of a three-chambered dialysis apparatus, disposable dialysis units are used to contain a wide variety of nucleic acid structures at identical concentrations. These units are simply placed into a beaker containing ligand solution. At equilibrium, the free ligand concentration is identical throughout the system, and preferential binding by a particular structure leads to a greater accumulation of total ligand within that dialysis unit. Structural selectivity can be easily measured by measuring total ligand concentration within each dialysis unit. The method is further extended as described here by using a custom-made prototype provided by Linden Biosciences (Woburn, MA) based on the Rapid Equilibrium Dialysis Device, shown in Figure 1. In this newl apparatus, 96 dialysis membrane chambers (fitted to holders containing two chambers each) are inserted in a 48 well rack and placed into a Teflon® Base Plate filled with a solution containing the test drug. All membrane chambers are in contact with the common dialysate solution. The sample volume in each well is 150 – 200 μL, and the volume of the dialysate reservoir is 150 mL. During the experiment, the dialysate is continuously circulated in a closed loop using a peristaltic pump in order to ehance the rate of equilibration. The apparatus conforms to standard 96-well plate geometry, permitting the use of standard multitip pipettors and other 96-well plate technology. In principle, the unit could be used with robotics to automate the procedure.
Figure 1.
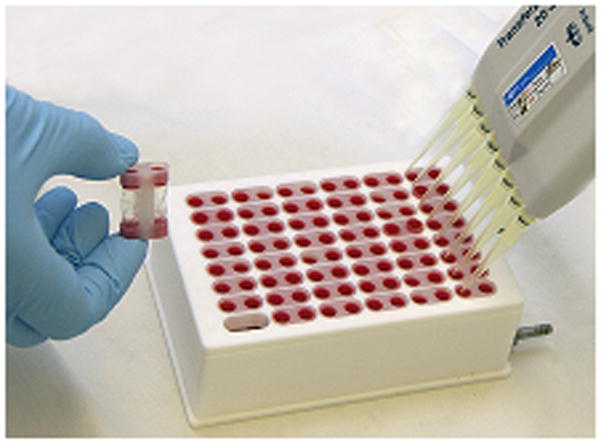
Microdialyzer for 96 samples
2.2 Overview of the Competition Dialysis Experiment
An overview of the competition dialysis experiment in shown in schematic form in Figure 2. Once stock solutions of the nucleic acid array are prepared, experiments may be conducted rapidly and efficiently. Experimental set up takes approximately two to three hours, and involves primarily preparing the membrane wells and loading the desired array into the dialysis apparatus. Once set up, the experiment runs unattended. After dialysis equilibrium is reached, samples are removed from the dialysis unit, SDS added to dissociate bound drug, and concentrations determined by absorbance or fluorescence. Use of 96-well technology greatly facilitates these liquid handling steps, and use of a 96-well plate reader dramatically accelerates the acquisition of data.
Figure 2.
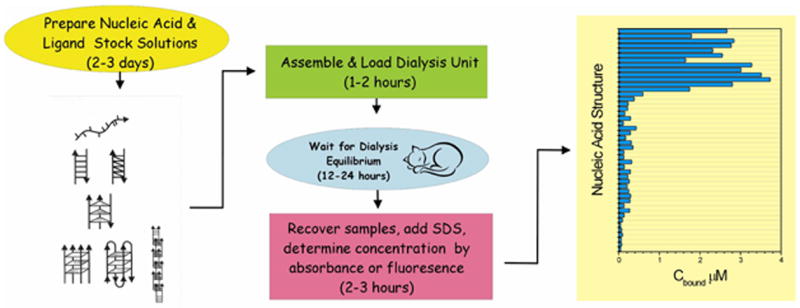
Overview of the competition dialysis experiment
2.3 Array of structures used in the competition dialysis assay
The first challenge to be met in the competition dialysis assay is to find a suitable buffer in which the structures of interest are all stable. The method is amenable to a wide range of buffer conditions including sodium cacodylate, sodium phosphate, potassium phosphate, tris-based buffers, MOPS, MES, HEPES, as well as different concentrations of NaCl or KCl. In the first generation assay (22), 13 structures were found to be stable in a simple phosphate buffer containing 200 mM NaCl. The assay was expanded to include 19 structures in the second-generation assay (27), using the same buffer conditions. Table 1 lists the samples used in the current version of the assay.
Table 1.
Nucleic acid samples used in the current competition dialysis assay
| Conformation | Index | Nucleic acid | λ (nm) | ε (M−1cm−1) | Monomeric unit |
|---|---|---|---|---|---|
|
| |||||
| Single-stranded DNA | 1 | poly (dT)* | 264 | 8520b | Nucleotide |
| 2 | poly (dA)* | 257 | 8600b | Nucleotide | |
| Single-stranded RNA | 3 | poly (rG) | 253 | 6200c | Nucleotide |
| 4 | poly (rC) | 269 | 6200c | Nucleotide | |
| 5 | poly (rA)* | 258 | 9800c | Nucleotide | |
| 6 | poly (rU)* | 260 | 9350b | Nucleotide | |
| Double-stranded DNA | 7 | poly (dAdT)* | 260 | 12000b | base pair |
| 8 | poly (dAdT)-(dAdT)* | 262 | 13200b | base pair | |
| 9 | poly (dGdC) | 254 | 14800b | base pair | |
| 10 | poly (dGdC)-(dGdC)* | 254 | 16800b | base pair | |
| 11 | poly (dAdC)-(dGdT) | 258 | 13000b | base pair | |
| 12 | Z-DNA* | 254 | 16060b | base pair | |
| 13 | Clostridium Perfringens (31% GC)* | 260 | 12476b | base pair | |
| 14 | Human placenta (41% GC) | 260 | 12777a | base pair | |
| 15 | Salmon testes (41.2% GC) | 260 | 13200b | base pair | |
| 16 | Herring testes (42% GC) | 260 | 12858b | base pair | |
| 17 | Calf thymus (42% GC)* | 260 | 12824b | base pair | |
| 18 | Chicken blood (42% GC) | 260 | 12743c | base pair | |
| 19 | Escherichia Coli (50% GC) | 260 | 13085c | base pair | |
| 20 | Lambda DNA (66% GC) | 260 | 13441a | base pair | |
| 21 | Microccocus lysodeiktus (72% GC)* | 260 | 13846b | base pair | |
| 22 | Promoter Myc/NHE (TG4AG3)2TG4A2G2/(AC4TC3)2AC4T2C2 | 260 | 12353a | base pair | |
| 23 | Human telomere/complementary (AG3T2)3AG3/(TC3A2)3TC3 | 260 | 11403a | base pair | |
| 24 | poly (dIdC) | 251 | 13800c | base pair | |
| DNA-RNA hybrid | 25 | poly (rCdG) | 269 | 12400c | base pair |
| 26 | poly (rAdT)* | 260 | 12460c | base pair | |
| 27 | poly (dArU) | 257 | 13000c | base pair | |
| Double-stranded RNA | 28 | poly (rArU)* | 260 | 14280c | base pair |
| 29 | poly (rIrC) | 245 | 10600c | base pair | |
| 30 | poly (rCrG) | 260 | 13600c | base pair | |
| Triplex DNA or RNA | 31 | poly (dAdT)-(dT) * | 260 | 17200b | Triplet |
| 32 | poly (rArU)-(rU)* | 260 | 17840b | Triplet | |
| Quadruplex DNA | 33 | C4T4C4 | 260 | 27481a | Quartet |
| 34 | G4T4G4 | 260 | 16426a | Quartet | |
| 35 | TG4T | 260 | 12672a | Quartet | |
| 36 | G4T4G4T4G4T4 | 260 | 46988a | Quartet | |
| 37 | G10T4G10 | 260 | 42009a | Quartet | |
| 38 | TC4T | 260 | 7566a | Quartet | |
| 39 | Promoter BCL2 AG4CG3CGCG3AG2A2G5CG3AGCG4C | 260 | 41591a | Quartet | |
| 40 | Human telomere (AG3T2)3AG3 * | 260 | 73000b | Quartet | |
| 41 | Promoter CMYC TG4AG3TG4AG3TG4A2G2 | 260 | 45309a | Quartet | |
| 42 | Promoter VEGF G3CG3C2G5CG4TC3G2CG4CG3AG | 260 | 35778a | Quartet | |
| 43 | Promoter HER-2/neu AG2AGA2G2(AG2)2TG2(AG2)3GC | 260 | 42985a | Quartet | |
| 44 | Promoter RETINOBLASTOMA CG6T4G3CG2C | 260 | 9407a | Quartet | |
| 45 | Promoter KIRAS G3A2GAG3A2GAG5AG2 | 260 | 24646a | Quartet | |
| 46 | i-motif poly (dC) | 274 | 7400b | Nucleotide | |
determined experimentally24
from reference 27
GE Healthcare Bio-sciences, technical information
nucleic acids structures used in the 19 format of the assay
The samples listed in Table 1 provide an array that includes a wide variety of nucleic acid structures. Single-stranded DNA and RNA are represented. Duplex DNA is represented by both natural DNA samples and synthetic polydeoxynucleotides of defined sequence. These samples cover a range of base composition and simple dinucleotide repeat sequences. Duplex RNA is represented, as are DNA:RNA hybrid structures. Left-handed Z-DNA represents an extreme secondary structural variant. Multistranded triplex, quadruplex and i-motif structures are represented by several samples, including several G-rich promoter sequences of current interest.
It should be emphasized that the array of structures listed in Table 1 is but a point of departure. The competition dialysis method is completely general, and arrays of structures of particular interest can be designed as desired. The only limitations are that the structures be large enough to be retained by the dialysis tubing chosen for use, and that they are verified to be stable under the ionic conditions of the experiment. Essential quality control experiments to characterize nucleic acid samples were described in detail (19, 23), and include UV absorbance and circular dichroism spectroscopy, and thermal denaturation studies.
2.4 Materials and Sample Preparation
2.4.1 Nucleic acids
The most time-consuming step is the preparation of nucleic acid stock solutions. Synthetic polynucleotides (Sigma-Aldrich, St. Louis, MO or GE Healthcare Bio-Sciences Corp., Piscataway, NJ) or oligonucleotides (Integrated DNA Technologies Inc., Coralville, IA) were dissolved in the buffer of choice at 4°C overnight to achieve complete hydration. Single- and double-stranded polynucleotides and oligonucleotides were then used after filtration with 0.22 μm filters (cat# 141128, Whatman Inc., Florham Park, NJ). Triplex solutions were prepared by direct mixing of the corresponding duplex and single strand. Triplexes and quadruplexes were annealed by heating in a water bath to 90°C for 10 minutes followed by slow, overnight cooling to room temperature. Samples were equilibrated at 4°C for 48 hours, extensively dialyzed to remove any short fragments, and finally filtered before use. Commercially available natural DNA may contain significant amounts of contaminants, such as proteins and RNA, requiring careful purification (28). First, the DNA was dissolved by continuous stirring at 4°C (this can take a number of days if the GC content is very high). Samples were then sonicated for a total of 30 minutes to produce DNA fragments of ~ 200 base pairs. Five minute periods of sonication were followed by 5 minutes of rest, with a continous purge of nitrogen. Following sonication, the solution was extracted several times with phenol and chloroform to remove protein impurities followed by the addition of 10% (v/v) of 3M sodium acetate pH 5.5 and precipitation with ethanol. After drying in a stream of air or in a dessicator overnight, the DNA was redissolved in the appropriate buffer, dialyzed extensively and filtered prior to use. Left handed Z-DNA was prepared by bromination of poly(dGdC)-(dGdC) as previously described (29). All nucleic acid samples were characterized by UV absorbance and circular dichroism spectroscopy, and thermal denaturation studies to confirm purity and structure. Circular dichroism spectra were recorded using a JASCO J-810 spectropolarimeter (Jasco, Tokyo, Japan) and thermal denaturation studies were performed using a Hewlett Packard HP 8452A spectrophotometer equipped with a Peltier temperature controller unit (Agilent, Palo Alto, CA).
Nucleic acid samples used in the competition dialysis array were prepared at identical concentrations of 75 μM in terms of the monomeric unit: this means nucleotides for single-stranded forms, base pairs for duplex forms, triplets for triplex forms and quartets for quadruplex forms. The intent of using the monomeric unit was to normalize the concentrations of potential binding sites, although differences in the concentration of ends might be problematic for end-binding ligands. Nucleic acid solutions prepared at a concentration of 75 μM in BPES can be stored for up to 6 months at 4°C. Concentrations of nucleic acid samples are determined by UV absorbance spectroscopy using the extinction coefficients and absorbance maxima listed in Table 1. The addition of a new nucleic acid structure to the assay requires a thorough characterization of the stability of the structure in the chosen buffer as well as the determination of an experimental extinction coefficient, typically by the colorimetric phosphate assay (30).
2.4.2 Dialysis units
A number of possibilities exist for a choice of dialysis unit. Our first generation competition dialysis assay utilized 0.5 or 1.0 ml DispoDialyzer units (Spectrum Medical Industries Inc., Houston, TX) providing 6.28 mm2/ml of membrane area for dialysis. We then found a more suitable alternative in the Pierce Slide –A – Lyzer MINI dialyzer units (Pierce, Rockford, IL). Re-using these units is possible by removing the membrane after each experiment and replacing it with SnakeSkin® membrane (MWCO: 3,500; cat# 68035; Pierce). Each unit is evaluated before experiments by dialysis against water for 24 hours. The volume in each unit is measured and units with volumes exceeding the original 200 μl are discarded; these units provide 1.4 mm2/ml of area for contact with the dialysate. Our third generation of competition dialysis employed initially a Spectra/Por 96-well Microdialyzer (cat.# 132326, CA, USA) using membrane frames designed for the Spectra/Por microdialyzer (MWCO: 3,500; Spectra/Por® CE, cat# 132974, CA, USA), these membranes exposed a surface for dialysis exchange of 0.6 mm2/ml. The low surface-to-volume ratio presented some problems due to slow equilibration times. After equilibrating for more than 24 hours; air dissolve in the circulating dialysate leading to bubble formation.. These difficulties were improved by replacing the set up with a custom made device provided by Linden Biosciences (Woburn, MA) based on the Rapid Equilibrium Dialysis Device pictured in figure 1. Each chamber unit is composed of a Spectra/Por RC membrane, (MWCO 3,5000; cat 133104, Rancho Dominguez, CA) and offers 7.1 mm2/ml for dialysate exchange. Membranes are treated prior to use in order to remove any traces of urea, sodium azide or glycerol stabilizers. Reuse of the membranes is not recommended because of the possibilities of leaks or ligand binding to the membrane.
2.4.3 Ligands
The competition dialysis assay is amenable to the study of any ligand that is both soluble and stable in the chosen buffer. Preparation of micromolar concentrations can be achieved with many ligands, but where solubility is limiting DMSO can be added up to 1% (v/v). A necessary requirement for the competition dialysis assay is that the ligand possesses a convenient spectroscopic monitor to determine the ligand concentrations after dialysis. UV/Visible absorbance or fluorescence spectroscopy has been routinely used in our application of the assay. For absorbance spectroscopy, ligand extinction coefficients must be determined or taken from the literature. It is important that the extinction coefficient refer to the buffer of choice, many extinction coefficients quoted in the literature have been determined in organic solvents such as DMSO, chloroform, methanol, ethanol and acetonitrile. When using fluorescence spectroscopy to determine ligand concentrations, a standard curve is constructed from which to determine the concentrations corresponding to a given fluorescence intensity. Any adjustment of collection parameters, such as the slit width or gain, requires the construction of a new standard curve. It is important to note that some ligands bind to glass or plastic materials and precautions must be taken when working with these ligands. Careful mass-balance measurements of total ligand would be recommended for initial experiments.
3. Experimental Procedures
3.1 Nucleic acid and dialysate solutions
Our first and second generation assays typically employed 200 mL of a 1 μM ligand solution into which were placed dialysis units containing 0.5 mL of 75 μM monomeric unit of each nucleic acid sample. Extension of the assay to the 96-well microdialyzer utilizes a 200 μl volume of 75 μM of each nucleic acid sample with the dialysate reservoir charged with 150 mL of ligand solution. Initial experiments in the 96-well format explored a range of ligand concentrations. The upper limit was determined to be 5 μM and the lower concentration limited by the ability to observe a reliable ligand signal; the optimal concentration was found to be 1–2 μM. Typically the dialysis chamber is filled with 250 ml of a 2 μM solution of the test ligand using a Reliable Scientific peristaltic pump with the solution passing through a 0.2 μm filter to remove fine particles and air. After loading each well of the microdialyzer with nucleic acid solution using standard multitip pipettors, the sample chamber is sealed with a Titer-Tops™ adhesive film (Diversified Biotech, Boston, MA) to prevent any evaporation from the wells.
3.2 Incubation time
The nucleic acid array was allowed to equilibrate with dialysate with mixing by using a continuous flow of 12.25 ml/min by a Mini-Peristaltic Pump (Harvard Apparatus, Holliston, MA), for 24 h at room temperature (20–22 °C).
3.3 Determination of bound ligand
At the end of the equilibration period, 180 μl of each nucleic acid sample was carefully removed from each well and transferred to a 96-well microtiter plate (Costar® cat# 3915; Corning Inc., Corning, NY). To each sample, 20 μl of a 10% (w/v) sodium dodecyl sulfate (SDS) stock solution was added to give a final concentration of 1% (w/v) SDS, sufficient to dissociate the ligand from the DNA structures and ensure that there are no complexities arising from differences in the optical properties of free and bound ligands. When working with potassium-based buffers, the addition of SDS results in a precipitate and it is necessary to use other detergents, such as triton X100 or tween 80. The total ligand concentration (Ct) within each dialysis well was determined spectrophotometrically using an appropriate absorbance wavelength and extinction coefficient or by construction of a standard fluorescence curve. Appropriate corrections were made for the small dilution resulting from the addition of the SDS stock solution. The free ligand concentration (Cf) was determined from an aliquot of the dialysate solution, which typically did not vary appreciable from the initial 2 μM. Absorbance and fluorescence measurements were made using a Safire2 microplate reader (Tecan US, Durham, NC). The bound ligand concentration (Cb) was then determined by difference as:
| (Eq 1) |
4. Results and Interpretation
In the first generation of the competition dialysis assay 13 DNA samples were tested (22), this was expanded to 19 samples for the second generation (27), and currently, the third generation has 46 nucleic acids samples covering a wide range of nucleic acid structures encompasing single-stranded and duplex DNA and RNA, DNA-RNA hybrids, left-handed Z-DNA, triplex and quadruplex DNA. The new array includes a considerable expansion of quadruplex DNA sequences and structures. Several promoter regions play an important role in the transcription of proteins and many of them in the over-expression of undesired proteins in cancer cells; many of them as quadruplex forms. The array includes the following promoter regions: promoter C-Myc (31), promoter BCL-2 (32), promoter VEGF (33), promoter HER-2/neu (34), Retinoblastoma promoter (35) and Ki-Ras proto-oncogene (36).
4.1 Sample data
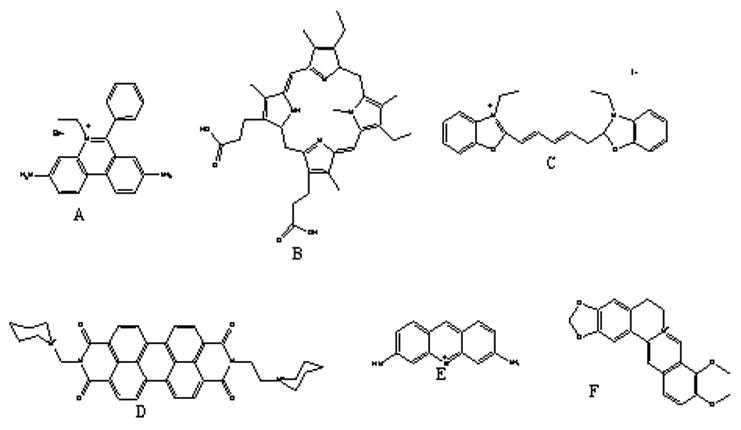
It is useful to review some results obtained from the earlier, 19-structure array that contained three quadruplex forms. These are the Na+ form of the human telomere quadruplex, a 20 –quartet- parallel stranded tetramolecular form (T2G20T2)4 and a “G-wire” that was inadvertently formed using the sequence 5′G10T4G10. The structures present in the 19-structure array are indicated by an asterisk (*) in Table 1. Results obtained using six ligands are shown in figure 3A; compound structures are shown in figure 3B.
Figure 3.
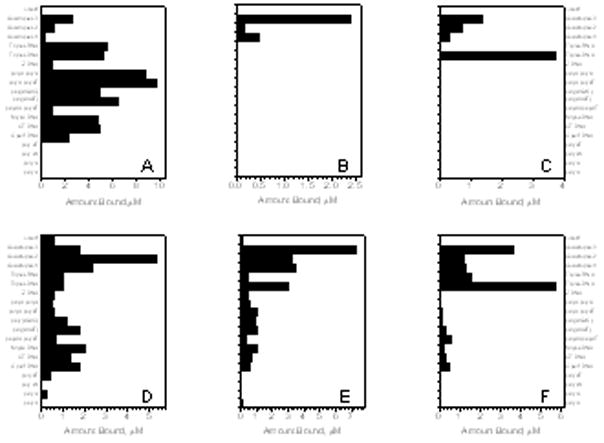
a)Second generation of the competition dialysis assay.
Panel A: Ethidium bromide presenting selectivity for the DNA:RNA hybrid polyrAdT and for the RNA sequence polyrArU. Panel B: NMM shows a remarkable selectivity for quadruplex structures with emphasis on (5′G10T4G10)4. Panel C: DODC indicates to be selective for the triplex DNA polydAdT-dT and to discern between the 3 quadruplex DNA under study. Panel D: Piper shows preference for the human telomere sequence over the other quadruplex forming oliugonucleotides. Panel E: Methylene blue shows preference for the human telomere sequence and to a less extent preference for the other 2 quadruplex (5′G10T4G10)4 and (5′T2G20T2)4. Panel F: Berberine shows preference for the triplex DNA polydAdT-dT and for the quadruplex (5′G10T4G10)4. Quadruplex 1: (5′T2G20T2)4. Quadruplex 2: human telomere sequence. Quadruplex 3: (5′G10T4G10)4.
b) Panel A: Ethidium bromide. Panel B: NMM. Panel C: DODC. Panel D: Piper. Panel E: Methylene blue. Panel F: Berberine
The six ligands chosen for study are ethidium, methylene blue, berberine, DODC, NMM, and PIPER. Ethidium bromide binds to DNA via an intercalation mode, usually to double stranded DNA, with preference for alternating purine-pyrimidine sequences (37), but can also bind single-stranded DNA, triplex, quadruplex and DNA-RNA hybrid structures;. Methylene blue is another intercalator with unknown structural preferences (38, 39). Berberine (40) is an alkaloid derived from traditional Chinese herbal remedies; it proved to have binding activity towards triplex DNA and in a minor extent to quadruplex DNA. Cyanine derivatives such as DODC (41), can form stacked complexes in the minor groove of duplex DNA, but has been shown to bind more selectively to triplex DNA over quadruplexes (27). N-methylmesoporphyrin IX (NMM) (42), behaves as a stable transition-state analogue for porphyrin chelatases and can discriminate between different structures of DNA, prevailing selectivity for quadruplexes. Amongst the G-quadruplex binders family; PIPER, a perylene derivative has proved to bind to quadruplex DNA structures with relative selectivity (13, 43, 44).
Competition dialysis results for ethidium bromide, methylene blue, berberine, DODC, NMM and PIPER are shown in Figure 3A as bar graphs representing the amount of compound bound to each nucleic acid sample tested for the second generation of DNA structures.
Panel A shows the preference of ethidium bromide for duplex polydApolydT and polyrArU, as well as sequence selectivity for the parallel quadruplex (5′G10T4G10)4. Panel B shows that NMM has a remarkable selectivity for only G-quadruplex DNA structures with particular specificity for the “G-wire” formed by 5′G10T4G10. Panel C shows 3,3′-diethyloxadicarbocyanine iodide (DODC) to have specificity for triplex DNA (poly dAdT)2-poly dT, but with some binding to G-quadruplexes with preference for the “G-wire” for (5′G10T4G10)4 over the antiparallel human telomere sequence and the parallel G-quadruplex (T2G20T2)4. Panel D indicates for PIPER selectivity and affinity of this compound for the x human telomereG-quadruple over the other quadruplexes, and over triplex, duplex and single strand DNA. A preference of methylene blue for the “G-wire” (5′G10T4G10)4 is indicated in the panel E. The groove binder berberine shows a clear preference for the triplex DNA polydAdTpolydT and to a lesser preference for the “G-wire”.
4.2 Examples of 96-well format data
Extension of this assay into this new 96 well-plate format, provides a more detailed comparison of binding to G-quadruplexes as shown in figure 4 for the compound NMM. In this format, this porphyrin derivative showed remarkably a preference of binding for quadruplex DNA structures for over all other structures in the assay. There are modest (approximately 2-fold) preferences among the various quadruplex forms. NMM most prefers the antiparallel quadruplex (5′G4T4)3, but has similar affinities for the “G-wire formed by (5′G10T4G10) and the i-motif formed by 5′TC4T and 5′C4T4C4. By using the data of Figure 4 to calculate apparent binding constants (as described below), the binding of NMM to quadruplex forms over all other forms seems to be more favourable by at least 2 kcal mol−1.
Figure 4.
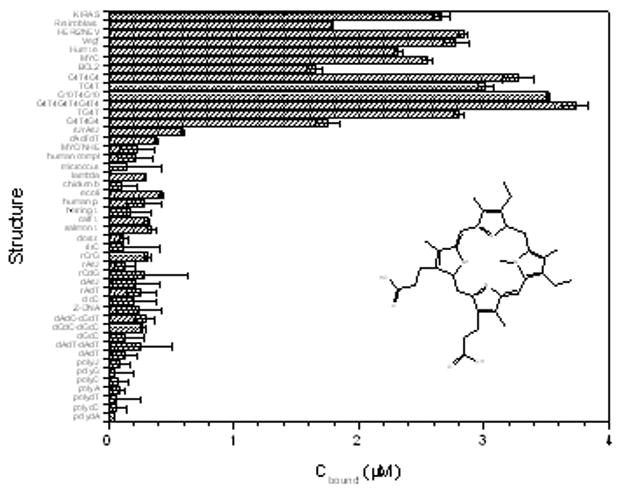
Third generation of competition dialysis for NMM. This porphyrin derivative prefers the G-quadruplex (5′G4T4)3, but displays similar affinities for the quadruplex (5′G10T4G10) and i-motif quadruplex (5′C4T4C4). Amongst the quadruplex forming oncogene sequences, it preferred the oncogene sequence Her/2Neu but with a relatively similar binding to KiRas and Vegf oncogene sequence.
4.3 Quantitative Analysis of Competition Dialysis Data
Competition dialysis data may be used to derive a number of quantitative parameters that characterize binding affinity and selectivity. These have been discussed in detail in earlier publications (19–21, 23). For example, the apparent binding constant, Kapp, can be simply obtained from the equation
| (Eq 2) |
Where Cb and Cf are the bound and free respectively (in our experiment the free ligand is 2 μM) ligand concentrations, [NA]total is the total nucleic acid concentration (in our experiment 75 μM). This treatment assumes that potential binding sites are in excess. The unit of this apparent binding constant refers to the monomeric unit of each polymer. Binding free energies can then be calculated by using the standard equation
| (Eq 3) |
Binding constants and free energy parameters obtained in this way are only an indication as they are derived from a single set of reactant concentrations and would correspond only to a single point on a more complete binding isotherm. Nonetheless, binding constants obtained in the way correlate well with more complete binding constants determined by spectrophotometric analysis (20, 21).
Additional metrics, such as the specificity sum and Tukey box plots (20, 21) are useful measures of binding selectivity and binding mode, but are limited in use for comparison of the properties of ligands studies using the identical array of structures. Since the library of ligands studied using the 46 structure array is limited, the reader is referred to discussions of the use of these metrics as applied to earlier generations of the assay (20, 21).
4.4 Difference plots
Competition dialysis data obtained on libraries of compounds can be analysed by difference plots to select compounds with particular affinity and selectivity for a given target. The procedure to construct these graphs is very simple and straight forward and was described in an earlier publication (20). Differences in the amounts of compound bound to the structure of interest and other structures are simply calculated by subtraction. Positive values indicate those compounds with higher affinity for the structure of interest, while negative values indicate those compounds with lower than affinity for the structure. Similarly, differences relative to the average amount bound to the structures of interest reveals compounds with higher or lower affinity relative to the mean.
Difference plots can be constructed to obtain an overview of binding of a test compounds for a particular DNA structure and as a tool to select compounds with the most marked preference for a particular target. A collection of difference plots is shown in Figure 5 to reveal binding preferences for the human telomere G-quadruplex DNA over other quadruplex structures and duplex poly (dGdC). Though this figure seems at first glance to be hoplessly complex, it provides an valuable insight into compound selectivity with only a little effort. Panel A shows the difference in binding of 67 compounds for the human telomere G-quadruplex over the tetramolecular parallel quadruplex (5′T2G20T2)4. Panel B shows the difference in binding to the human telomere quadruplex over binding to the “G-wire”formed by 5′G10T4G10. Panel C shows binding to the quadruplex over duplex polydG-dC. Panel D shows differences in affinity for the human telomere quadruplex over the average value for all 67 compounds.
Figure 5.
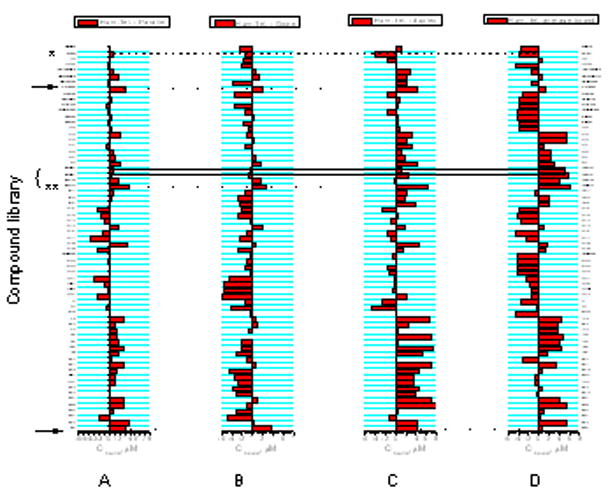
Difference plots for binding to different quadruplex structures. Panel A represents the difference plot for (T2G20T2)4. Panel B represents the difference plot for (G10T4G10)4. Panel C represents the difference plot for polydGdC. Panel D represents the difference plot for the human telomere sequence.
The value of these plots may be illustrated by looking at the differences seen for PIPER, indicated by the arrow nearest the x-axis. All of the differences across the five plots are positive. This indicates that PIPER prefers to bind to the human telomere quadruplex over the parallel quadruplex and the “G-wire”, over duplex poly (dGdC), and that it binds with slightly higher affinity relative to the mean.
Data for ditercalinium (figure 6), a dimer of 7H-pyridocarbazole, is indicated by the arrow near the top of the graphs in Figure 5. The difference plots indicate that ditercalinium, like PIPER, prefers to the human quadruplex structure over otherquadruplexes and duplex DNA. Its relative affinity for the human telomere quadruplex is slightly greater than that of PIPER. Binding of ditercalinium to quadruples DNA was reported previously (45).
Figure 6.
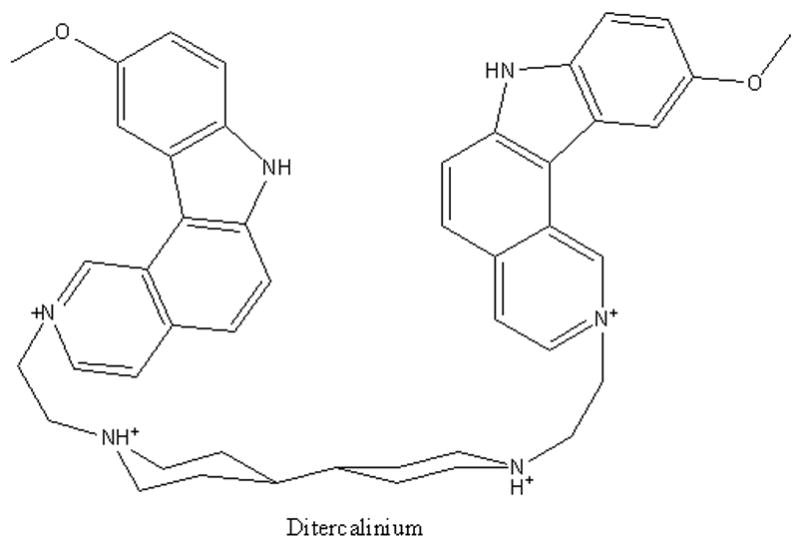
Schematic representation of ditercalinium.
Another utility of difference plots is in comparison of closely related compounds. Examination of difference plots may allow rudimentary structural-activity relationships to be established. For example, several ethidium bromide derivatives (provided to us by Jean-Louis Mergny) were studied. Their structures are shown in figure 7 and their difference plots are shown in figure 5 by the brackets.
Figure 7.
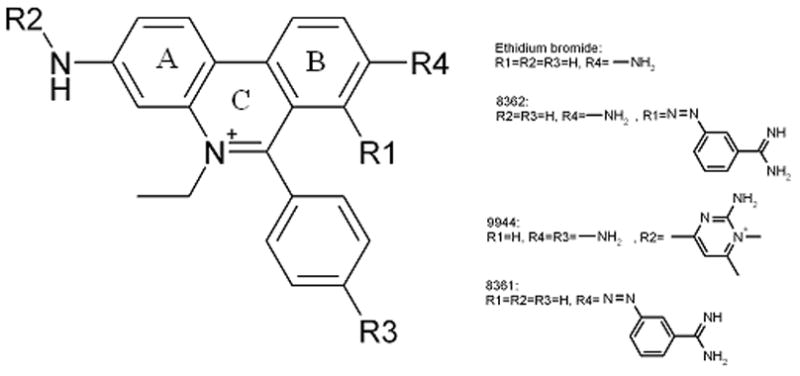
Schematic representation of ethidium bromide and its derivatives.
Etidium (asterisk [*] in figure 5) shows little selectivity toward the human telomere quadruplex, and less than average affinity. But addition of the substituents in derivative 9944 (double asterisk [**] in figure 5) yields a compound selective for the human telomere quadruplex over other quadruplex forms and duplex DNA. Its affinity for the human quadruplex is greatly enhanced. Substituents changes as in compounds 8361 and 8362, however, lead to considerable lesser selectivity and affinity. These examples indicate the utility of difference plots in making obvious the effects of substituent changes.
5. Conclusions
Competition dialysis has proved to be a powerful and versatile tool for the study of the molecular recognition of new targets. The method is based on firm thermodynamic principles, is simple to implement and allows the rapid identification of structure-selective binding interactions. The current implementation of the competition dialysis experiment has been adapted to a 96-well plate format, which has allowed the study of a greatly expanded array of nucleic acid forms. The data presented here showed the interaction of six well-known DNA ligands, ethidium bromide, berenil, PIPER, DODC, methylene blue and NMM, with an initial array of 19 different structures and sequences, obtained in only 24 hours and a subsequent array of 46 different DNA samples for the G-quadruplex binder NMM. The competition assay is versatile, and can be focused to study proteins or other targets of functional importance. This technique not only allows the identification of structure-selectivity interactions, but provides quantitative parameters that can be used to characterise binding interactions.
Acknowledgments
This project was supported by NCI grant CA35635 and NIH grant GM077422. We thank Jean-Louis Mergny for providing compounds.
Footnotes
Publisher's Disclaimer: This is a PDF file of an unedited manuscript that has been accepted for publication. As a service to our customers we are providing this early version of the manuscript. The manuscript will undergo copyediting, typesetting, and review of the resulting proof before it is published in its final citable form. Please note that during the production process errors may be discovered which could affect the content, and all legal disclaimers that apply to the journal pertain.
References
- 1.Gellert M, Lipsett MN, Davies DR. Proc Natl Acad Sci U S A. 1962;48:2013–8. doi: 10.1073/pnas.48.12.2013. [DOI] [PMC free article] [PubMed] [Google Scholar]
- 2.Guschlbauer W, Chantot JF, Thiele D. J Biomol Struct Dyn. 1990;8:491–511. doi: 10.1080/07391102.1990.10507825. [DOI] [PubMed] [Google Scholar]
- 3.Blackburn E, Bhattacharyya A, Gilley D, Kirk K, Krauskopf A, McEachern M, Prescott J, Ware T. Ciba Found Symp. 1997;211:2–13. doi: 10.1002/9780470515433.ch2. [DOI] [PubMed] [Google Scholar]
- 4.Blackburn EH. Nature. 1991;350:569–73. doi: 10.1038/350569a0. [DOI] [PubMed] [Google Scholar]
- 5.Zahler AM, Williamson JR, Cech TR, Prescott DM. Nature. 1991;350:718–20. doi: 10.1038/350718a0. [DOI] [PubMed] [Google Scholar]
- 6.Hurley LH. Biochem Soc Trans. 2001;29:692–6. doi: 10.1042/0300-5127:0290692. [DOI] [PubMed] [Google Scholar]
- 7.Hurley LH. Nat Rev Cancer. 2002;2:188–200. doi: 10.1038/nrc749. [DOI] [PubMed] [Google Scholar]
- 8.Hurley LH, Wheelhouse RT, Sun D, Kerwin SM, Salazar M, Fedoroff OY, Han FX, Han H, Izbicka E, Von Hoff DD. Pharmacol Ther. 2000;85:141–58. doi: 10.1016/s0163-7258(99)00068-6. [DOI] [PubMed] [Google Scholar]
- 9.Neidle S, Parkinson G. Nat Rev Drug Discov. 2002;1:383–93. doi: 10.1038/nrd793. [DOI] [PubMed] [Google Scholar]
- 10.Neidle S, Read MA. Biopolymers. 2000;56:195–208. doi: 10.1002/1097-0282(2000)56:3<195::AID-BIP10009>3.0.CO;2-5. [DOI] [PubMed] [Google Scholar]
- 11.Sun D, Thompson B, Cathers BE, Salazar M, Kerwin SM, Trent JO, Jenkins TC, Neidle S, Hurley LH. J Med Chem. 1997;40:2113–6. doi: 10.1021/jm970199z. [DOI] [PubMed] [Google Scholar]
- 12.Grand CL, Han H, Munoz RM, Weitman S, Von Hoff DD, Hurley LH, Bearss DJ. Mol Cancer Ther. 2002;1:565–73. [PubMed] [Google Scholar]
- 13.Rangan A, Fedoroff OY, Hurley LH. J Biol Chem. 2001;276:4640–6. doi: 10.1074/jbc.M005962200. [DOI] [PubMed] [Google Scholar]
- 14.Huppert JL, Balasubramanian S. Nucleic Acids Res. 2005;33:2908–16. doi: 10.1093/nar/gki609. [DOI] [PMC free article] [PubMed] [Google Scholar]
- 15.Huppert JL, Balasubramanian S. Nucleic Acids Res. 2007;35:406–13. doi: 10.1093/nar/gkl1057. [DOI] [PMC free article] [PubMed] [Google Scholar]
- 16.Kumari S, Bugaut A, Huppert JL, Balasubramanian S. Nat Chem Biol. 2007;3:218–21. doi: 10.1038/nchembio864. [DOI] [PMC free article] [PubMed] [Google Scholar]
- 17.Haider S, Parkinson GN, Read MA, Neidle S. In: DNA and RNA Binders. Demeunynck MCBWDW, editor. Vol. 2. Wiley-VCH; Weinheim: 2003. pp. 337–59. [Google Scholar]
- 18.Keniry MA. Biopolymers. 2000;56:123–46. doi: 10.1002/1097-0282(2000/2001)56:3<123::AID-BIP10010>3.0.CO;2-3. [DOI] [PubMed] [Google Scholar]
- 19.Chaires JB. In: Current Protocols in Nucleic Acid Chemistry. Beaucage SL, Bergstrom DE, Glick GD, Jones RA, editors. Vol. 1. John Wiley & Sons, Inc; New York: 2002. pp. 8.3.1–8.3.8. [Google Scholar]
- 20.Chaires JB. Curr Med Chem Anticancer Agents. 2005;5:339–52. doi: 10.2174/1568011054222292. [DOI] [PubMed] [Google Scholar]
- 21.Chaires JB. In: DNA Binders and Related Subjects. Waring MJaCJB., editor. Vol. 253. Springer-Verl;ag; Berlin: 2005. pp. 33–54. [Google Scholar]
- 22.Ren J, Chaires JB. Biochemistry. 1999;38:16067–75. doi: 10.1021/bi992070s. [DOI] [PubMed] [Google Scholar]
- 23.Ren J, Chaires JB. Methods Enzymol. 2001;340:99–108. doi: 10.1016/s0076-6879(01)40419-8. [DOI] [PubMed] [Google Scholar]
- 24.Craig LC, King TP. Methods Biochem Anal. 1962;10:175–99. doi: 10.1002/9780470110270.ch6. [DOI] [PubMed] [Google Scholar]
- 25.Chaires JB. In: Advances in DNA Sequence Specific Agents. Hurley LH, editor. Vol. 1. JAI Press, Inc; Greenwich, CT: 1992. pp. 3–23. [Google Scholar]
- 26.Muller W, Crothers DM. Eur J Biochem. 1975;54:267–77. doi: 10.1111/j.1432-1033.1975.tb04137.x. [DOI] [PubMed] [Google Scholar]
- 27.Ren J, Chaires JB. Journal of the American Chemical Society. 2000;122:424–25. [Google Scholar]
- 28.Chaires JB, Dattagupta N, Crothers DM. Biochemistry. 1982;21:3933–40. doi: 10.1021/bi00260a005. [DOI] [PubMed] [Google Scholar]
- 29.Moller A, Nordheim A, Kozlowski SA, Patel DJ, Rich A. Biochemistry. 1984;23:54–62. doi: 10.1021/bi00296a009. [DOI] [PubMed] [Google Scholar]
- 30.GE . In: Current Protocols in Nucleic Acid Chemistry. Bergstrom Dea., editor. John Wiley & Sons; New York: 2000. pp. 7.3.1–7.3.17. [Google Scholar]
- 31.Lemarteleur T, Gomez D, Paterski R, Mandine E, Mailliet P, Riou JF. Biochem Biophys Res Commun. 2004;323:802–8. doi: 10.1016/j.bbrc.2004.08.150. [DOI] [PubMed] [Google Scholar]
- 32.Mortenson MM, Schlieman MG, Virudachalam S, Lara PN, Gandara DG, Davies AM, Bold RJ. Lung Cancer. 2005;49:163–70. doi: 10.1016/j.lungcan.2005.01.006. [DOI] [PubMed] [Google Scholar]
- 33.Fukumura D, Xavier R, Sugiura T, Chen Y, Park EC, Lu N, Selig M, Nielsen G, Taksir T, Jain RK, Seed B. Cell. 1998;94:715–25. doi: 10.1016/s0092-8674(00)81731-6. [DOI] [PubMed] [Google Scholar]
- 34.Hung MC, Matin A, Zhang Y, Xing X, Sorgi F, Huang L, Yu D. Gene. 1995;159:65–71. doi: 10.1016/0378-1119(94)00459-6. [DOI] [PubMed] [Google Scholar]
- 35.Jiang Z, Guo Z, Saad FA, Ellis J, Zacksenhaus E. J Biol Chem. 2001;276:593–600. doi: 10.1074/jbc.M005474200. [DOI] [PubMed] [Google Scholar]
- 36.Xodo LE. FEBS Lett. 1995;370:153–7. doi: 10.1016/0014-5793(95)00829-x. [DOI] [PubMed] [Google Scholar]
- 37.Fox KR, Waring MJ. Nucleic Acids Res. 1987;15:491–507. doi: 10.1093/nar/15.2.491. [DOI] [PMC free article] [PubMed] [Google Scholar]
- 38.Hagmar P, Pierrou S, Nielsen P, Norden B, Kubista M. J Biomol Struct Dyn. 1992;9:667–79. doi: 10.1080/07391102.1992.10507947. [DOI] [PubMed] [Google Scholar]
- 39.Norden B, Tjerneld F. Biopolymers. 1982;21:1713–34. doi: 10.1002/bip.360210904. [DOI] [PubMed] [Google Scholar]
- 40.Franceschin M, Rossetti L, D’Ambrosio A, Schirripa S, Bianco A, Ortaggi G, Savino M, Schultes C, Neidle S. Bioorg Med Chem Lett. 2006;16:1707–11. doi: 10.1016/j.bmcl.2005.12.001. [DOI] [PubMed] [Google Scholar]
- 41.Chen Q, Kuntz ID, Shafer RH. Proc Natl Acad Sci U S A. 1996;93:2635–9. doi: 10.1073/pnas.93.7.2635. [DOI] [PMC free article] [PubMed] [Google Scholar]
- 42.Arthanari H, Basu S, Kawano TL, Bolton PH. Nucleic Acids Res. 1998;26:3724–8. doi: 10.1093/nar/26.16.3724. [DOI] [PMC free article] [PubMed] [Google Scholar]
- 43.Han H, Cliff CL, Hurley LH. Biochemistry. 1999;38:6981–6. doi: 10.1021/bi9905922. [DOI] [PubMed] [Google Scholar]
- 44.Han H, Bennett RJ, Hurley LH. Biochemistry. 2000;39:9311–6. doi: 10.1021/bi000482r. [DOI] [PubMed] [Google Scholar]
- 45.Carrasco C, Rosu F, Gabelica V, Houssier C, De Pauw E, Garbay-Jaureguiberry C, Roques B, Wilson WD, Chaires JB, Waring MJ, Bailly C. Chembiochem. 2002;3:1235–41. doi: 10.1002/1439-7633(20021202)3:12<1235::AID-CBIC1235>3.0.CO;2-I. [DOI] [PubMed] [Google Scholar]


