Abstract
Recurrent chromosome translocations in nonhematological tumors are restricted to specific subtypes, and their mechanism is currently unknown. Analysis of the sequence data of 113 interchromosomal junctions derived from 77 Ewing’s tumors carrying the characteristic t(11;22) translocation indicate that, in this tumor, translocations are initiated independently on each chromosome in regions that lack site specific recombination signal. Local sequence duplications, deletions, and, most importantly, inversions that are diagnostic of DNA hairpin formation indicate that, at the breakpoint, single-stranded DNA ends are processed individually before interchromosomal joining. Taken together, these observations suggest that chromosome translocations in Ewing’s tumors are mediated through a genuine illegitimate recombination mechanism.
Analyses of the DNA sequences that lie in the vicinity of chromosome translocation breakpoints in human hematological tumors has suggested that homeologous recombination and/or site-specific recombinogenic sequences may be implicated. In lymphoid neoplasms, this view is supported experimentally by the presence, at the chromosome junctions, of heptamer/nonamer sequences characteristic of the V(D)J recombination and/or of translin consensus sequences (1, 2). However, recurrent chromosome translocations are observed in various tumor types derived from progenitor cells that may not express the lymphoid specific recombination machinery. In those cases, the mechanism that mediates chromosome translocation has not been investigated in detail, but various recombination promoting sequences have been suggested to play a role [e.g., topoisomerase I and II, chi consensus, Alu, palindromic sequences, alternating purine/pyrimidine, and polypurine or polypyrimidine sequences (3–11)]. In solid tumors, recurrent specific translocations are rare and have not been studied systematically at the genomic level.
Ewing’s tumors (ET) are a group of neoplasms of neuroectodermal origin that carry in 85% of the cases a characteristic t(11;22) translocation generating an EWS/FLI-1 fusion transcript encoded by the derivative 22 (12). In the remaining 15% of the cases, variant chromosome 22 translocations lead to the formation of EWS/ERG, EWS/ETV1, EWS/FEV, or EWS/E1A3 fusion transcripts (13–16).
The approximate location of 89 t(11;22) chromosome breakpoints on chromosomes 22 and 11 have been determined, thus defining breakpoint regions that were termed EWSR1 and EWSR2, respectively (13, 17). To further document the recombination mechanism, which underlies the t(11;22) translocation, we have established the normal genomic sequence of the entire EWSR1 and EWSR2 regions. The information derived from these sequences has provided means to PCR amplify 113 interchromosomal junctions from ET-carrying t(11;22) translocations, thus enabling a detailed analysis at the nucleotide level.
MATERIALS AND METHODS
Tumors and Cell Lines.
A total of 77 different ET or cell lines was collected. This set of tumors was composed of 63 bone ET, 5 extraskeletal ET, 7 neuroepitheliomas, and 2 Askin’s tumors. Among these tumors, 73 had been screened for rearrangements in EWSR1 and EWSR2 by the Southern blotting technique (17); 56 cases had demonstrated rearrangement in both regions, and 11 and 2 cases had enabled the detection of a rearrangement only in EWSR1 and EWSR2, respectively. In four cases, no rearrangement of either of the regions was noted (13). An EWS/FLI-1 fusion transcript was observed in all of the 47 cases for which it was searched. ET with an EWS/ERG fusion transcript were excluded from this series.
Sequence Determination.
Overlapping cosmids C4 and G6 were isolated from the LL22NCO1 library by a chromosome-walking procedure. They cover a 80-kilobase (kb) genomic region containing the entire EWS gene (17, 18). Overlapping cosmids Cosco 1.1 and Cosco 1P3 were isolated from a cosmid library derived from the ICB 104 cell line (17); they cover a 66-kb region of the FLI-1 gene, which contains the entire EWSR2 region. These four cosmids were sequenced entirely by using a procedure described by Zucman et al. (18). Sequences are deposited in the European Molecular Biology Laboratory database (accession nos. Y08806 and Y17293)
PCR Procedure.
The amplify software (19) was used to identify two sets of compatible primers in the EWSR1 (3 primers) and EWSR2 regions (15 primers). The average distance between primers was 2 kb. Optimization of a multiplex procedure enabled screening of the junction region on der(22) with 15 different PCRs. To amplify the junction on the der(11), the same strategy was used and required an equivalent number of reactions. Primer sequences, pooling schemes, and PCR conditions are available on the Fondation Jean Dausset/Centre d’Étude du Polymorphisme Humain (Paris) web server (www.cephb.fr/ewing). Amplified fragments were sequenced on both strands after purification (QIAquick PCR purification kit, Quiagen, Chatsworth, CA) by using both amplification primers and a PRISM dye terminator kit (Applied Biosystems). All junction sequences are deposited in the European Molecular Biology Laboratory database with their corresponding cell-line names (accession nos. AJ229253 to AJ229365).
Sequence Analysis.
The computer programs censor and pythia, designed by Jurka and Milosavljevic (20), were used by e-mail procedure (censor@charon.lpi.org) for repeat sequence identification and Alu classification. The nucleotide sequence was searched for potential coding regions by using grail 1.2 [Gene Recognition and Analysis Internet Link (21)]. Other procedures for sequence analysis are described in the text.
RESULTS AND DISCUSSION
Molecular Characterization of der(22) Chromosomal Junctions.
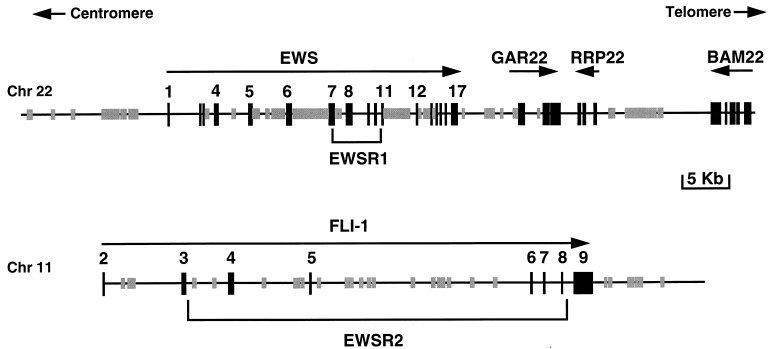
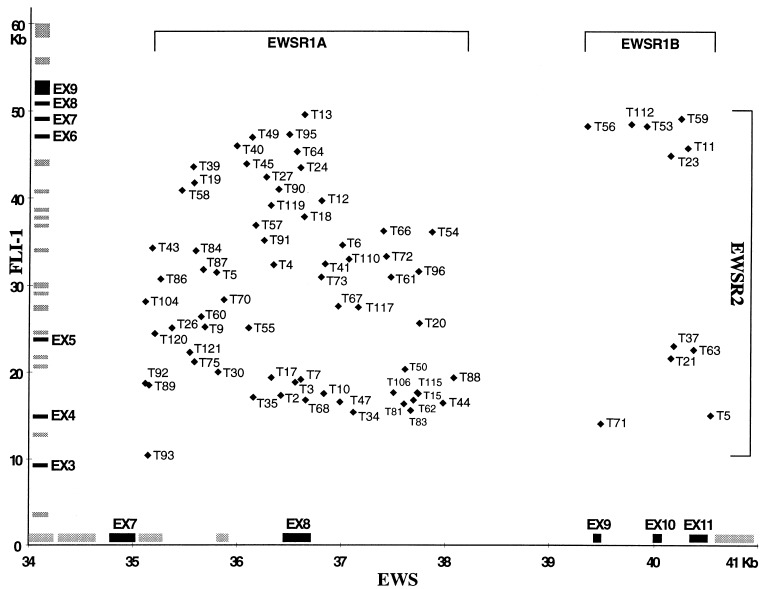
The two chromosomal breakpoint regions, EWSR1 on chromosome 22 and EWSR2 on chromosome 11 (17), are included in completely analyzed genomic sequences totaling 80 kb and 66 kb respectively. These sequences contain the entire EWS and FLI-1 genes, with the exception of FLI-1 exon 1 and intron 1 (Fig. 1). Systematic multiplex PCR screening of the der(22) chromosome followed by sequencing allowed the precise determination of the positions of the junction-points on chromosomes 22 and 11 for all 77 ET studied. In seven cases, one to five additional base pairs were observed to link the EWS and FLI-1 sequences. Junction points on chromosome 22 were distributed in two subregions of 3.0 kb (EWSR1A) and 1.2 kb (EWSR1B) separated by a junction-free portion of intron 8 of 1.2 kb (Fig. 2). Sequence analysis and search for DNase sensitive sites (ref. 22 and data not shown) failed to reveal differences that would provide a structural explanation for the absence of breakpoint in this intronic portion. A functional explanation would hypothesize that splicing out of EWS exon 8 (required to maintain the reading frame in the EWS/FLI-1 fusion transcript) takes place only when the chromosome 22 junction is <1.4 kb away from the exon 8 donor splice site (12, 13). Within EWSR1A and EWSR1B, the junctions appeared randomly distributed, but their density was only half in the latter. On chromosome 11, all junction points lie in the previously defined EWSR2 region located between FLI-1 exons 2 and 8 (Fig. 2). In this region, the highest density of junctions was observed in intron 4, with a 3-fold higher density, as compared with the rest of the EWSR2 region. Otherwise, junction points appeared to be distributed randomly.
Figure 1.
Schematic representation of the EWS and FLI-1 regions corresponding to the 80-kb and 66-kb genomic sequences of chromosomes 22 and 11, respectively. The arrow under the name of each gene indicates the orientation of transcription. The GAR22 and RRP22 genes are described in Zucman et al. (ref. 18; European Molecular Biology Laboratory accession nos. Y07846 and Y07847). Gray boxes represent repetitive sequences, and black boxes represent exons.
Figure 2.
Distribution of the positions of the chromosome 22 and 11 junctions observed on 77 der(22). The reference sequences of the EWS and FLI-1 gene are represented along the x and y axes, respectively (European Molecular Biology Laboratory accession nos. Y07848 and Y17293; note that the x and y axes have different scales). Each point represents a der(22) junction of a single ET. Its x and y coordinates correspond to the position of the chromosome 22 and 11 junctions obtained from the two reference sequences, respectively. EWSR1A and EWSR1B correspond to the two subregions of EWSR1 in which breakpoints were observed on chromosome 22. Similarly, EWSR2 is defined as the breakpoint region on chromosome 11. Gray boxes represent repetitive sequences, and black boxes represent exons.
For each of the 77 tumors, the position of the junction on chromosome 22 was examined in relation to that of chromosome 11, and no significant correlation was observed (r = 0.06, P > 0.6, Fig. 2). For each der(22) junction, 120-bp sequences centered around the junction point were extracted from the normal chromosome 22 and 11 sequences and were analyzed with a dot matrix program (DNA strider). The distribution of direct or inverted repeats ≥4 bp was similar to that observed on a simulation generated by randomly breaking and rejoining the intron 2 of adenosine deaminase (accession no. M13792) and the intron 5 of factor XIII (accession no. M64554) sequences. Thus, this procedure failed to reveal obvious intra- or interchromosomal homology in the vicinity of the breakpoints, indicating that the t(11;22) translocation may not involve homologous or homeologous recognition processes. The positions of candidate recombination sequences [topoisomerase I and II, translin, heptamer/nonamer, chi consensus, Alu, alternating purine/pyrimidine sequences, palindromic, polypurine, and polypyrimidine sequences (1–11)] were not correlated with those of the junction points. The r’mes (23) and maca (24) programs applied to the entire EWSR1 and EWSR2 regions failed to reveal any consistent consensus sequences within 100 bases of the junction points. Thus, the t(11, 22) translocations associated with ET met criteria for an interchromosomal recombination involving an illegitimate process without site-specific recombination.
Comparative Analysis of der(22) and der(11) Junctions.
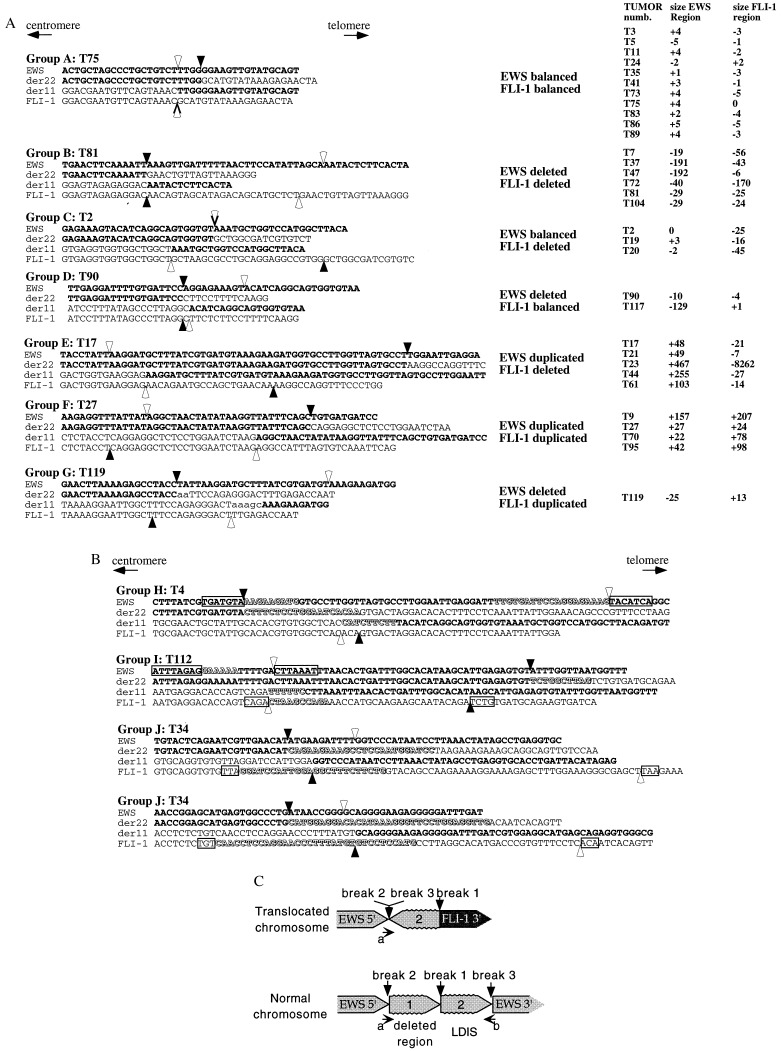
To perform a joint analysis of the junction sequences of both chromosome derivatives from the same tumor, a multiplex PCR approach similar to that used for sequencing the der(22) breakpoint regions was used to amplify the der(11) junction sequences. This strategy succeeded in 36 of the 77 tumors (47%). Molecular observations of deletion of the der(11) and of complex rearrangement involving this derivative (13, 25) in at least 20% of ET may explain this lower rate of success as compared with that obtained for the der 22. Most translocations resulted in the simple juxtaposition of chromosome 22 and 11 sequences, each frequently associated with local deletion or duplication (Fig. 3A, groups A–G). In one such tumor (T 89) the FLI-1 and EWS sequences on the der11 were linked through a 140-bp DNA sequence of unknown origin that included an 88-bp Alu-J element. Eleven tumors exhibited small duplication and/or deletion events (≤5 bp; Fig. 3A, group A), and the corresponding translocations were classified as balanced for both genes. However, most tumors demonstrated either large deletions (mean size of 56 bp and maximum size of 8,262 bp) or duplications (mean size of 118 bp and maximum size of 467 bp; Fig. 3A, groups B–G), or both. Almost all combinations of balanced, duplication, and deletion events were observed and appeared equally distributed on either chromosome. Analysis of eight derivative chromosomes from four tumors showed a more complex pattern involving, on six occasions, the insertion at the junction of a locally derived inverted sequence (termed LDIS), which ranged in size from 6 to 34 bases (Fig. 3B).
Figure 3.
Sequence analysis of the chromosome junctions established for both derivatives of 36 ET caring a t(11;22). Classification of tumors is indicated on the left, together with an example for each group. Black and white arrows indicate, on the normal EWS and FLI-1 sequences, the location of the der(22) and der(11) breakpoints, respectively. (A) “Simple” translocations. A gene (either EWS or FLI-1) is classified as taking part in a balanced event when the size of the region of the gene that is absent (deleted) or present (duplicated) on both derivatives is ≤5 bp. The sizes of these regions in bp are indicated for all cases on the right side with a plus sign for a duplicated region and a minus sign for a deleted region. (B) “Complex” translocations. The latter translocations incorporate an LDIS (locally derived inverted sequence; see text) in at least one derivative chromosome. The LDIS is represented by shadowed characters. Short inverted repeats are boxed. (C) A schematic representation of an LDIS on the derivative chromosome and on the normal chromosome from which it is derived (prototype is the der 22 of tumor 4 in group H). Arrows a and b represent short inverted repeats. The region to be deleted is centromeric to the LDIS when the chromosome of origin of the LDIS and the derivative chromosome on which the LDIS is observed have the same centromere (case shown here). Otherwise, the region to be deleted lies telomeric to the LDIS.
The sequence context where LDIS were observed exhibited a striking group of characteristic features. Identification of an LDIS defines three breakpoints on the normal chromosome from which it is derived (Fig. 3C). On the translocated chromosome, breakpoint 1 is at one end of the LDIS and lies at the interchromosomal junction. Breakpoints 2 and 3 are both at the other end of the LDIS and mark the limits of the intrachromosomal rearrangement. For the six junctions with a LDIS, the positions of these three breakpoints have an identical pattern. With reference to the sequence of the normal chromosome (Fig. 3C), breakpoint 1 lies invariably between one end of the LDIS and that of a constantly deleted region (6 to 51 bases in size). Before the translocation, the region to be deleted lies centromeric to the sequence to be inverted when the LDIS is not translocated [i.e., the chromosome of origin and the derivative chromosome carrying the LDIS possess the same centromere, tumor H, der(22)]. Reciprocally, the region to be deleted lies telomeric to the sequence to be inverted in the five cases where the LDIS is translocated (Fig. 3B). In all cases, breakpoints 2 and 3 occur in short inverted repeats (3 to 7 bp) or at their boundaries (Fig. 3 B and C). One of these inverted repeats is deleted systematically in each junction exhibiting an LDIS. Taken together, these observations impose stringent constraints on the underlying mechanism that gives rise to an LDIS. In a given tumor, one or two LDIS could be derived either from chromosome 11, from chromosome 22, or from both and could be located either on the der(11) or on the der(22) or on both derivatives. Thus, before their joining, each of the four chromosomal ends may have been processed independently of the others.
Basis of an Illegitimate Recombination Model.
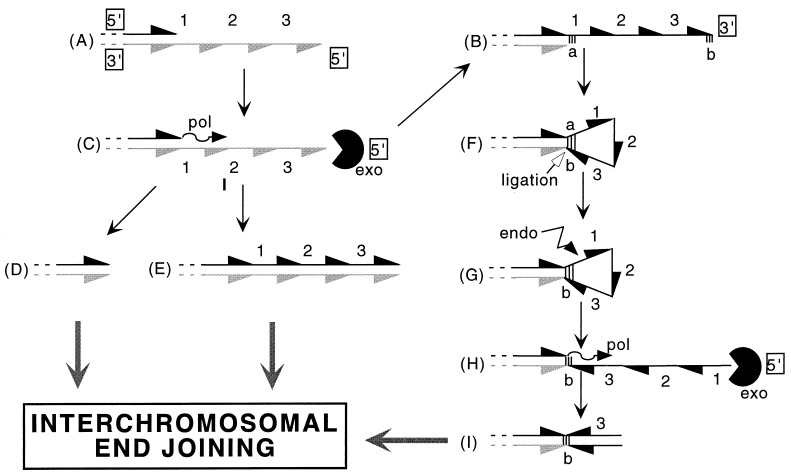
The current double strand break recombination models (26) suggest an explanation for the presence of balanced translocations or of deletions associated with the translocations classified in groups A to D (Fig. 3A) but fail to explain the presence of duplication whether or not associated with an LDIS (Fig. 3 A and B, groups E–J). In contrast, a simple model of illegitimate recombination may account for all of the junctions observed (Fig. 4). According to this model, the primary event in nonbalanced translocations is the generation, independently on each chromosome to undergo translocation, of double strand breaks that generate, either directly or after the action of exonucleases, protruding ends (Fig. 4, intermediates A and B). It is suggested from the analysis of mutations occurring in the rad27 mutant of Saccharomyces cerevisiae (27) and the analysis of minisatellite instability in humans (28) that single stranded ends do occur in eukaryotes during recombination processes. Subsequently, in the present model, each protruding end may be processed independently by the combined action of DNA polymerases and of 5′-to-3′ exonucleases (Fig. 4, intermediate C). Depending on the ratio of these two activities, three basic categories of molecules may be generated from a 5′ protruding end (Fig. 4, intermediates B, D, and E). Only a molecule with an initial 5′ protruding end would lead to duplication. LDIS may be generated from 3′ protruding ends by the formation of a hairpin, stabilized by constantly observed short inverted repeats followed by strand filling and interstrand ligation (Fig. 4, intermediate F). Subsequent opening of the loop followed by a combination of exonuclease and strand-filling activities causes the observed systematic deletion and generates the LDIS (Fig. 4, intermediates G–I). This mechanism accounts for all observed characteristic features associated with LDIS. Finally, interchromosomal ligation of the various intermediates D, E, and I (Fig. 4) generates directly, or, on rare occasions, after the addition of a small number of bases, all observed types of chromosomal junctions (Fig. 3 A and B). It is unlikely that microhomology at the junction plays a major role for end joining because only 9 of 113 junctions demonstrated three (at most five) identical base pairs at the end of the chromosome fragments.
Figure 4.
Model for single strand processing and the hairpin formation in illegitimate recombination. (Steps A and B) 5′ or 3′ protruding ends produced either by a staggered double nick or by exonuclease processing of blunt extremities. (Step C) 5′ single strand ends are substrates for the combined action of DNA polymerase and 5′-3′ exonuclease generating blunt deleted (step D) and repaired (step E) molecules. Predominance of a 3′-5′ exonuclease activity may generate 3′ protruding ends (Step B). (Step F) An intermediate structure with an interstrand hairpin stabilized by short inverted repeats (hatched regions a and b) is the site of a ligation reaction generating a covalent interstrand hairpin structure. (Step G) The hairpin is opened by endonucleolytic cleavage, generating a single-stranded inverted sequence. (Step H) Processing similar to that of step C. Intermediates D, E, and I are the immediate precursors for the interchromosomal ligation.
Physiological recombination has been shown to require either site-specific sequence signals or stretches of homology between recombining molecules. Extensive studies of chromosome translocations in hematological neoplasms and the resulting emphasis on the involvement of heptamer/nonamer sequences (1) and translin consensus sequences (2) have promoted the search for putative recombination signals at the translocated chromosome junctions in tumors of various origins (3–11). Although associations occasionally have been reported, the actual involvement of such candidate sequences has not been evaluated in specific tumor types by systematic studies of large series. The present work demonstrates, however, that the mechanism at work for the recurrent t(11, 22) translocation of ET relies neither on homology nor on site specific recombination signals. In contrast, it provides observations supporting the involvement of a mechanism of illegitimate recombination based on the independent generation of single strand DNA ends that are processed individually before interchromosomal joining. Numerous interchromosomal rearrangements that are observed in a large variety of tumor types should be evaluated for evidence of illegitimate recombination as described in this report.
Acknowledgments
We are grateful to the following clinicians and pathologists for providing tumor samples: J.-M. Coindre, F. Doz, J. Michon, P. Pouillart, E. Quintana, P. Vielh, G. Lenoir, K. Patel, J,-M, Zucker, T. J. Triche, D. Sheer, C. Turc-Carel, P. Ambros, and V. Combaret. We thank H. Cann and P. Radicella for helpful discussions and critical reading of the manuscript. This work was supported by a grant from Groupe de Recherche et d’Etude des Génomes.
ABBREVIATIONS
- ET
Ewing’s tumor
- kb
kilobase
Footnotes
References
- 1. Finger L R, Harvey R C, Moore R C, Showe L C, Croce C M. Science. 1986;234:982–985. doi: 10.1126/science.3490692. [DOI] [PubMed] [Google Scholar]
- 2.Aoki K, Suzuki K, Sugano T, Tasaka T, Nakahara K, Kuge O, Omori A, Kasai M. Nat Genet. 1995;10:167–174. doi: 10.1038/ng0695-167. [DOI] [PubMed] [Google Scholar]
- 3.Bullock P, Champoux J J, Botchan M. Science. 1985;230:954–958. doi: 10.1126/science.2997924. [DOI] [PubMed] [Google Scholar]
- 4.Sperry A O, Blasquez V C, Garrard W T. Proc Natl Acad Sci USA. 1989;86:5497–5501. doi: 10.1073/pnas.86.14.5497. [DOI] [PMC free article] [PubMed] [Google Scholar]
- 5.Broeker P L, Super H G, Thirman M J, Pomykala H, Yonebayashi Y, Tanabe S, Zeleznik-Le N, Rowley J D. Blood. 1996;87:1912–1922. [PubMed] [Google Scholar]
- 6.Krowczynska A M, Rudders R A, Krontiris T G, de Klein A, van Agthoven T, Groffen C, Heisterkamp N, Groffen J, Grosveld G. Nucleic Acids Res. 1986;14:7071–7082. doi: 10.1093/nar/14.17.7071. [DOI] [PMC free article] [PubMed] [Google Scholar]
- 7.de Klein A, van Agthoven T, Groffen C, Heisterkamp N, Groffen J, Grosveld G. Nucleic Acids Res. 1986;14:7071–7082. doi: 10.1093/nar/14.17.7071. [DOI] [PMC free article] [PubMed] [Google Scholar]
- 8.Chen S J, Chen Z, d’Auriol L, Le Coniat M, Grausz D, Berger R. Oncogene. 1989;4:195–202. [PubMed] [Google Scholar]
- 9.Boehm T, Mengle-Gaw L, Kees U R, Spurr N, Lavenir I, Forster A, Rabbitts T H. EMBO J. 1989;8:2621–2631. doi: 10.1002/j.1460-2075.1989.tb08402.x. [DOI] [PMC free article] [PubMed] [Google Scholar]
- 10.Nicholls R D, Fischel-Ghodsian N, Higgs D R. Cell. 1987;49:369–378. doi: 10.1016/0092-8674(87)90289-3. [DOI] [PubMed] [Google Scholar]
- 11.Camerini-Otero R D, Hsieh P. Cell. 1993;73:217–223. doi: 10.1016/0092-8674(93)90224-e. [DOI] [PubMed] [Google Scholar]
- 12.Delattre O, Zucman J, Plougastel B, Desmaze C, Melot T, Peter M, Kovar H, Joubert I, De Jong P, Rouleau G. Nature (London) 1992;359:162–165. doi: 10.1038/359162a0. [DOI] [PubMed] [Google Scholar]
- 13.Zucman J, Melot T, Desmaze C, Ghysdael J, Plougastel B, Peter M, Zucker J M, Triche T J, Sheer D, Turc-Carel C. EMBO J. 1993;12:4481–4487. doi: 10.1002/j.1460-2075.1993.tb06137.x. [DOI] [PMC free article] [PubMed] [Google Scholar]
- 14.Jeon I S, Davis J N, Braun B S, Sublett J E, Roussel M F, Denny C T, Shapiro D N. Oncogene. 1995;10:1229–1234. [PubMed] [Google Scholar]
- 15.Peter M, Couturier J, Pacquement H, Michon J, Thomas G, Magdelenat H, Delattre O. Oncogene. 1997;14:1159–1164. doi: 10.1038/sj.onc.1200933. [DOI] [PubMed] [Google Scholar]
- 16.Kaneko Y, Yoshida K, Handa M, Toyoda Y, Nishihira H, Tanaka Y, Sasaki Y, Ishida S, Higashino F, Fujinaga K. Genes Chromosomes Cancer. 1996;15:115–121. doi: 10.1002/(SICI)1098-2264(199602)15:2<115::AID-GCC6>3.0.CO;2-6. [DOI] [PubMed] [Google Scholar]
- 17.Zucman J, Delattre O, Desmaze C, Plougastel B, Joubert I, Melot T, Peter M, De Jong P, Rouleau G, Aurias A. Genes Chromosomes Cancer. 1992;5:271–277. doi: 10.1002/gcc.2870050402. [DOI] [PubMed] [Google Scholar]
- 18.Zucman-Rossi J, Legoix P, Thomas G. Genomics. 1996;38:247–254. doi: 10.1006/geno.1996.0625. [DOI] [PubMed] [Google Scholar]
- 19.Engels W R. Trends Biochem Sci. 1993;18:448–450. doi: 10.1016/0968-0004(93)90148-g. [DOI] [PubMed] [Google Scholar]
- 20.Jurka J, Klonowski P, Dagman V, Pelton P. Comput Chem. 1996;20:119–121. doi: 10.1016/s0097-8485(96)80013-1. [DOI] [PubMed] [Google Scholar]
- 21.Lopez R, Larsen F, Prydz H. Genomics. 1994;24:133–136. doi: 10.1006/geno.1994.1590. [DOI] [PubMed] [Google Scholar]
- 22.Forrester W C, Epner E, Driscoll M C, Enver T, Brice M, Papayannopoulou T, Groudine M. Genes Dev. 1990;4:1637–1649. doi: 10.1101/gad.4.10.1637. [DOI] [PubMed] [Google Scholar]
- 23.Schbath S, Prum B, de Turckheim E, Ulyanov A V, Stormo G D. Nucleic Acids Res. 1995;23:1434–1440. doi: 10.1093/nar/23.8.1434. [DOI] [PMC free article] [PubMed] [Google Scholar]
- 24.Ulyanov A V, Stormo G D. Nucleic Acids Res. 1995;23:1434–1440. doi: 10.1093/nar/23.8.1434. [DOI] [PMC free article] [PubMed] [Google Scholar]
- 25.Turc-Carel C, Aurias A, Mugneret F, Lizard S, Sidaner I, Volk C, Thiery J P, Olschwang S, Philip I, Berger M P. Cancer Genet Cytogenet. 1988;32:229–238. doi: 10.1016/0165-4608(88)90285-3. [DOI] [PubMed] [Google Scholar]
- 26.Szostak J W, Orr-Weaver T L, Rothstein R J, Stahl F W. Cell. 1983;33:25–35. doi: 10.1016/0092-8674(83)90331-8. [DOI] [PubMed] [Google Scholar]
- 27.Tishkoff D X, Filosi N, Gaida G M, Kolodner R D. Cell. 1997;88:253–263. doi: 10.1016/s0092-8674(00)81846-2. [DOI] [PubMed] [Google Scholar]
- 28.Buard J, Vergnaud G. EMBO J. 1994;13:3203–3210. doi: 10.1002/j.1460-2075.1994.tb06619.x. [DOI] [PMC free article] [PubMed] [Google Scholar]


