Abstract
A dynamic balance of organelle fusion and fission regulates mitochondrial morphology. During apoptosis this balance is altered, leading to an extensive fragmentation of the mitochondria. Here, we describe a novel assay of mitochondrial dynamics based on confocal imaging of cells expressing a mitochondrial matrix–targeted photoactivable green fluorescent protein that enables detection and quantification of organelle fusion in living cells. Using this assay, we visualize and quantitate mitochondrial fusion rates in healthy and apoptotic cells. During apoptosis, mitochondrial fusion is blocked independently of caspase activation. The block in mitochondrial fusion occurs within the same time range as Bax coalescence on the mitochondria and outer mitochondrial membrane permeabilization, and it may be a consequence of Bax/Bak activation during apoptosis.
Keywords: dynamin; fission; Opal; PAGFP; photoactivation
Introduction
Mitochondria form dynamic interconnected networks, and the relative rates of mitochondrial fusion and fission have been implicated in the regulation of their number, size, and shape (Mozdy and Shaw, 2003; Scott et al., 2003). Fragmentation of mitochondria occurs upon induction of apoptosis (Karbowski and Youle, 2003), and it has been suggested that activation of the mitochondrial fission machinery is one of the primary triggers of this process (Frank et al., 2001; Breckenridge et al., 2003). However, under physiological conditions, mitochondrial fission is counteracted by fusion leading to a dynamic stability of the mitochondrial network (Mozdy and Shaw, 2003; Scott et al., 2003), suggesting that mitochondrial fusion may be stimulated in response to the activation of fission machinery during apoptosis. In this report, we analyze the dynamics of mitochondria in healthy and apoptotic cells by visualization and quantification of mitochondrial fusion using a novel assay based on the dilution rate of mitochondria-targeted photoactivable GFP (mito-PAGFP; Patterson and Lippincott-Schwartz, 2002).
Results and discussion
Direct visualization of mitochondrial fusion within single living cells
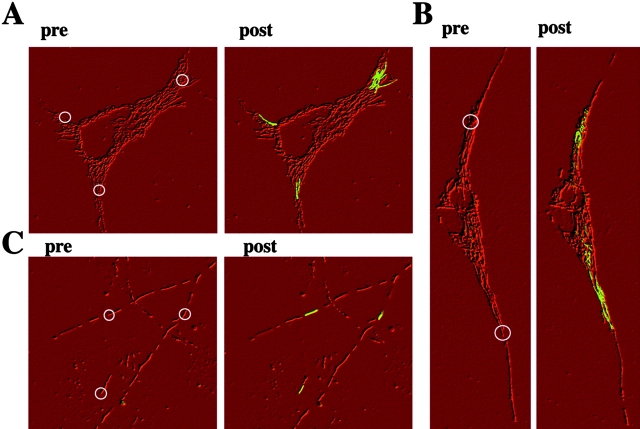
We explored the potential of mitochondrial matrix–targeted photoactivable GFP (PAGFP) to assay individual mitochondria fusion and fission events. PAGFP is a variant of the Aequorea victoria GFP that, after irradiation with 413-nm light, increases fluorescence ∼100 times when excited with 488-nm light (Patterson and Lippincott-Schwartz, 2002). PAGFP was fused to the mitochondrial matrix targeting sequence from subunit VIII of cytochrome c oxidase (mito-PAGFP). Low intensity 488-nm fluorescent patterns colocalized with the red fluorescent marker of the mitochondrial matrix, mito-DsRED2; in HeLa cells (Fig. 1 A), human primary myocytes (Fig. 1 B), rat hippocampal neurons (Fig. 1 C), and several other cell types (not depicted) transfected with mito-PAGFP (Fig. 1, A–C, pre). Photoactivation of regions of interest (ROIs; Fig. 1, white circles) by a short impulse of 413-nm light within mito-DsRED2–expressing mitochondria, followed by three-dimensional (3D) confocal imaging, revealed a dramatic increase in the green fluorescence localized within the mitochondrial network (Fig. 1, A–C, post) after excitation with 488-nm light confirming the proper mitochondrial localization and photoactivation of the mito-PAGFP fusion protein. The photoactivated protein redistributed, within seconds, out of the activation ROIs, but within restricted tubular shapes showing rapid diffusion of GFP in the mitochondrial matrix. The highest degree of mitochondrial connectivity was observed in myocytes (Fig. 1 B), an intermediate degree in HeLa (Fig. 1 A), Cos-7 cells, and primary fibroblasts (not depicted), and the lowest degree in the processes of primary hippocampal neurons (Fig. 1 C).
Figure 1.
Photoactivation and visualization of mito-PAGFP. HeLa cells (A), primary myocytes (B), and primary hippocampal neurons (C) were cotransfected with mito-DsRED2 (showing the mitochondria processed in Adobe Photoshop with emboss filter) and mito-PAGFP (green). To photoactivate PAGFP, regions marked with white circles (pre) were irradiated with 413-nm light as described in Materials and methods. Mito-PAGFP was imaged using 488-nm laser excitation before (pre) and ∼30 s after (post) the 413-nm light photoactivation. Note the increase in the fluorescence of mito-PAGFP within the vicinity of the photoactivated area.
Mitochondrial fusion assays based on the fusion of two haploid cells of opposite mating types with mitochondria labeled by spectrally different fluorescent probes (e.g., GFP and RFP), followed by detection of mixing and colocalization of fluorescent probes that occurs on fusion of mitochondria from both parental cells, have been applied in yeast (Mozdy and Shaw, 2003). Use of a similar strategy in mammalian cells has been also reported. However, in mammalian systems, treatment with polyethylene glycol and cycloheximide (Legros et al., 2002; Chen et al., 2003; Mattenberger et al., 2003) or viral infection (Ishihara et al., 2003) have to be applied to activate cell fusion. These conditions preclude data collection under normal growth and make it impossible to analyze mitochondrial fusion in cell types that cannot be fused in culture or during dynamic changes of growth conditions. It has been shown that under aerobic conditions photoactivated PAGFP remains stable for days (Patterson and Lippincott-Schwartz, 2002); consequently, when properly targeted it could serve as a potential tool for detection over time of single or several organelles within a cell. To test the applicability of mito-PAGFP as a probe for mitochondrial fusion, we activated ROIs with 413-nm light and performed 3D time-lapse confocal microscopy. An intramitochondrial exchange of matrix components that could occur as a result of mitochondrial fusion is detected in hippocampal neurons (Fig. 2 A), HeLa cells (Fig. 2, A and B), and several other cell types (not depicted). Mitochondrial fusion-related matrix redistribution and changes in the fluorescence intensity of mito-PAGFP are highlighted in the pseudocolored images (Fig. 2 B, right) where fusion of photoactivated “white” mitochondria with nonactivated “purple” organelles is followed by the formation of the “yellow/green” intermediates.
Figure 2.
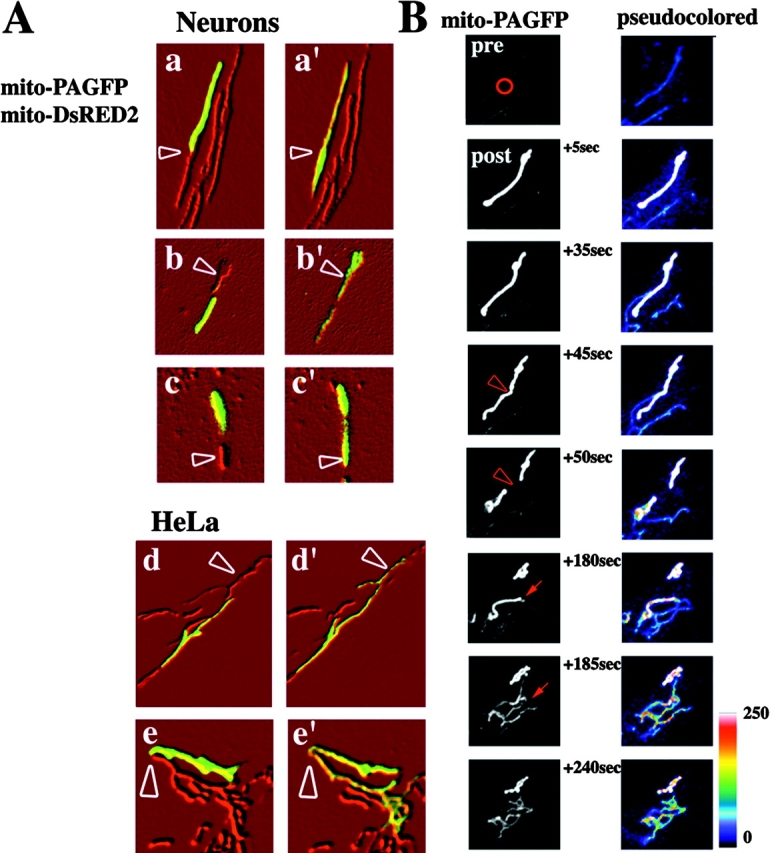
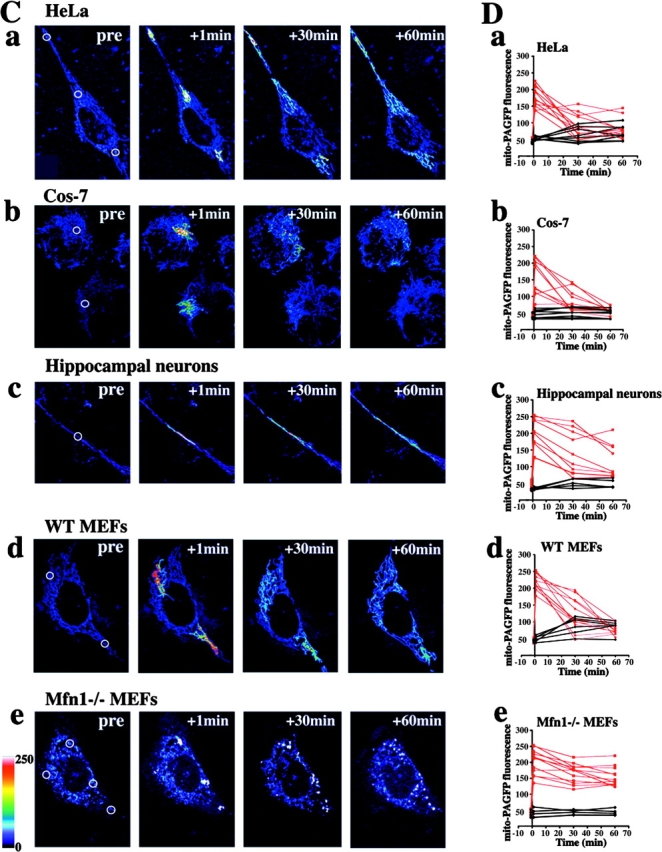
Visualization and quantification of mitochondrial fusion using mito-PAGFP. (A) Primary hippocampal neurons (a–c) and HeLa cells (d–e) were cotransfected with mito-DsRED2 (shown processed in Adobe Photoshop with emboss filter) and mito-PAGFP (green). Mito-PAGFP within some of the mitochondria was activated with 413-nm light followed by time-lapse 3D confocal microscopy. Activated and nonactivated mitochondria (arrowheads) are shown 30 s before (a–e) and after (a'–e') mitochondrial fusion and intramitochondrial exchange of matrix contents (visualized by an increase in the amount of activated mito-PAGFP in nonactivated mitochondria). (B) The region indicated by the red circle in a mito-PAGFP–transfected HeLa cell (preactivation) was photoactivated, followed by time-lapse acquisition of images. Between 45 and 50 s the photoactivated mitochondrion divides (arrowheads), followed at 180 s by redistribution of mito-PAGFP from activated to nonactivated mitochondria (arrows,) indicating mitochondrial fusion. To highlight the fluorescence decrease in activated mitochondria and the increase in nonactivated organelles, images were false colored (right). (C) HeLa (a), Cos-7 cells (b), hippocampal neurons (c), WT MEFs (d), and Mfn1−/− MEFs (e) were transfected with mito-PAGFP, followed by photoactivation of one to four ROIs per cell (white circles) and time-lapse confocal acquisition of a series of z-sections covering the entire thickness of the cell as described in Materials and methods. Images shown are pseudocolored projections of z-series. (D) Changes in the fluorescence intensities within activated (red) and nonactivated (black) mitochondria of HeLa (a), Cos-7 (b), hippocampal neurons (c), WT MEFs (d), and Mfn1−/− MEFs (e) were measured over time as described in Materials and methods. Note the small change in fluorescence intensity of activated mito-PAGFP in Mfn1−/− MEFs even 1 h after photoactivation when redistribution of the matrix content greatly decreases fluorescence intensity of mito-PAGFP in other cell types.
Mito-PAGFP–transfected HeLa (Fig. 2, C [a] and D [a]), Cos-7 cells (Fig. 2, C [b] and D [b]), primary hippocampal neurons (Fig. 2, C [c] and D [c]), and wild-type mouse embryonic fibroblasts (WT MEFs; Fig. 2, C [d] and D [d]) were analyzed over time after photoactivation of small clusters of mitochondria (Fig. 2, white circles). In HeLa cells observed 30 min after photoactivation most of the activated mitochondria had gone through at least one fusion event (52 out of 58 analyzed mitochondrial ROIs), resulting in a partial or complete disappearance of high-fluorescence photoactivated mitochondria. At 1 h after photoactivation there was complete disappearance of the original high-fluorescence mitochondria associated with a slight increase in the fluorescence of the whole mitochondrial network compared with preactivation values (Fig. 2 C, a), indicating a very high rate of mitochondrial fusion. A slower fusion rate is seen in neurons (16 out of 60 analyzed mitochondrial ROIs did not fuse after 1 h; Fig. 2 C, c). To confirm that the decrease in fluorescence of individual mitochondria was due to mitochondrial fusion, mixing and dilution of matrix contents were examined in cells lacking a crucial component of the mitochondrial fusion machinery, Mfn1 (Fig. 1, C [e] and D [e]; Chen et al., 2003). These cells that have punctate mitochondria due to inhibition of fusion and unrestrained fission displayed little or no decrease in mito-PAGFP fluorescence within photoactivated mitochondria over time (Fig. 2, C [e] and D [e]), validating the conclusion that the redistribution and changes in the mito-PAGFP fluorescence reflects mitochondrial fusion.
The aforementioned experiments enable for the first time the visualization in real-time of mitochondrial fusion in cultured cells and establish the applicability of confocal imaging of mito-PAGFP as an efficient way to quantitate the dynamics of the mitochondrial network in living cells. It has been reported that complete fusion of mitochondria assayed by the cell fusion method occurred 7–24 h after cytoplasmic fusion, with some mitochondrial fusion events detectable within 90–120 min (Legros et al., 2002; Chen et al., 2003; Mattenberger et al., 2003). Our results suggest that efficient mixing of matrix content under normal cell growth conditions occurs at a much higher rate. Average fluorescence intensities of photoactivated and nonactivated mitochondria in HeLa, Cos-7, primary hippocampal neurons, WT MEFs, and Mfn1−/− MEFs were measured and plotted against time after photoactivation (Fig. 2 D). A gradual decrease in the fluorescence of photoactivated mitochondria leading to an equilibration of activated and nonactivated mitochondria is clearly visible in HeLa (t 1/2 [mito-PAGFP fluorescence decrease] = 28.5 ± 8.5 min), Cos-7 cells (t 1/2 = 27.3 ± 5.8 min), and WT MEFs (t 1/2 = 31.2 ± 13.5 min), but not in Mfn1−/− cells (t 1/2 > 60 min). Distinctly lower values were obtained with hippocampal neurons (t 1/2 = 60.7 ± 14 min), reflecting a slower fusion rate.
Inhibition of mitochondrial fusion upon activation of apoptosis
Several recent works describe decreases of the mitochondrial network connectivity occurring early during apoptosis (Frank et al., 2001; Pinton et al., 2001; Karbowski et al., 2002; Breckenridge et al., 2003; James et al., 2003), suggesting a role of mitochondrial fission/fusion mediators in the regulation of some steps of this process. Although it has been reported that Drp1 and the fission machinery can participate (Frank et al., 2001; Breckenridge et al., 2003; James et al., 2003), the mechanism of the apoptotic fragmentation of mitochondria is not known. Inhibition of caspases by the broad specificity caspase inhibitor zVAD-fmk, which has been reported to effectively inhibit functional deterioration of mitochondria including the increase in reactive oxygen species generation and the loss of ΔΨm (Ricci et al., 2003), does not affect mitochondrial fragmentation occurring during apoptosis (Karbowski and Youle, 2003). Mitochondrial shape and networks are a result of precise balancing of fusion and fission events, and it is believed that changes in the activity of fusion affects the dynamics of fission, and vice versa, leading to the tubular morphology of mitochondria. The fragmentation of mitochondria during apoptosis could be due to activation of fission, as has been suggested previously (Frank et al., 2001; Breckenridge et al., 2003), an inhibition of fusion, or both. Therefore, we examined the mitochondrial fusion rate in cells challenged with staurosporine (STS) and actinomycin D (ActD), stimuli known to activate Bax and Bak and, consequently, the mitochondria-dependent apoptotic pathway (Wei et al., 2001).
HeLa cells transfected with mito-PAGFP were pretreated with 75 μM zVAD-fmk and treated with 12.5 μM ActD or 1 μM STS, followed by activation of mito-PAGFP within several cells at 1, 60, and 120 min and imaging of mitochondrial fusion in several cells over time. Control cells show unaltered mitochondrial fusion dynamics after three photoactivations over 180 min (Fig. 3, A and F). However, treatment with ActD (Fig. 3, B and F) or STS (Fig. 3, C and F) leads to the formation of two distinct groups of cells that could be clearly distinguished after the third activation: those with a fusion rate the same as untreated HeLa cells and those showing a complete inhibition of fusion.
Figure 3.
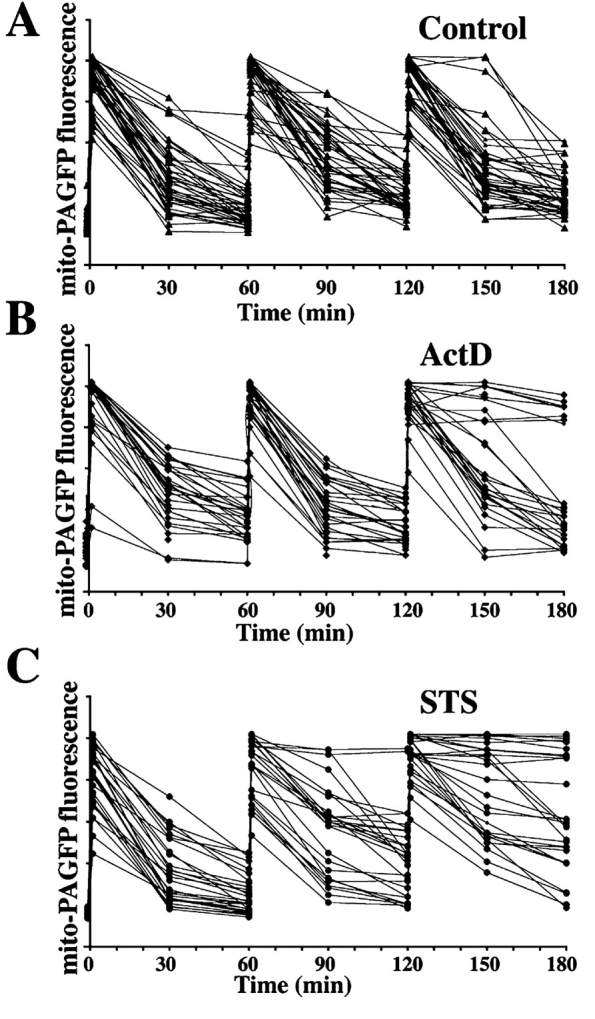
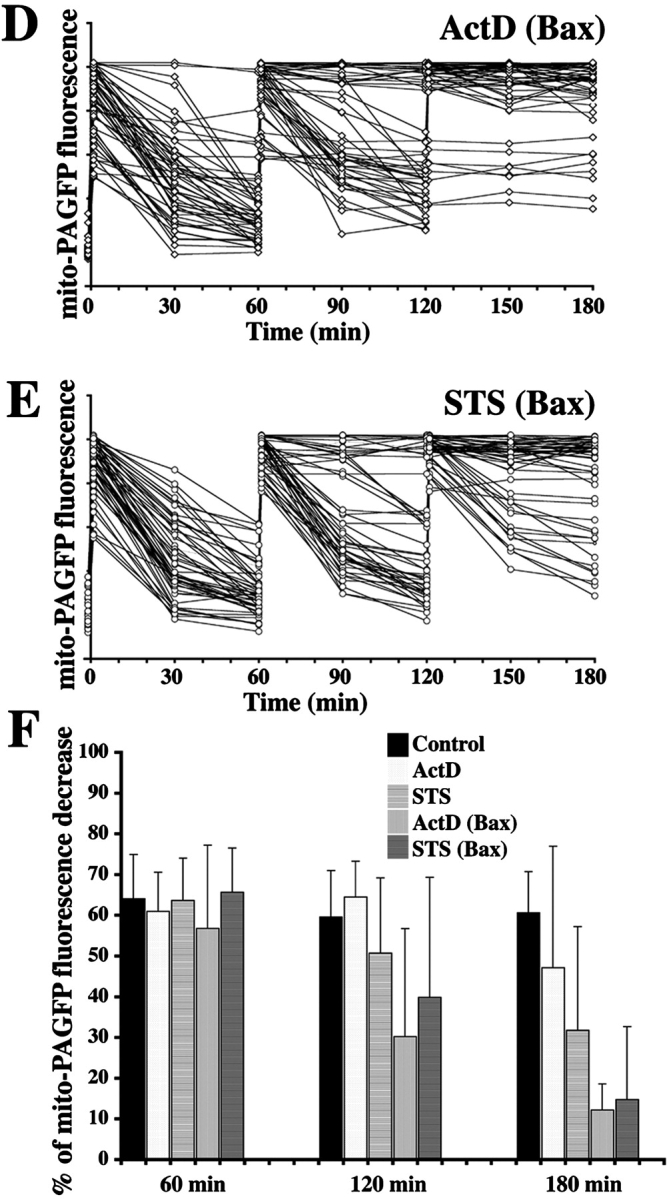
Inhibition of mitochondrial fusion during apoptosis. HeLa cells transfected with mito-PAGFP alone (A–C) or cotransfected with mito-PAGFP and CFP-Bax (D and E) pretreated with 75 μM zVAD-fmk and treated with diluent, DMSO (A), ActD (B and D), or STS (C and E) were analyzed for mitochondrial fusion. Images were collected every 30 min over 180 min after photoactivation at 1, 60, and 120 min. Fluorescence intensity of mito-PAGFP at each time point was measured and plotted against time. (F) Values of percent mito-PAGFP fluorescence decrease after 1, 60, and 120 min in each experimental group were plotted against time. The data represent the mean ± SD of 32–52 single cell time-lapse measurements per group.
During apoptosis, Bax translocates from the cytosol to mitochondria where it clusters at mitochondrial scission sites (Karbowski et al., 2002). Bax coalesces, together with another proapoptotic protein from the Bcl-2 family, Bak, into foci (Nechushtan et al., 2001) that colocalize with Mfn2 and Drp1 (Karbowski et al., 2002), proteins that participate in the regulation of mitochondrial dynamics. Therefore, we analyzed mito-PAGFP dilution rates in ActD- and STS-treated cells cotransfected with mito-PAGFP and Bax (Fig. 3, D–F). Increased Bax expression distinctly accelerates STS- and ActD-induced loss of mitochondrial fusion correlating the degree of apoptosis with the degree of inhibition of mitochondrial fusion.
We compared the time of Bax translocation with that of mitochondrial fusion rate changes. HeLa cells were cotransfected with mito-PAGFP and CFP-Bax, treated with broad specificity caspase inhibitor, 75 μM zVAD-fmk, and 1 μM STS, and analyzed with time-lapse 3D confocal microscopy, starting immediately after addition of STS (Fig. 4). Initially, STS did not affect the mitochondrial fusion rate; however, complete inhibition of fusion occurred abruptly when mitochondrial clustering of Bax became detectable (Fig. 4 A, i), showing that inhibition of the mitochondrial fusion machinery is temporally linked to the activation of proapoptotic members of the Bcl-2 family and is not dependent on caspase activation. We also tested the effect of a CFP-tagged mutant of Bax, BaxS184V, that constitutively localizes to and circumscribes mitochondria in healthy cells before activation and foci formation during apoptosis (Nechushtan et al., 1999). CFP-BaxS184V did not affect mitochondrial fusion dynamics in untreated, healthy cells, suggesting that mitochondrial translocation of Bax, per se, is not sufficient to inhibit fusion and that conformational changes and foci formation are required (unpublished data).
Figure 4.
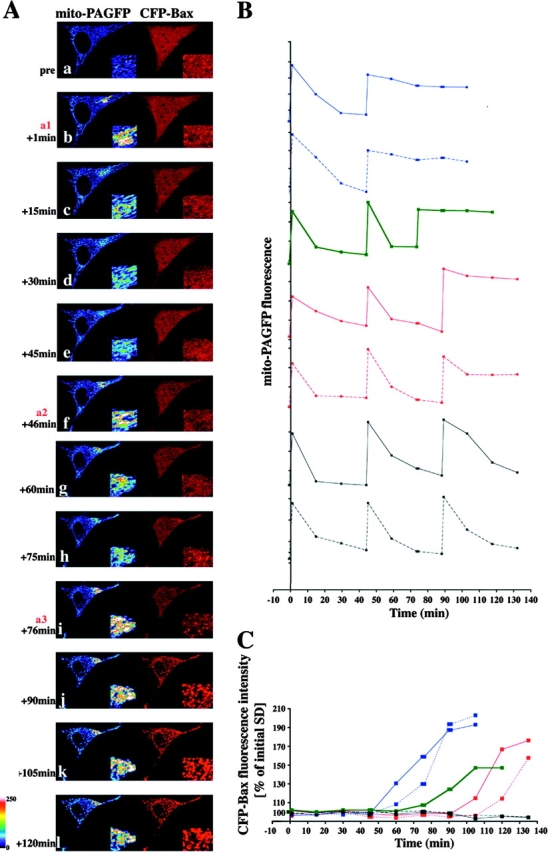
Inhibition of mitochondrial fusion upon mitochondrial activation of Bax. (A) HeLa cells were cotransfected with mito-PAGFP (pseudocolored) and CFP-Bax (red), treated with 75 μM zVAD-fmk, and, after addition of 1 μM STS, followed by the sequential photoactivation of selected regions (a1, a2, and a3) and acquisition of serial images. In the example shown, two sequential photoactivations (b and f) are followed by an efficient fusion and redistribution of mito-PAGFP. After 76 min following the addition of STS (i), when mitochondrial Bax translocation became evident, there was no matrix exchange indicating inhibition of mitochondrial fusion. Insets show magnified mito-PAGFP and CFP-Bax fluorescence within photoactivated area of the cell. (B) Changes in the average fluorescence intensities of mito-PAGFP in representative cells after STS addition and serial photoactivations as in A. (C) Homogeneity of CFP-Bax, reflecting activation and clustering of Bax (see Materials and methods) within cells shown in B, were measured over time and plotted against the time. The same color and pattern lines in B and C were obtained from the same cells. Dynamics of mitochondrial fusion and Bax coalescence of the cell shown in A is depicted by the green lines in B and C. Note correlation of the time of Bax translocation and mitochondrial fusion inhibition in each case.
In addition, when ActD and etoposide-treated cells were stained for activation of endogenous Bax (immunostaining with conformation-specific 6A7 antibodies [Hsu and Youle, 1998] and mitochondrial morphology by staining with Mitotracker red), there was no increase in the fragmentation of mitochondrial networks in 6A7-negative etoposide- and ActD-treated cells compared with the control untreated cells. No cells displayed intact, tubular mitochondria in 6A7 Bax–positive cells (Fig. S1; available at http://www.jcb.org/cgi/content/full/jcb.200309082/DC1), indicating a close correlation of Bax activation and mitochondrial fragmentation. Moreover, as mitochondrial accumulation of Mitotracker red is strictly ΔΨm dependent and only a small population of 6A7-positive cells lacked Mitotracker red staining (Fig. S1), apoptotic inhibition of mitochondrial dynamics does not appear to require changes in ΔΨm.
We examined the release of Smac/DIABLO-CFP from the intermembrane space, a process that has been reported to occur simultaneously with cytochrome c release (Rehm et al., 2003), relative to the inhibition of mitochondrial fusion. Mitochondrial outer membrane permeabilization (MOMP) occurred within the 15-min window required to quantitate mitochondrial fusion (Fig. 5). Thus, the three events—Bax translocation, inhibition of mitochondrial fusion, and MOMP—appear to be closely linked, temporally and perhaps mechanistically, during apoptosis.
Figure 5.
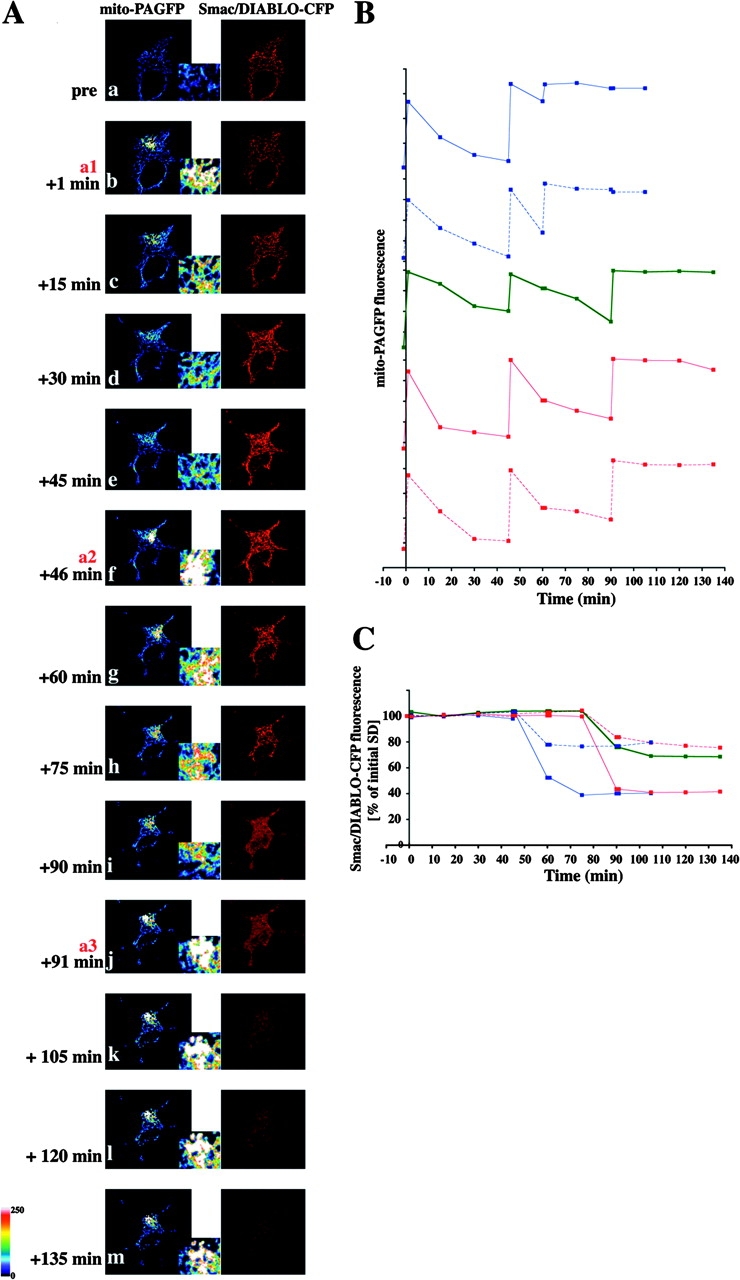
MOMP and inhibition of mitochondrial fusion. (A) HeLa cells were cotransfected with mito-PAGFP (pseudocolored), Smac/DIABLO-CFP (red), and pCDNA-Bax, treated with 75 μM zVAD-fmk, and, after addition of 1 μM STS, followed by sequential photoactivation of selected regions (a1, a2, and a3) and acquisition of serial images. Note the close temporal correlation of MOMP (i) and mitochondrial fusion inhibition. Brightness of the Smac/DIABLO-CFP images in panels i–m has been increased to visualize the release of protein more clearly. Insets show magnified mito-PAGFP fluorescence within the photoactivated area of the cell. (B) Changes in the average fluorescence intensities of mito-PAGFP in different cells after STS addition and serial photoactivations as in A. (C) Increase in homogeneity of Smac/DIABLO-CFP, reflecting release from mitochondria (see Materials and methods) within cells shown in B were measured over time and plotted against the time. The same color and pattern lines in B and C were obtained from the same cells. The cell shown in A is depicted by the green lines in B and C.
Our results suggest that inhibition of mitochondrial fusion is a general phenomenon during apoptosis that contributes to or mediates the fragmentation of mitochondria and occurs upon activation of proapoptotic members of the Bcl-2 family. Interestingly, mutations in OPA1, a component of mitochondrial fusion machinery, have been detected in patients with inherited dominant optic atrophy, a neuropathy resulting from the loss of retinal ganglion cells (Mozdy and Shaw, 2003), suggesting that inhibition or slowing down of mitochondrial fusion may contribute to the cell loss. Although the nature of the cell death leading to OPA1 mutation-induced optic atrophy is not known, it has been reported that experimental down-regulation of OPA1 by siRNA commits cells to apoptosis without any additional stimuli (Olichon et al., 2002), supporting the potential correlation of down-regulation of the mitochondrial fusion machinery and induction of apoptotic cell death. Therefore, OPA1 and other proteins participating in the regulation of mitochondrial fusion could participate in mitochondrial steps of apoptosis. The findings reported here, that a complete block in mitochondrial fusion normally occurs during apoptosis close in time to Bax translocation and MOMP, and upstream of postmitochondrial caspase activation, supports this hypothesis.
Materials and methods
Cell culture and transfection
HeLa, Cos-7, WT and Mfn1−/− MEFs, and primary human myocytes (provided by R. Raju and M. Dalakas, National Institute of Neurological Disorders and Stroke [NINDS], National Institutes of Health [NIH], Bethesda, MD) were grown as described previously (Karbowski et al., 2002; Chen et al., 2003). Rat hippocampal neurons (provided by C.A. Winters, NINDS, NIH) were cultured as described previously (Lu et al., 1998). Cells were transfected using the FuGENE (Cos-7, HeLa, and MEFs; Roche) or Effectene (myocytes and hippocampal neurons; QIAGEN) according to the manufacturers' instructions.
Expression vectors
Mito-DsRED2 and CFP-Bax constructs were performed as described previously (Karbowski et al., 2002). PAGFP-N1 vector, which was provided by G. Patterson and J. Lippincott-Schwartz (The National Institute of Child Health and Human Development, NIH; Patterson and Lippincott-Schwartz, 2002), was used to make a mitochondria-targeted version of PAGFP. The PAGFP coding region between NotI and BamHI restriction sites was inserted into a mito-GFP (BD Biosciences) vector fragment digested with the same pair of enzymes, resulting in replacement of the WTGFP coding region with PAGFP. Smac/DIABLO coding region was amplified using primers introducing XhoI site (5′-NNNNCTCGAGATGGCGGCTCTGAAGAGTTG-3′), and BamHI site (3′-NNNNGGATCCCCTCCATCCTCACGCAGGTA-5′) has been inserted into CFP-N1 vector (BD Biosciences).
Confocal microscopy and image analysis
Cells were grown in 2-well chambers for confocal microscopy (Karbowski et al., 2002). Images were captured with a microscope (model LSM 510; Carl Zeiss MicroImaging, Inc.) using a 63× 1.4 NA Apochromat objective (Carl Zeiss MicroImaging, Inc.). The excitation wavelengths for GFP, CFP, and Mitotracker red or DsRED2 were 488, 458, and 543 nm, respectively. 405- or 413-nm light was used for photoactivation of PAGFP (Patterson and Lippincott-Schwartz, 2002). ROIs were selected and series of z-sections from the top to the cell bottom with intervals between sections set to 0.5–0.75 μm were irradiated with 405- or 413-nm light. The same intervals between optical sections were used for imaging. Postacquisition processing was performed with MetaMorph software, Microsoft Excel, and Adobe Photoshop. Pixel intensity of selected regions was measured using MetaMorph software. Mitochondrial ROIs were selected in the first image collected after photoactivation (postactivation values). The same regions were transferred without change to the image obtained before photoactivation (preactivation values) or corrected for the movements of mitochondria to the following postactivation images. CFP-Bax translocation and Smac/DIABLO-CFP release from the mitochondria was quantified using increases and decreases, respectively, of the SD of the pixel intensities within analyzed cells. The initial value of SD was normalized. Data were exported to Microsoft Excel and converted into graphs.
Online supplemental material
Fig. S1 shows a correlation between the changes in the mitochondrial morphology and the release of endogenous cytochrome c from mitochondria and a conformational change in the endogenous Bax protein. Online supplemental material is available at http://www.jcb.org/cgi/content/full/jcb.200309082/DC1.
Acknowledgments
The authors thank G.H. Patterson and J. Lippincott-Schwartz for PAGFP vectors, C. Blackstone for critical reading of the manuscript, C.A. Winters for neurons, and R. Raju and M. Dalakas for myocytes.
The online version of this article includes supplemental material.
Abbreviations used in this paper: 3D, three-dimensional; ActD, actinomycin D; mito-PAGFP, mitochondria-targeted PAGFP; MOMP, mitochondrial outer membrane permeabilization; PAGFP, photoactivable GFP; ROI, region of interest; STS, staurosporine; WT MEFs, wild-type mouse embryonic fibroblasts.
References
- Breckenridge, D.G., M. Stojanovic, R.C. Marcellus, and G.C. Shore. 2003. Caspase cleavage product of BAP31 induces mitochondrial fission through endoplasmic reticulum calcium signals, enhancing cytochrome c release to the cytosol. J. Cell Biol. 160:1115–1127. [DOI] [PMC free article] [PubMed] [Google Scholar]
- Chen, H., S.A. Detmer, A.J. Ewald, E.E. Griffin, S.E. Fraser, and D.C. Chan. 2003. Mitofusins Mfn1 and Mfn2 coordinately regulate mitochondrial fusion and are essential for embryonic development. J. Cell Biol. 160:189–200. [DOI] [PMC free article] [PubMed] [Google Scholar]
- Frank, S., B. Gaume, E.S. Bergmann-Leitner, W.W. Leitner, E.G. Robert, F. Catez, C.L. Smith, and R.J. Youle. 2001. The role of dynamin-related protein 1, a mediator of mitochondrial fission, in apoptosis. Dev. Cell. 1:515–525. [DOI] [PubMed] [Google Scholar]
- Hsu, Y.T., and R.J. Youle. 1998. Bax in murine thymus is a soluble monomeric protein that displays differential detergent-induced conformations. J. Biol. Chem. 273:10777–10783. [DOI] [PubMed] [Google Scholar]
- Ishihara, N., A. Jofuku, Y. Eura, and K. Mihara. 2003. Regulation of mitochondrial morphology by membrane potential, and DRP1-dependent division and FZO1-dependent fusion reaction in mammalian cells. Biochem. Biophys. Res. Commun. 301:891–898. [DOI] [PubMed] [Google Scholar]
- James, D.I., P.A. Parone, Y. Mattenberger, and J.C. Martinou. 2003. hFis1, a novel component of the mammalian mitochondrial fission machinery. J. Biol. Chem. 278:36373–36379. [DOI] [PubMed] [Google Scholar]
- Karbowski, M., and R.J. Youle. 2003. The dynamics of the mitochondrial morphology in healthy cells and during apoptosis. Cell Death Differ. 10:870–880. [DOI] [PubMed] [Google Scholar]
- Karbowski, M., Y.-J. Lee, B. Gaume, S.-Y. Jeong, S. Frank, A. Nechushtan, A. Santel, M. Fuller, C.L. Smith, and R.J. Youle. 2002. Spatial and temporal association of Bax with mitochondrial fission sites, Drp1, and Mfn2 during apoptosis. J. Cell Biol. 159:931–938. [DOI] [PMC free article] [PubMed] [Google Scholar]
- Legros, F., A. Lombes, P. Frachon, and M. Rojo. 2002. Mitochondrial fusion in human cells is efficient, requires the inner membrane potential, and is mediated by mitofusins. Mol. Biol. Cell. 13:4343–4354. [DOI] [PMC free article] [PubMed] [Google Scholar]
- Lu, Z., M., R.S. McLaren, C. A. Winters, and E. Ralston. 1998. Ribosome association contributes to restricting mRNAs to the cell body of hippocampal neurons. Mol. Cell Neurosci. 12:363–376. [DOI] [PubMed] [Google Scholar]
- Mattenberger, Y., D.I. James, and J.C. Martinou. 2003. Fusion of mitochondria in mammalian cells is dependent on the mitochondrial inner membrane potential and independent of microtubules or actin. FEBS Lett. 538:53–59. [DOI] [PubMed] [Google Scholar]
- Mozdy, A.D., and J.M. Shaw. 2003. A fuzzy mitochondrial fusion apparatus comes into focus. Nat. Rev. Mol. Cell Biol. 4:468–478. [DOI] [PubMed] [Google Scholar]
- Nechushtan, A., C.L. Smith, Y.T. Hsu, and R.J. Youle. 1999. Conformation of the Bax C-terminus regulates subcellular location and cell death. EMBO J. 18:2330–2341. [DOI] [PMC free article] [PubMed] [Google Scholar]
- Nechushtan, A., C.L. Smith, I. Lamensdorf, S.-H. Yoon, and R.J. Youle. 2001. Bax and Bak coalesce into novel mitochondria-associated clusters during apoptosis. J. Cell Biol. 153:1265–1276. [DOI] [PMC free article] [PubMed] [Google Scholar]
- Olichon, A., L. Baricault, N. Gas, E. Guillou, A. Valette, P. Belenguer, and G. Lenaers. 2002. Loss of OPA1 perturbates the mitochondrial inner membrane structure and integrity, leading to cytochrome c release and apoptosis. J. Biol. Chem. 523:171–176. [DOI] [PubMed] [Google Scholar]
- Patterson, G.H., and J. Lippincott-Schwartz. 2002. A photoactivatable GFP for selective photolabeling of proteins and cells. Science. 297:1873–1877. [DOI] [PubMed] [Google Scholar]
- Pinton, P., D. Ferrari, E. Rapizzi, F.D. Virgilio, T. Pozzan, and R. Rizzuto. 2001. The Ca2+ concentration of the endoplasmic reticulum is a key determinant of ceramide-induced apoptosis: significance for the molecular mechanism of Bcl-2 action. EMBO J. 20:2690–2701. [DOI] [PMC free article] [PubMed] [Google Scholar]
- Rehm, M., H. Dussmann, and J.H. Prehn. 2003. Real-time single cell analysis of Smac/DIABLO release during apoptosis. J. Cell Biol. 162:1031–1043. [DOI] [PMC free article] [PubMed] [Google Scholar]
- Ricci, J.E., R.A. Gottlieb, and D.R. Green. 2003. Caspase-mediated loss of mitochondrial function and generation of reactive oxygen species during apoptosis. J. Cell Biol. 160:65–75. [DOI] [PMC free article] [PubMed] [Google Scholar]
- Scott, S.V., A. Cassidy-Stone, S.L. Meeusen, and J. Nunnari. 2003. Staying in aerobic shape: how the structural integrity of mitochondria and mitochondrial DNA is maintained. Curr. Opin. Cell Biol. 15:482–488. [DOI] [PubMed] [Google Scholar]
- Wei, M.C., W.-X. Zong, E.H.-Y. Cheng, T. Lindsten, V. Panoutsakopoulou, A.J. Ross, K.A. Roth, G.R. MacGregor, C.B. Thompson, and S.J. Korsmeyer. 2001. Proapoptotic BAX and BAK: a requisite gateway to mitochondrial dysfunction and death. Science. 292:727–730. [DOI] [PMC free article] [PubMed] [Google Scholar]


