

Abstract
The modulation of Ca2+ signaling patterns during repetitive stimulations represents an important mechanism for integrating through time the inputs received by a cell. By either overexpressing the isoforms of protein kinase C (PKC) or inhibiting them with specific blockers, we investigated the role of this family of proteins in regulating the dynamic interplay of the intracellular Ca2+ pools. The effects of the different isoforms spanned from the reduction of ER Ca2+ release (PKCα) to the increase or reduction of mitochondrial Ca2+ uptake (PKCζ and PKCβ/PKCδ, respectively). This PKC-dependent regulatory mechanism underlies the process of mitochondrial Ca2+ desensitization, which in turn modulates cellular responses (e.g., insulin secretion). These results demonstrate that organelle Ca2+ homeostasis (and in particular mitochondrial processing of Ca2+ signals) is tuned through the wide molecular repertoire of intracellular Ca2+ transducers.
Keywords: organelle; aequorin; calcium; kinases; signal transduction
Introduction
PKC comprises a family of serine/threonine protein kinases, which participate in transducing intracellularly a wide number of extracellular signals (Mellor and Parker, 1998). They have been shown to participate in signaling events as diverse as cell proliferation, apoptosis, smooth muscle contraction, and secretion (Dekker and Parker, 1994; Toker, 1998). Up to 12 distinct family members have been discovered in mammalian cells. They have been subdivided into three classes: (1) the classical or conventional PKCs (α, βI, βII, and γ) activated by Ca2+ and diacylglycerol; (2) the new or novel PKCs (δ, ɛ, η, and θ) activated by diacylglycerol but Ca2+ independent; and (3) the atypical PKCs (λ and ζ), which are Ca2+ and diacylglycerol insensitive (Nishizuka, 1992).
On the one hand, Ca2+ is a crucial activator of some PKC isoforms; on the other hand, PKC-dependent phosphorylation reactions have been shown to modify the spatio-temporal pattern of cellular Ca2+ responses. Indeed, PKCs were shown to differentially decode high and low frequency Ca2+ spiking (Oancea and Meyer, 1998) and to modulate Ca2+ release from the ER evoked by agonist stimulation (Montero et al., 2003). Thus, they appear to be an important part of the molecular machinery underlying the wide complexity of Ca2+ signaling (Pozzan et al., 1994; Clapham, 1995; Berridge et al., 2000). As the site of action, much remains to be explored. Indeed, PKCs were shown to associate to cellular domains and organelles playing a crucial role in generating and decoding Ca2+ signals, such as the plasma membrane, the ER, the Golgi apparatus, and the mitochondria (Goodnight et al., 1995; Wang et al., 1999; Perego et al., 2002).
In this contribution, we took advantage of intracellularly targeted Ca2+ probes (the aequorin chimeras) and a panel of PKC-GFP fusion proteins to explore the effects of the various PKC isoforms on the Ca2+ signals occurring in different cellular domains. Specifically, we constructed a panel of PKC-GFP chimeras that allow the molecular repertoire of these effectors to be altered. The chimeras include the α, β, δ, ɛ, and ζ isoforms (Chiesa et al., 2001). For measuring Ca2+ concentration, we used aequorin-based recombinant probes (Rizzuto et al., 1992; Brini et al., 1995; Montero et al., 1995; Pinton et al., 1998) that can be cotransfected with the protein of interest, thus providing an accurate monitoring of Ca2+ signaling in the transfected subset of cells, and probes that are specifically targeted to a defined subcellular compartment, thus providing a complete analysis of intracellular Ca2+ homeostasis. In our work, we analyzed the effects of the various isoforms on organelle Ca2+ handling, with special focus on mitochondria. These organelles act as an important “decoding station,” where Ca2+ signals can exert effects as diverse as stimulation of aerobic metabolism (Jouaville et al., 1999) and release of proapoptotic factors to the cytoplasm (Kroemer and Reed, 2000).
By this means, we observed that the overexpression of different PKC isoforms induces specific alterations of cellular Ca2+ homeostasis. In particular, we observed an effect of some isoforms on mitochondrial Ca2+ responses. Then, we addressed the mechanisms that allow this fine modulation of mitochondrial Ca2+ homeostasis and analyzed some possible targets of PKC action, such as the mitochondrial membrane potential (ΔΨm; i.e., the driving force for the Ca2+ uptake into the organelle), the production of reactive oxygen species (ROS), and the three-dimensional structure of the organelle. Finally, we obtained evidence for the involvement of the β isoform of PKC in the yet poorly understood phenomenon of desensitization of mitochondrial Ca2+ responses (Maechler et al., 1998; Challet et al., 2001).
Results
Different effects of PKC isoforms on mitochondrial Ca2+ signaling
The initial goal of our work was to evaluate whether or not the various PKC isoforms could differently affect Ca2+ handling in mitochondria, which is an important site for decoding cellular Ca2+ signals. For this purpose, a defined PKC isoform was overexpressed through the panel of PKC-GFP chimeras developed in the laboratory, and mitochondrial Ca2+ homeostasis was monitored through a cotransfected mitochondrially targeted aequorin (AEQ) probe, mtAEQ. Specifically, HeLa cells were either cotransfected with the PKC-GFP chimera of interest and mtAEQ (PKC overexpressing) or transfected with mtAEQ alone (control). After transfection and reconstitution of the photoprotein (see Materials and methods for details), the coverslip with the transfected cells was transferred to the luminometer chamber and data were collected. In all cases, the mitochondrial Ca2+ response to histamine, an agonist acting on Gq-coupled receptor and causing the production of inositol 1,4,5 trisphosphate (IP3), was investigated (Fig. 1). Both in control and PKC-transfected cells, histamine stimulation caused a large, rapid rise in mitochondrial Ca2+ concentration ([Ca2+]m) that returned to almost basal levels in ∼1 min. The effect of overexpressed PKC isoforms on this [Ca2+] response was different. In cells overexpressing PKCɛ, the histamine-dependent [Ca2+]m rise was almost unchanged (peak amplitude: 87 ± 14 μM [PKCɛ] vs. 91 ± 4 μM [control]; n = 18, P > 0.05), indicating that the alteration of mitochondrial Ca2+ responses is not a general feature of all PKCs. In contrast, in PKCα-, β-, and δ-transfected cells, the [Ca2+]m increases evoked by stimulation with histamine were significantly smaller than in controls (peak amplitude: 29 ± 5 μM [PKCα], 34 ± 4 μM [PKCβ], and 43 ± 8 μM [PKCδ]; n = 11, P < 0.05). On the contrary, in cells overexpressing PKCζ, the [Ca2+] rise was markedly larger (peak amplitude: 109 ± 9 μM; n = 15, P < 0.05).
Figure 1.

Mitochondrial Ca 2+ homeostasis in control and PKC-overexpressing HeLa cells. Parallel batches of HeLa cells were either cotransfected with mtAEQ and a PKC-GFP chimera including the indicated PKC isoform or transfected with mtAEQ alone (Control). 36 h after transfection, the measurement of AEQ luminescence was performed and calibrated into [Ca2+] values as described in Materials and methods. Where indicated, the cells were challenged with 100 μM histamine. In this and in the following aequorin experiments, the traces are representative of at least 10 from 3 independent experiments, which gave similar results.
To rule out the possibility that we were observing spurious effects due to major overexpression of active kinases (and thus a global perturbation of cellular functions), we aimed at confirming these observations in cells expressing only endogenous kinases by using isoform-specific PKC inhibitors. The expectation was to observe an effect opposite to that caused by the recombinant overexpression of the kinase. In these experiments, mtAEQ-expressing HeLa cells were treated 16 h before the Ca2+ measurements with 10 μM Ro-32-0432 (Birchall et al., 1994), 5 μM hispidin (Gonindard et al., 1997), or 50 μM PKCζ pseudosubstrate inhibitor myristoylated (Sajan et al., 1999) to inhibit endogenous PKCα, β, or ζ, respectively (Fig. 2). [Ca2+]m responses to histamine stimulations were evaluated as in Fig. 1. The results obtained well match those obtained by overexpressing the different PKC isoforms. Indeed, the inhibition of PKCα and β caused a significant increase of the [Ca2+]m rise evoked by histamine (peak amplitude: 152 ± 14 μM [PKCα] and 107 ± 9 μM [PKCβ]; n = 7, P < 0.05). Interestingly, the increase caused by the inhibitors appears larger in the case of inhibition of PKCα than of PKCβ both in absolute terms and as a percent (77 vs. 21% increase, respectively). These are fully specular results to the overexpression experiments of PKCα and PKCβ, indicating a more pronounced inhibitory effect of PKCα. Vice versa the inhibition of PKCζ drastically reduced the [Ca2+]m rise (peak amplitude: 66 ± 4 μM; n = 11, P < 0.05). The inhibition of the PKCδ (with Rottlerin) was not, in our hands, informative, as the prolonged exposure to the inhibitor not only almost abolished both cytosolic and mitochondrial Ca2+ responses but also was associated to high cell mortality.
Figure 2.

Effects of PKCα, β, and ζ inhibitors on mitochondrial Ca 2+ homeostasis. HeLa cells were transfected with the mtAEQ chimera. 16 h before the aequorin measurement (performed 36 h after transfection), the cells were treated with 10 μM Ro-32-0432 (PKCα inhibitor), 5 μM hispidin (PKCβ inhibitor), or 50 μM PKCζ pseudosubstrate inhibitor myristoylated (PKCζ inhibitor), as labeled. Where indicated, the cells were challenged with 100 μM histamine. All other conditions were as in Fig. 1. Traces from control and inhibitor-treated cells are displayed in gray or black, respectively.
The analysis of intracellular calcium stores and of cytosolic Ca2+ responses indicates a specific mitochondrial effect for some PKC isoform
We investigated whether or not the [Ca2+]m changes were paralleled by alterations of cytosolic Ca2+ signals. Indeed, the mitochondrial Ca2+ response usually follows and amplifies the agonist-dependent cytosolic rise. In the experiment shown in Fig. 3 A, HeLa cells, either coexpressing the PKC chimera of interest and cytosolic aequorin (PKC overexpressing) or expressing only cytosolic aequorin (control) (Brini et al., 1995), were challenged with histamine. As expected based on mitochondrial results, there is no difference in the cytosolic Ca2+ response between control and PKCɛ-overexpressing cells (peak amplitude: 2.6 ± 0.1 μM [PKCɛ] vs. 2.6 ± 0.1 μM [control]; n = 18, P > 0.05). A significant reduction of the response was observed in the PKCα-overexpressing cells (peak amplitude: 1.8 ± 0.1 μM; n = 12, P < 0.05). Surprisingly, in contrast with the mitochondrial results, in the cytosolic compartment there is only a small reduction in PKCβ- and PKCδ-overexpressing cells (peak amplitude: 2.2 ± 0.1 μM; n = 17, P < 0.05 for PKCβ and 2.3 ± 0.2 μM; n = 15, P > 0.05 for PKCδ) and no difference was detected in PKCζ-overexpressing cells (peak amplitude: 2.6 ± 0.2 μM; n = 15, P > 0.05).
Figure 3.

Cytosolic Ca 2+ homeostasis in control and PKC-overexpressing HeLa cells. (A) Aequorin measurements: parallel batches of HeLa cells were either cotransfected with cytAEQ and a PKC-GFP chimera including the indicated PKC isoform or transfected with the cytAEQ alone (Control). All other conditions were as in Fig. 1. Where indicated, the cells were challenged with 100 μM histamine. (B) Relationship between cytosolic and mitochondrial Ca2+ responses: parallel batches of HeLa cells were transfected with either the cytAEQ or the mtAEQ chimera. All other conditions were as in Fig. 1. To reduce the [Ca2+]c and [Ca2+]m responses, the Ca2+ stores were partially depleted by preincubating the cells in KRB/EGTA for different periods (as indicated) before challenging them with 100 μM histamine. [Ca2+]c and [Ca2+]m responses are expressed as a percentage of the peak amplitude (compare with control, non-EGTA–pretreated cells). The inset highlights the condition in which the reduction of the [Ca2+]c response is the same of that observed on PKC overexpression. (C) Fura-2 measurements: HeLa cells transfected with PKCβ-GFP or PKCδ-GFP (top) and loaded with fura-2 were stimulated with 100 μM histamine. The kinetic behavior of the [Ca2+]c response (bottom) is presented as a 340:380 nm ratio.
Given the nonlinear dependence of mitochondrial Ca2+ accumulation on [Ca2+]c, we could not rule out, in principle, that the small reduction of the [Ca2+]c peak of PKCβ- and PKCδ-expressing cells accounted for the large drop of the [Ca2+]m response. To verify this possibility, we performed a specific series of experiments, aimed at directly assessing the correlation between the [Ca2+]c and [Ca2+]m responses. In these experiments, [Ca2+]c was gradually reduced by incubating the cells in EGTA-containing, Ca2+-free KRB (KRB/EGTA) for variable time lengths before challenging them with histamine. This process caused a progressively larger decrease in the histamine-induced [Ca2+]c peak, from 8% (after 5 min in KRB/EGTA) to 19% (after 50 min), and in the [Ca2+]m peak, from 19% (after 5 min in KRB/EGTA) to 38% (after 50 min). It is apparent that for an ∼15% reduction of the [Ca2+]c peak (i.e., slightly larger than that observed in PKCβ- and PKCδ-overexpressing cells), the decrease of the [Ca2+]m peak was ∼24% (compared with an ∼63 and 53% reduction in PKCβ- and PKCδ-overexpressing cells, respectively). We verified if the PKC isoforms could alter the kinetics of the [Ca2+]c rise (an effect that could be overlooked by the low temporal resolution of the aequorin measurements). For this purpose, we performed single cell fura-2 imaging studies, comparing the [Ca2+]c responses of PKCβ-GFP– and PKCδ-GFP–transfected cells (identified by the GFP moiety) with those of nontransfected cells. Representative cells and traces are shown in Fig. 3 C; in this and similar experiments, no difference could be detected between PKCβ (or PKCδ)-transfected and control cells in either the kinetics or the peak value of the histamine-induced [Ca2+]c rise. Overall, these experiments indicate that no major feature of cytosolic Ca2+ signaling is significantly affected by the overexpression of these PKC isoforms; thus, the major reduction of the [Ca2+]c responses must be ascribed to a direct effect on mitochondrial Ca2+ homeostasis.
To confirm the latter conclusion, we also investigated the effect of PKC overexpression on the agonist-sensitive Ca2+ stores. Although the key parameter for mitochondrial Ca2+ uptake (the [Ca2+]c transient) was unaffected, we wanted to exclude the possibility that ER loading (or its discharge properties) was affected by the activity of the PKC isoforms, an effect that could have a greater impact on [Ca2+]m than [Ca2+]c. Indeed, in a recent paper, by altering ER Ca2+ levels through overexpression of SERCA (sarco-ER Ca2+ ATPase) or plasma membrane Ca2+ ATPase, Brini et al. (2000) showed that mitochondrial Ca2+ responses correlate with the state of filling of the Ca2+ stores and the rate and extent of Ca2+ release rather than with the [Ca2+] rise detected in the bulk cytosol (Brini et al., 2000).
Thus, we monitored the [Ca2+] of agonist-sensitive Ca2+ stores, using the aequorin chimeras targeted to the endoplasmic reticulum (erAEQ; Montero et al., 1995) or to the Golgi apparatus (GoAEQ; Pinton et al., 1998). For this purpose, HeLa cells were either cotransfected with the PKC chimera of interest and erAEQ (or GoAEQ; PKC-overexpressing) or transfected with erAEQ (or GoAEQ) alone (control; see Materials and methods). Figs. 4 and 5 show the calibrated [Ca2+] values in the two compartments. To obtain reliable quantitative estimates of the [Ca2+] in the lumen of these two organelles, their [Ca2+] needs to be decreased during both the reconstitution of aequorin with coelenterazine and the subsequent initial phase of perfusion with KRB/EGTA in the luminometer (see Materials and methods). Under those conditions, the [Ca2+] was <10 μM in both organelles. When the [Ca2+] in the perfusion medium was switched to 1 mM, the [Ca2+] in the lumen of the two compartments gradually increased. The [Ca2+] in the lumen of the two compartments, in control cells, reached a plateau value of 419 ± 10 μM (n = 39) in the ER and 228 ± 8 μM (n = 27) in the Golgi apparatus. In PKC-transfected cells, Ca2+ was reaccumulated in the organelles with a similar time course, and comparable steady-state values were attained in both compartments (ER: 392 ± 7 μM [PKCɛ], 417 ± 8 μM [PKCα], 399 ± 6 μM [PKCβ], 386 ± 10 μM [PKCδ], and 424 ± 8 μM [PKCζ]; n = 10, P > 0.05; Golgi apparatus: 227 ± 7 μM [PKCɛ], 245 ± 6 μM [PKCα], 246 ± 7 μM [PKCβ], 257 ± 10 μM [PKCδ], and 217 ± 6 μM [PKCζ]; n = 6, P > 0.05). To have a complete picture of the Ca2+ handling properties of Ca2+ stores, the basal Ca2+ leak from the ER was also investigated. In these experiments, after aequorin reconstitution, the ER was refilled with Ca2+ as described in the previous paragraph. Then, the SERCA inhibitor 2,5-di-(tert-butyl)-1,4-benzohydroquinone was added to the perfusion medium to initiate passive Ca2+ efflux from the ER. No difference in the leak rate between PKCs transfected and control cells was observed (unpublished data).
Figure 4.

Ca 2+ homeostasis in the ER lumen of control and PKC-overexpressing HeLa cells. Parallel batches of HeLa cells were either cotransfected with erAEQ and a PKC-GFP chimera including the indicated PKC isoform or transfected with erAEQ alone (control). 36 h after transfection, the Ca2+ stores were depleted of Ca2+ to optimize aequorin reconstitution as detailed in the text. After reconstitution, the cells were transferred to the luminometer chamber, and the ER store was refilled by switching the perfusion medium from KRB/EGTA to KRB/Ca2+. Where indicated, the cells were perfused with 1 mM CaCl2 and challenged with 100 μM histamine.
Figure 5.

Ca 2+ homeostasis in the lumen of the Golgi apparatus of control and PKC-overexpressing HeLa cells. Parallel batches of HeLa cells were either cotransfected with GoAEQ and a PKC-GFP chimera including the indicated PKC isoform or transfected with GoAEQ alone (Control). Aequorin reconstitution, experimental layout, and data display are as in Fig. 4. Where indicated, the cells were perfused with 1 mM CaCl2 and challenged with 100 μM histamine.
Together, the aforementioned data indicate that the differences previously observed in cellular Ca2+ homeostasis, induced by overexpression of the different PKC isoforms, are not due to changes in the filling state of the intracellular Ca2+ stores. These results are particularly interesting (and partially unexpected) in the case of PKCα-overexpressing cells, in which a very marked reduction of mitochondrial and cytosolic responses to agonists had been observed.
We investigated the release phase (i.e., the [Ca2+]ER decrease occurring after agonist stimulation; Fig. 4). The rapid [Ca2+]ER drop after histamine addition was larger (73 ± 6 μM [PKCα] vs. 115 ±11 μM [control]; n = 9, P < 0.05) in control cells compared with PKCα-transfected cells, indicating a substantially reduced release through the IP3-gated channels. These data are fully consistent with the cytosolic and mitochondria reduction of Ca2+ responses and suggest a direct, inhibitory effect on one of the components of the signaling cascade from the plasma membrane receptor to the Ca2+ release channels (i.e., from IP3 production to the activity of the IP3-gated channels).
On the contrary, with the other PKC isoforms, little or no effect on Ca2+ release was observed: a small reduction in ER Ca2+ release in PKCβ-transfected cells (85 ± 6 μM; n = 9, P > 0.05) and no difference with all others isoforms (139 ± 10 μM [PKCδ], 129 ± 13 [PKCɛ], and 118 ± 8 μM [PKCζ]; n = 9, P > 0.05). Similar results were obtained from the analysis of the Golgi store. Also in this case, the only significant effect was a smaller Ca2+ release in PKCα-overexpressing cells (Fig.5).
Together, these data show that although PKCα globally affects cellular Ca2+ signaling, the other isoforms (i.e., the β, δ, and ζ) appear to modulate mitochondrial Ca2+ responses without significantly altering cellular Ca2+ homeostasis, most likely acting directly on this organelle.
Mitochondrial membrane potential, ROS production, and organelle morphology in PKC-expressing cells
Next, the nature of this mitochondrial effect was investigated. At first, we verified the occurrence of ΔΨm changes in PKC-GFP–transfected and control cells. Using the ΔΨm-sensitive dyes (TMRM and JC-1), no statistically significant difference was detected between control and PKC-expressing cells (identified by the GFP tag), although a small number of cells with detectable ΔΨm decreases was observed upon PKCα and β transfection. To be able to detect small changes, we decided to measure free radical production in mitochondria using the ROS-sensitive fluorescent probe CM-H2DCFDA. ROS (ROS: O2 −*, H2O2, OH*) are generated from chemical reactions of molecular oxygen with the enzymes and coenzymes of the respiratory chain. This process is physiological and continuous (Skulachev, 1998), and mitochondrial ROS production was shown to strictly depend in a nonlinear way on ΔΨm. Indeed, even small ΔΨm decreases cause a large (measurable) inhibition of mitochondrial ROS production, whereas ΔΨm increases cause a significant stimulation of ROS production (Korshunov et al., 1997).
Thus, we performed single cell analysis of mitochondrial ROS production in PKC-overexpressing cells. Mitochondrial contribution was estimated by evaluating the effect of the collapse of ΔΨm with FCCP on total ROS production, as detailed in Materials and methods. Although a great variability was observed between individual cells, >80% cells showed a mitochondrial ROS production ranging between 10 and 40% of total cellular production. No significant difference was detected upon overexpression of PKCɛ and ζ. Conversely, mitochondrial ROS production appeared greatly decreased upon overexpression of PKCα and β (∼50 and 25% of cells, respectively, compared with <10% of control cells, had a mitochondrial ROS production <10%). Upon overexpression of PKCδ, mitochondrial ROS production was increased (∼45% of PKCδ-expressing cells, compared with <10% of control cells, had a mitochondrial ROS production >50%). Although a ΔΨm change could not be directly shown with TMRM, these data suggest that, in the case of PKCβ, a small reduction in the driving force for Ca2+ accumulation may occur, which could be in part responsible for the reduction of mitochondrial Ca2+ accumulation.
Finally, we wished to rule out the possibility that the alteration of mitochondrial Ca2+ responses was a consequence of a major structural perturbation of the organelle (that could cause the loss of the ER–mitochondria contacts, essential for the large and prompt uptake of Ca2+ by mitochondria). Mitochondrial structure was evaluated by labeling the organelle with TMRM (that could be used in association with the PKC-GFPs) and visualizing it with a confocal microscope. Fig. 6 shows the mitochondrial fluorescence image obtained from cells overexpressing the different PKC-GFP chimeras. It is apparent that in all cases PKC overexpression caused no obvious alteration in mitochondrial morphology, despite the occurrence of occasional structural rearrangements both in transfected and nontransfected cells.
Figure 6.
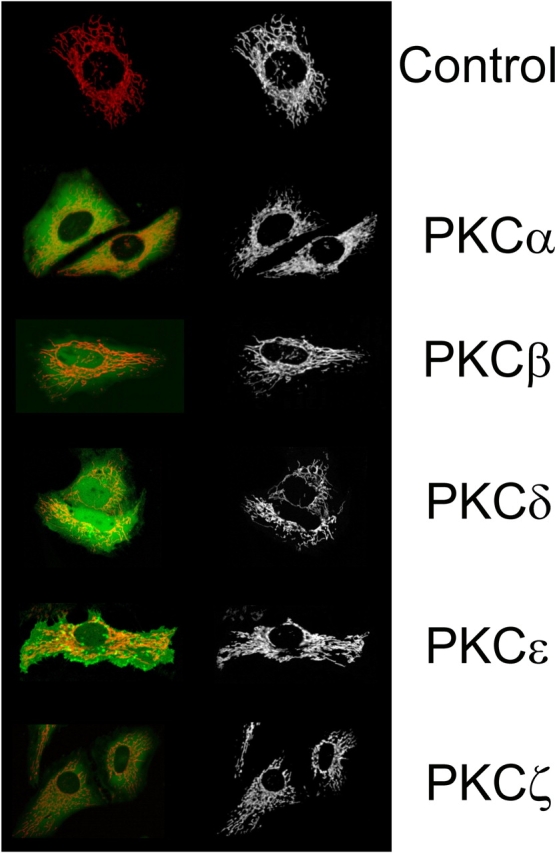
Analysis of mitochondrial structure in PKC-overexpressing cells. HeLa cells were transfected with the PKC-GFP chimera including the indicated PKC isoform and loaded with 10 nM TMRM. Transfected cells were identified by visualizing GFP fluorescence (right), and mitochondrial structure was visualized with TMRM (left) as specified in Materials and methods. The field of cells is representative of >50 observations from at least 5 independent experiments.
PKCβ is involved in the desensitization of mitochondrial Ca2+ uptake
A phenomenon that attracted much interest in the study of mitochondrial Ca2+ signaling is the drastic reduction in amplitude occurring when two consecutive stimuli are applied. Several factors contribute to this experimental observation: (a) the second stimulation with the same agonist evokes a smaller cytosolic response (due to receptor desensitization); this response has a greater effect on mitochondrial Ca2+ accumulation, as shown in the experiment of Fig. 3 B. (b) When aequorin is used for measuring [Ca2+]m, the higher probe consumption (and depletion) in the mitochondrial regions close to the ER may lead to an artifactual underestimation of the following response (Rizzuto et al., 1998; Filippin et al., 2003). However, evidence has been obtained that this reduction, at least in part, represents a true desensitization of the mitochondrial Ca2+ uptake machinery that has important physiological consequences (e.g., an inhibition of events that depend on mitochondrial Ca2+ accumulation, such as insulin secretion; Maechler et al., 1998). The mechanism of this inhibitory effects is still unknown, and we investigated the possibility that the PKC isoforms, which are activated upon agonist stimulation and specifically reduce the capacity of mitochondria of accumulating Ca2+, such as PKCβ, could be involved.
The working hypothesis was that if PKCβ has a role in desensitizing mitochondrial Ca2+ uptake, its inhibition during the first histamine stimulation should lead to an increase of the [Ca2+]m rise observed during the second agonist challenge. On the contrary, the second [Ca2+]c rise should not be affected. Thus, the cells were treated with the specific inhibitor of PKCβ hispidin (applied 1 min before the first application of histamine, maintained throughout agonist stimulation, and washed away). The results are shown in Fig. 7 B. The short treatment with the PKCβ inhibitor does not change the first response (consistent with the low PKCβ expression in HeLa cells; Chun et al., 1996). On the contrary, it markedly increases the [Ca2+]m peak evoked by the second histamine stimulation (62 ± 14 μM vs. 38 ± 8 μM; n = 12, P < 0.05), whereas no differences were observed in the cytosolic response (2.3 ± 0.6 μM vs. 2.3 ± 0.9 μM; n = 9, P > 0.05; Fig. 7 D). This potentiation of the second response is due to a PKCβ-dependent desensitization (i.e., a “long-term memory” of the first stimulation) and not to a direct effect of the short treatment with the PKC inhibitor. Indeed, the application of the PKC inhibitor by itself (e.g., not in coincidence with a first histamine stimulation) does not modify the response to histamine applied 10 min after the pulse with the inhibitor (Fig. 7 C, inset).
Figure 7.

Effect of PKCβ inhibitor hispidin on the reduction of mitochondrial Ca2 + accumulation occurring upon repeated agonist stimulation. Mitochondrial (A and C) and cytosolic (B and D) [Ca2+] was monitored in PKCβ-overexpressing cells as in Fig. 1 and 3, respectively. Where indicated, the cells were treated with 100 μM histamine and 5 μM hispidin (PKCβ inhibitor).
Given the confounding effect of the heterogeneous consumption of the aequorin probe during the first stimulation, we wished to confirm these results using a radically different probe that is endowed with higher affinity (and thus could underestimate the [Ca2+]m peak and small reductions in [Ca2+]m responses) but is not consumed during repetitive agonist stimulations. We used a mitochondrially targeted Camgaroo (mtCamgaroo-2), an insertional mutant of GFP sensitive to Ca2+ (Griesbeck et al., 2001). HeLa cells were transfected with mtCamgaroo-2, analyzed with an imaging system based on a highly sensitive camera, and treated with the double stimulation protocol used for the aequorin experiments. With this mitochondrial Ca2+ probe, the second histamine response is reduced to ∼18% (compared with the first one) in control cells (n = 18, P < 0.05), whereas no difference in the mitochondrial response was detectable in the presence of the PKCβ inhibitor hispidin (n = 16, P > 0.05).
Discussion
PKCs comprise a closely related set of enzymes activated by Ca2+ and/or diacylglycerol (i.e., second messengers produced upon engagement of Gq-coupled plasma membrane receptors; Mellor and Parker, 1998). Molecular diversity within the PKC protein family (underlying different molecular targets and mechanisms of activation) and/or specific tissue or subcellular distribution of the isozymes make these Ca2+ transducers a versatile toolkit, which allows stimulation of different receptors to convert into very diverse cellular effects (Dekker et al., 1995; Toker, 1998; Parekh et al., 2000; Shirai and Saito, 2002). For example, PKCα and δ have been demonstrated to have diametrically opposite effects on the process of apoptosis (Ruvolo et al., 1998; Majumder et al., 2000).
However, PKC participates in Ca2+ signaling not only by activating downstream effectors (enzymes, channels, and transcription factors; Ben Ari et al., 1992; Jaken, 1996; Moscat et al., 2003) but also by shaping the spatio-temporal properties of the Ca2+ signal itself, highlighting a complex interplay between the ion second messenger and its decoding machinery. First, the changes in intracellular Ca2+ concentration and the timing of PKC activation were shown to exhibit different kinetics. Oancea and Meyer (1998) showed that activation of the Ca2+-sensitive PKCγ required the displacement of an inhibitor pseudosubstrate; thus, PKC activation (and ensuing cellular response) lagged behind agonist stimulation. This observation implies that repetitive Ca2+ spikes may be necessary for maximal PKC recruitment, and agonist specific spiking frequencies (that can have results varying from sustained PKC recruitment to no mobilization at all) can be differentially decoded inside the cell (Oancea and Meyer, 1998). Moreover, in an elegant paper, Mogami et al. (2003) show how, in pancreatic β cells, the short-lived Ca2+ signal is transduced via PKC activation into long-term phosphorylation of substrate with important implications for the control of important phenomena such as insulin secretion.
Second, the Ca2+ response itself can be modified by a previous activation of PKC. This notion is supported by the presence of consensus sequences for PKC phosphorylation in important proteins related with Ca2+ homeostasis such as the IP3 receptor (Willems et al., 1989; Nucifora et al., 1995), the Ca2+ ATPase of the plasma membrane (Zylinska et al., 1998), and several agonist receptors (Francesconi and Duvoisin, 2000). This modulatory effect was recently demonstrated by Montero et al. (2003), who showed that PKC inhibition (through the use of a wide-spectrum blocker that guaranteed the inhibition of all isozymes) drastically reduced the agonist-dependent Ca2+ responses in HeLa cells. The data clearly indicated a major role for PKC in tuning the intensity of Ca2+ signals through an effect on the release kinetics of the agonist-sensitive Ca2+ store.
In this work, we have investigated two main aspects. First, we have separately analyzed the effect of various PKC isoforms belonging to different subgroups of the protein family on the cellular Ca2+ signaling patterns. Second, we took advantage of organelle-specific Ca2+ probes (the targeted chimeras of the Ca2+-sensitive photoprotein aequorin) to investigate if some PKC isoform can exert a specific effect on the different Ca2+ pools, thus altering the cross talk between the various reservoirs of this signaling ion. We devoted special attention to mitochondria, which is an important decoding checkpoint of Ca2+ signals (Duchen, 2000; Rizzuto et al., 2000). Indeed, Ca2+ increases in the mitochondrial matrix, which are triggered by agonist stimulation but also by apoptotic agents such as ceramide, can induce, within the organelle, effects as diverse as stimulation of organelle metabolism (Hajnoczky et al., 1995; Jouaville et al., 1999) and morphological alterations, with the ensuing release of caspase cofactors and the induction of apoptotic cell death (Szalai et al., 1999; Pinton et al., 2001). Moreover, mitochondrial Ca2+ uptake influences the properties of cytoplasmic Ca2+ increases by either forming a firewall that prevents or delays the spread of Ca2+ waves (Tinel et al., 1999) or rapidly clearing Ca2+ at ER–mitochondria contacts, reducing the (positive or negative) feedback activity of Ca2+ on the ER release channels (Hajnoczky et al., 1999). Finally, it was recently proposed that Ca2+ release from mitochondria (through the activation of the mitochondrial Na+-Ca2+ exchanger) induces a Ca2+ rise in presynaptic endings, which contributes to posttetanic potentiation of neurotransmitters release (Yang et al., 2003). For these reasons, the specific modulation of the capacity of mitochondria to accumulate or release Ca2+ (without affecting the global Ca2+ responses of the cell) can greatly increase the flexibility of this signaling pathway.
The detailed analysis of the different PKC isoforms (obtained by overexpressing a specific isozyme or inhibiting it specifically in wild-type cells, two complementary approaches that provided a coherent picture) revealed defined, differentiated roles for the various members of the protein family. A preliminary observation is that subunits belonging to the same subgroup (e.g., α and β, and δ and ɛ) had very different effects, indicating that PKC-dependent modulation of Ca2+ signaling is based on the recruitment of highly specific substrates or second messenger production patterns. In the case of PKCɛ, no alteration was observed in either the steady-state [Ca2+] levels of resting cells or in the changes occurring upon cell stimulation in any of the investigated compartments (ER, Golgi apparatus, cytosol, and mitochondria), indicating that the modulation of cellular Ca2+ signals is not a general property shared by all PKC isoforms. In the case of PKCα, a major reduction was observed in the amplitude of Ca2+ responses induced by histamine stimulation. Although the resting levels in the ER and Golgi Ca2+ stores were the same of control cells, the drop in luminal [Ca2+] was much smaller, and consequently the Ca2+ rises occurring in the cytosol and in the mitochondria were significantly reduced. We have not investigated where this desensitization of global Ca2+ signals occurs (i.e., at the level of receptor, G protein, phospholipase C, or IP3-receptor); however, we note that these results closely match those of Montero et al. (2003), suggesting that the increase of Ca2+ responses that they observe upon application of wide-spectrum PKC inhibitors (Montero et al., 2003) most likely reflects the inhibition of PKCα.
However, the most surprising results were obtained with PKCβ, δ, and ζ. Indeed, when the activity of these isoforms was enhanced (by overexpression) or inhibited, the effect was almost exclusively on mitochondrial Ca2+ uptake. Indeed, although no significant alteration was detected in ER Ca2+ release (and in the amplitude and kinetic properties of the [Ca2+]c rise), mitochondrial [Ca2+] transients were reduced by PKC β and δ and increased by PKC ζ. Unfortunately, it is very difficult to verify which is the molecular site of this regulation, as the most plausible targets are still undefined at the molecular level. Indeed, the Ca2+ transport system of the inner mitochondrial membrane, characterized in terms of biochemical properties (an electrogenic uniporter for accumulation, an exchanger with Na+ or H+ for release), are still unknown, and consequently no information is available also on regulatory proteins that can interact with them and influence their activity. We have investigated whether or not the alteration of mitochondrial Ca2+ responses could be indirect, i.e., affecting either the three-dimensional structure of the organelle (and thus the possibility of establishing close contacts with the ER Ca2+ store [Rizzuto et al., 1998] that allow fast Ca2+ accumulation into mitochondria) or the driving force for the uptake of the cation (e.g., affecting the expression or activity of uncoupling proteins). On the former aspect, using TMRM to label the organelle, we observed no alteration of the three-dimensional mitochondrial network on expression of any of the PKC isoforms used in our work. As to the driving force, mitochondrial membrane potential was directly measured with ΔΨm-sensitive dyes and indirectly assessed through ROS production. No increase was detected with the ζ isoform, nor decrease with the δ, whereas a probably modest decrease in ΔΨm was detected in cells overexpressing the β isoforms. Thus, an indirect effect through ΔΨm can be excluded in the former case, whereas it is possible that the sharp decrease of [Ca2+]m responses induced by PKCβ is in part mediated by a reduction of the driving force for Ca2+ accumulation. Conversely, the primary effect of the PKCζ, and most likely of PKCδ, appears to be on mitochondrial Ca2+ uptake, and its clarification awaits the molecular definition of this important process.
Finally, we investigated if this regulatory mechanism could be responsible for the well-known phenomenon of mitochondrial desensitization to repetitive agonist stimulation described in cell systems as diverse as pancreatic β-cells (Nesher and Cerasi, 1987; Anello et al., 1996; Kennedy et al., 1996) and skeletal myotubes (Challet et al., 2001; whereas in HeLa cells it was observed only in some experimental conditions [Collins et al., 2001; Filippin et al., 2003]). In brief, a second stimulation with an agonist causing a [Ca2+]c rise induces a drastically reduced [Ca2+]m transient that cannot be fully accounted for by receptor desensitization but must be ascribed to a reduced Ca2+ uptake capacity of the organelle. This phenomenon was shown to have important physiological implications, as it correlates in pancreatic β cells with a major reduction in insulin secretion (Maechler et al., 1998), but no information on the possible mechanism was available. In this contribution, we provide evidence that mitochondrial Ca2+ desensitization can be ascribed to PKC isoforms that are activated by stimulation of receptors coupled to the production of diacylglycerol and IP3 (and thus cause a Ca2+ signal) and induce a reduction in the capacity of mitochondria to rapidly accumulate Ca2+. A regulatory mechanism based on PKC-dependent phosphorylation can also explain the fact that in permeabilized cells such a desensitization was not observed (Rizzuto et al., 1994), as in this case cytosolic proteins, such as PKCs, are lost.
In conclusion, the results of this paper reveal specific roles of the various PKC isoforms in shaping the Ca2+ signals evoked by agonist stimulation in different Ca2+ pools and cellular domains. In particular, the activity of defined PKC isoforms was shown to modulate mitochondrial responses, while leaving global Ca2+ signals unaffected. Thus, mitochondria emerge as a “sink” of Ca2+ released from the ER or entering through plasma membrane channels endowed with unique properties. On the one hand, they participate in decoding Ca2+-linked agonist stimulations (through intra- and extramitochondrial effects); on the other hand, they can vary their response based on the convergence of PKC-mediated (and possibly other) signaling pathways. Although future work will address the molecular targets of this regulatory mechanism, these results may already highlight novel pharmacological routes for specifically modifying Ca2+-dependent cellular dysfunctions that occur in a variety of genetic and acquired human disorders.
Materials and methods
Cell culture and transfection
HeLa cells were grown in DME supplemented with 10% FCS in 75 cm2 Falcon flasks. For aequorin measurements, the cells were seeded before transfection onto 13-mm glass coverslips and allowed to grow to 50% confluence. At this stage, transfection with 4 μg of plasmid DNA (control cells: 3 μg mtGFP + 1 μg AEQ; PKC-overexpressing cells: 3 μg PKC-GFP chimera of interest + 1 μg AEQ) was performed as described previously (Rizzuto et al., 1995) and aequorin measurements were performed 36 h after transfection. For ΔΨm, ROS production, and fura-2 measurements, the cells (seeded onto 24-mm coverslips) were transfected with 8 μg PKC-GFP plasmid. For single cells [Ca2+]m measurements, HeLa cells were seeded onto 24-mm coverslips and transfected with 8 μg mtCamgaroo-2 (Griesbeck et al., 2001).
Aequorin measurements
For cytosolic aequorin (cytAEQ) and mitochondrial aequorin (mtAEQ) measurements, the coverslip with the cells was incubated with 5 μM coelenterazine for 1–2 h in DME supplemented with 1% FCS and transferred to the perfusion chamber. For reconstituting with high efficiency the aequorin chimeras targeted to the Golgi apparatus and the ER (GoAEQ and erAEQ, respectively), the luminal [Ca2+] of these compartments must first be reduced. This result was obtained by incubating the cells for 1 h at 4°C in KRB (Krebs-Ringer modified buffer: 125 mM NaCl, 5 mM KCl, 1 mM Na3PO4, 1 mM MgSO4, 5.5 mM glucose, and 20 mM Hepes, pH 7.4, at 37°C) supplemented with 5 μM ionomycin and 600 μM EGTA in the presence of 5 μM coelenterazine n. After this incubation, the cells were extensively washed with KRB supplemented with 2% BSA and 1 mM EGTA. All aequorin measurements were performed in KRB supplemented with 1 mM CaCl2 (KRB/Ca2+). Agonists and other drugs were added to the same medium, as specified in the figure legends. The experiments were terminated by lysing the cells with 100 μM digitonin in a hypotonic Ca2+-rich solution (10 mM CaCl2 in H2O), thus discharging the remaining aequorin pool. The light signal was collected and calibrated into [Ca2+] values as described previously (Brini et al., 1995; Barrero et al., 1997). All the results are expressed as means ± SEM.
Measurements of ΔΨm, ROS production, and microscopic analysis of mitochondrial structure
ROS production in control and PKC-transfected cells was measured with the ROS-sensitive fluorescent probe 5- (and 6)-chloromethyl-2',7'-dichlorohydrofluoresceindiacetate (CM-H2DCFDA). The acetate group of CM-H2DCFDA is hydrolyzed by esterases inside the cell and it is trapped as a nonfluorescent probe (CM-H2DCF). Then, ROS increases its fluorescence. Cells were incubated with 2 μM CM-H2DCFDA for 20 min and washed with KRB/Ca2+. The green emission of CM-DCF was recorded at 520 nm. Acquisitions were made every 1 s (exposure time 100–200 ms). After a few minutes, when the rate of free radical production was constant, 300 nM FCCP was added to depolarize mitochondria (drastically reducing mitochondrial ROS production), and the measurements were continued for a few other minutes. The difference between the rates of ROS production before and after FCCP addition reflected the mitochondrial contribution to cellular ROS production (expressed as a percentage of total production). Images were recorded using a digital imaging system based on a fluorescence microscope (model Axiovert 200; Carl Zeiss MicroImaging, Inc.) equipped with a back-illuminated CCD camera (Roper Scientific), excitation and emission filterwheels (Sutter Instrument Company), and piezoelectric motoring of the z stage (Physik Instrumente; GmbH & Co.). The data were acquired and processed using the MetaFluor analyzing program (Universal Imaging Corp.). ΔΨm was measured using 10 nM TMRM on a confocal microscope (model LSM 510; Carl Zeiss MicroImaging, Inc.). The signal was collected as total emission >570 nm. To distinguish control from PKC-GFP–transfected cells, green emission was collected in the range >505–<535 nm. Mitochondrial structure of control and PKC-transfected cells was studied on a confocal microscope after loading 10 nM TMRM. Red and green signals (visualizing mitochondrial structure and identifying transfected cells, respectively) were collected as described in the previous paragraph.
Fura-2 measurements
The coverslip with PKC-transfected HeLa cells was incubated with 5 μM fura-2 (added to DME + 1% FCS) at 37°C for 30 min. After a brief wash with KRB/Ca2+, they were placed in an open Leyden chamber on the thermostated stage of an inverted microscope (model Axiovert; Carl Zeiss MicroImaging, Inc.) equipped with a Sutter filterwheel and 340/380 excitation filters. The fluorescence data were collected with a back-illuminated camera (Princeton Instruments) and expressed as emission ratios using the Metafluor software (Universal Imaging Corp.). Within the microscope field, transfected and untransfected cells were identified before carrying out the fura-2 monitoring by revealing the fluorescence of mtGFP, cotransfected with the PKC isoform of interest.
[Ca2+] measurements with mtCamgaroo-2
The coverslip with the mtCamgaroo-2–transfected cells were placed in an open Leyden chamber on the thermostated stage of an inverted microscope equipped with a Sutter filterwheel. The fluorescence data were collected with a back-illuminated camera using the Metafluor software. The time of illumination was reduced to a minimum (50 ms) and at least 1 s between two successive illuminations were allowed to avoid the well-known phenomenon of photoconversion of the probe into a form almost completely insensitive to Ca2+ changes, as reported by Filippin et al. (2003).
Acknowledgments
We wish to thank Tullio Pozzan for helpful discussion and experimental advice.
This work was supported by grants from Telethon-Italy (1285 and GTF02013), the Italian Association for Cancer Research, the Human Frontier Science Program, the Italian University Ministry (Ministero dell'Istruzione, dell'Università e della Ricerca-Università e Ricerca Scientifica e Tecnologica and Fondo per gli Investimenti della Ricerca di Base), and the Italian Space Agency to R. Rizzuto. M.R. Wieckowski is a recipient of Federation of European Biochemical Societies long-term fellowship.
Abbreviations used in this paper: ΔΨm, mitochondrial membrane potential; AEQ, aequorin; IP3, inositol 1,4,5 trisphosphate; ROS, reactive oxygen species.
References
- Anello, M., A.M. Rabuazzo, C. Degano, V. Caltabiano, G. Patane, R. Vigneri, and F. Purrello. 1996. Fast reversibility of glucose-induced desensitization in rat pancreatic islets. Evidence for an involvement of ionic fluxes. Diabetes. 45:502–506. [DOI] [PubMed] [Google Scholar]
- Barrero, M.J., M. Montero, and J. Alvarez. 1997. Dynamics of [Ca2+] in the endoplasmic reticulum and cytoplasm of intact HeLa cells. A comparative study. J. Biol. Chem. 272:27694–27699. [DOI] [PubMed] [Google Scholar]
- Ben-Ari, Y., L. Aniksztejn, and P. Bregestovski. 1992. Protein kinase C modulation of NMDA currents: an important link for LTP induction. Trends Neurosci. 15:333–339. [DOI] [PubMed] [Google Scholar]
- Berridge, M.J., P. Lipp, and M.D. Bootman. 2000. The versatility and universality of calcium signalling. Nat. Rev. Mol. Cell Biol. 1:11–21. [DOI] [PubMed] [Google Scholar]
- Birchall, A.M., J. Bishop, D. Bradshaw, A. Cline, J. Coffey, L.H. Elliott, V.M. Gibson, A. Greenham, T.J. Hallam, and W. Harris. 1994. Ro 32-0432, a selective and orally active inhibitor of protein kinase C prevents T-cell activation. J. Pharmacol. Exp. Ther. 268:922–929. [PubMed] [Google Scholar]
- Brini, M., R. Marsault, C. Bastianutto, J. Alvarez, T. Pozzan, and R. Rizzuto. 1995. Transfected aequorin in the measurement of cytosolic Ca2+ concentration ([Ca2+]c). A critical evaluation. J. Biol. Chem. 270:9896–9903. [DOI] [PubMed] [Google Scholar]
- Brini, M., D. Bano, S. Manni, R. Rizzuto, and E. Carafoli. 2000. Effects of PMCA and SERCA pump overexpression on the kinetics of cell Ca2+ signalling. EMBO J. 19:4926–4935. [DOI] [PMC free article] [PubMed] [Google Scholar]
- Challet, C., P. Maechler, C.B. Wollheim, and U.T. Ruegg. 2001. Mitochondrial calcium oscillations in C2C12 myotubes. J. Biol. Chem. 276:3791–3797. [DOI] [PubMed] [Google Scholar]
- Chiesa, A., E. Rapizzi, V. Tosello, P. Pinton, M. de Virgilio, K.E. Fogarty, and R. Rizzuto. 2001. Recombinant aequorin and green fluorescent protein as valuable tools in the study of cell signalling. Biochem. J. 355:1–12. [DOI] [PMC free article] [PubMed] [Google Scholar]
- Chun, J.S., M.J. Ha, and B.S. Jacobson. 1996. Differential translocation of protein kinase C epsilon during HeLa cell adhesion to a gelatin substratum. J. Biol. Chem. 271:13008–13012. [DOI] [PubMed] [Google Scholar]
- Clapham, D.E. 1995. Calcium signaling. Cell. 80:259–268. [DOI] [PubMed] [Google Scholar]
- Collins, T.J., P. Lipp, M.J. Berridge, and M.D. Bootman. 2001. Mitochondrial Ca2+ uptake depends on the spatial and temporal profile of cytosolic Ca2+ signals. J. Biol. Chem. 276:26411–26420. [DOI] [PubMed] [Google Scholar]
- Dekker, L.V., and P.J. Parker. 1994. Protein kinase C–a question of specificity. Trends Biochem. Sci. 19:73–77. [DOI] [PubMed] [Google Scholar]
- Dekker, L.V., R.H. Palmer, and P.J. Parker. 1995. The protein kinase C and protein kinase C related gene families. Curr. Opin. Struct. Biol. 5:396–402. [DOI] [PubMed] [Google Scholar]
- Duchen, M.R. 2000. Mitochondria and calcium: from cell signalling to cell death. J. Physiol. 529(Pt 1):57–68. [DOI] [PMC free article] [PubMed] [Google Scholar]
- Filippin, L., P.J. Magalhaes, G. Di Benedetto, M. Colella, and T. Pozzan. 2003. Stable interactions between mitochondria and endoplasmic reticulum allow rapid accumulation of calcium in a subpopulation of mitochondria. J. Biol. Chem. 278:39224–39234. [DOI] [PubMed] [Google Scholar]
- Francesconi, A., and R.M. Duvoisin. 2000. Opposing effects of protein kinase C and protein kinase A on metabotropic glutamate receptor signaling: selective desensitization of the inositol trisphosphate/Ca2+ pathway by phosphorylation of the receptor-G protein-coupling domain. Proc. Natl. Acad. Sci. USA. 97:6185–6190. [DOI] [PMC free article] [PubMed] [Google Scholar]
- Gonindard, C., C. Bergonzi, C. Denier, C. Sergheraert, A. Klaebe, L. Chavant, and E. Hollande. 1997. Synthetic hispidin, a PKC inhibitor, is more cytotoxic toward cancer cells than normal cells in vitro. Cell Biol. Toxicol. 13:141–153. [DOI] [PubMed] [Google Scholar]
- Goodnight, J.A., H. Mischak, W. Kolch, and J.F. Mushinski. 1995. Immunocytochemical localization of eight protein kinase C isozymes overexpressed in NIH 3T3 fibroblasts. Isoform-specific association with microfilaments, Golgi, endoplasmic reticulum, and nuclear and cell membranes. J. Biol. Chem. 270:9991–10001. [DOI] [PubMed] [Google Scholar]
- Griesbeck, O., G.S. Baird, R.E. Campbell, D.A. Zacharias, and R.Y. Tsien. 2001. Reducing the environmental sensitivity of yellow fluorescent protein. Mechanism and applications. J. Biol. Chem. 276:29188–29194. [DOI] [PubMed] [Google Scholar]
- Hajnoczky, G., L.D. Robb-Gaspers, M.B. Seitz, and A.P. Thomas. 1995. Decoding of cytosolic calcium oscillations in the mitochondria. Cell. 82:415–424. [DOI] [PubMed] [Google Scholar]
- Hajnoczky, G., R. Hager, and A.P. Thomas. 1999. Mitochondria suppress local feedback activation of inositol 1,4, 5-trisphosphate receptors by Ca2+. J. Biol. Chem. 274:14157–14162. [DOI] [PubMed] [Google Scholar]
- Jaken, S. 1996. Protein kinase C isozymes and substrates. Curr. Opin. Cell Biol. 8:168–173. [DOI] [PubMed] [Google Scholar]
- Jouaville, L.S., P. Pinton, C. Bastianutto, G.A. Rutter, and R. Rizzuto. 1999. Regulation of mitochondrial ATP synthesis by calcium: evidence for a long-term metabolic priming. Proc. Natl. Acad. Sci. USA. 96:13807–13812. [DOI] [PMC free article] [PubMed] [Google Scholar]
- Kennedy, E.D., R. Rizzuto, J.M. Theler, W.F. Pralong, C. Bastianutto, T. Pozzan, and C.B. Wollheim. 1996. Glucose-stimulated insulin secretion correlates with changes in mitochondrial and cytosolic Ca2+ in aequorin-expressing INS-1 cells. J. Clin. Invest. 98:2524–2538. [DOI] [PMC free article] [PubMed] [Google Scholar]
- Korshunov, S.S., V.P. Skulachev, and A.A. Starkov. 1997. High protonic potential actuates a mechanism of production of reactive oxygen species in mitochondria. FEBS Lett. 416:15–18. [DOI] [PubMed] [Google Scholar]
- Kroemer, G., and J.C. Reed. 2000. Mitochondrial control of cell death. Nat. Med. 6:513–519. [DOI] [PubMed] [Google Scholar]
- Maechler, P., E.D. Kennedy, H. Wang, and C.B. Wollheim. 1998. Desensitization of mitochondrial Ca2+ and insulin secretion responses in the beta cell. J. Biol. Chem. 273:20770–20778. [DOI] [PubMed] [Google Scholar]
- Majumder, P.K., P. Pandey, X. Sun, K. Cheng, R. Datta, S. Saxena, S. Kharbanda, and D. Kufe. 2000. Mitochondrial translocation of protein kinase C delta in phorbol ester-induced cytochrome c release and apoptosis. J. Biol. Chem. 275:21793–21796. [DOI] [PubMed] [Google Scholar]
- Mellor, H., and P.J. Parker. 1998. The extended protein kinase C superfamily. Biochem. J. 332(Pt 2):281–292. [DOI] [PMC free article] [PubMed] [Google Scholar]
- Mogami, H., H. Zhang, Y. Suzuki, T. Urano, N. Saito, I. Kojima, and O.H. Petersen. 2003. Decoding of short-lived Ca2+ influx signals into long term substrate phosphorylation through activation of two distinct classes of protein kinase C. J. Biol. Chem. 278:9896–9904. [DOI] [PubMed] [Google Scholar]
- Montero, M., M. Brini, R. Marsault, J. Alvarez, R. Sitia, T. Pozzan, and R. Rizzuto. 1995. Monitoring dynamic changes in free Ca2+ concentration in the endoplasmic reticulum of intact cells. EMBO J. 14:5467–5475. [DOI] [PMC free article] [PubMed] [Google Scholar]
- Montero, M., C.D. Lobaton, S. Gutierrez-Fernandez, A. Moreno, and J. Alvarez. 2003. Modulation of histamine-induced Ca2+ release by protein kinase C. Effects on cytosolic and mitochondrial [Ca2+] peaks. J. Biol. Chem. 278:49972–49979. [DOI] [PubMed] [Google Scholar]
- Moscat, J., M.T. Diaz-Meco, and P. Rennert. 2003. NF-kappaB activation by protein kinase C isoforms and B-cell function. EMBO Rep. 4:31–36. [DOI] [PMC free article] [PubMed] [Google Scholar]
- Nesher, R., and E. Cerasi. 1987. Biphasic insulin release as the expression of combined inhibitory and potentiating effects of glucose. Endocrinology. 121:1017–1024. [DOI] [PubMed] [Google Scholar]
- Nishizuka, Y. 1992. Intracellular signaling by hydrolysis of phospholipids and activation of protein kinase C. Science. 258:607–614. [DOI] [PubMed] [Google Scholar]
- Nucifora, F.C., Jr., S.H. Li, S. Danoff, A. Ullrich, and C.A. Ross. 1995. Molecular cloning of a cDNA for the human inositol 1,4,5-trisphosphate receptor type 1, and the identification of a third alternatively spliced variant. Brain Res. Mol. Brain Res. 32:291–296. [DOI] [PubMed] [Google Scholar]
- Oancea, E., and T. Meyer. 1998. Protein kinase C as a molecular machine for decoding calcium and diacylglycerol signals. Cell. 95:307–318. [DOI] [PubMed] [Google Scholar]
- Parekh, D.B., W. Ziegler, and P.J. Parker. 2000. Multiple pathways control protein kinase C phosphorylation. EMBO J. 19:496–503. [DOI] [PMC free article] [PubMed] [Google Scholar]
- Perego, C., D. Porro, and C.A. La Porta. 2002. Differential localisation of nPKC delta during cell cycle progression. Biochem. Biophys. Res. Commun. 294:127–131. [DOI] [PubMed] [Google Scholar]
- Pinton, P., T. Pozzan, and R. Rizzuto. 1998. The Golgi apparatus is an inositol 1,4,5-trisphosphate-sensitive Ca2+ store, with functional properties distinct from those of the endoplasmic reticulum. EMBO J. 17:5298–5308. [DOI] [PMC free article] [PubMed] [Google Scholar]
- Pinton, P., D. Ferrari, E. Rapizzi, F.D. Di Virgilio, T. Pozzan, and R. Rizzuto. 2001. The Ca2+ concentration of the endoplasmic reticulum is a key determinant of ceramide-induced apoptosis: significance for the molecular mechanism of Bcl-2 action. EMBO J. 20:2690–2701. [DOI] [PMC free article] [PubMed] [Google Scholar]
- Pozzan, T., R. Rizzuto, P. Volpe, and J. Meldolesi. 1994. Molecular and cellular physiology of intracellular calcium stores. Physiol. Rev. 74:595–636. [DOI] [PubMed] [Google Scholar]
- Rizzuto, R., A.W. Simpson, M. Brini, and T. Pozzan. 1992. Rapid changes of mitochondrial Ca2+ revealed by specifically targeted recombinant aequorin. Nature. 358:325–327. [DOI] [PubMed] [Google Scholar]
- Rizzuto, R., C. Bastianutto, M. Brini, M. Murgia, and T. Pozzan. 1994. Mitochondrial Ca2+ homeostasis in intact cells. J. Cell Biol. 126:1183–1194. [DOI] [PMC free article] [PubMed] [Google Scholar]
- Rizzuto, R., M. Brini, C. Bastianutto, R. Marsault, and T. Pozzan. 1995. Photoprotein-mediated measurement of calcium ion concentration in mitochondria of living cells. Methods Enzymol. 260:417–428. [DOI] [PubMed] [Google Scholar]
- Rizzuto, R., P. Pinton, W. Carrington, F.S. Fay, K.E. Fogarty, L.M. Lifshitz, R.A. Tuft, and T. Pozzan. 1998. Close contacts with the endoplasmic reticulum as determinants of mitochondrial Ca2+ responses. Science. 280:1763–1766. [DOI] [PubMed] [Google Scholar]
- Rizzuto, R., P. Bernardi, and T. Pozzan. 2000. Mitochondria as all-round players of the calcium game. J. Physiol. 529:37–47. [DOI] [PMC free article] [PubMed] [Google Scholar]
- Ruvolo, P.P., X. Deng, B.K. Carr, and W.S. May. 1998. A functional role for mitochondrial protein kinase Calpha in Bcl2 phosphorylation and suppression of apoptosis. J. Biol. Chem. 273:25436–25442. [DOI] [PubMed] [Google Scholar]
- Sajan, M.P., M.L. Standaert, G. Bandyopadhyay, M.J. Quon, T.R. Burke, Jr., and R.V. Farese. 1999. Protein kinase C-zeta and phosphoinositide-dependent protein kinase-1 are required for insulin-induced activation of ERK in rat adipocytes. J. Biol. Chem. 274:30495–30500. [DOI] [PubMed] [Google Scholar]
- Shirai, Y., and N. Saito. 2002. Activation mechanisms of protein kinase C: maturation, catalytic activation, and targeting. J. Biochem. (Tokyo). 132:663–668. [DOI] [PubMed] [Google Scholar]
- Skulachev, V.P. 1998. Possible role of reactive oxygen species in antiviral defense. Biochemistry (Mosc.). 63:1438–1440. [PubMed] [Google Scholar]
- Szalai, G., R. Krishnamurthy, and G. Hajnoczky. 1999. Apoptosis driven by IP(3)-linked mitochondrial calcium signals. EMBO J. 18:6349–6361. [DOI] [PMC free article] [PubMed] [Google Scholar]
- Tinel, H., J.M. Cancela, H. Mogami, J.V. Gerasimenko, O.V. Gerasimenko, A.V. Tepikin, and O.H. Petersen. 1999. Active mitochondria surrounding the pancreatic acinar granule region prevent spreading of inositol trisphosphate-evoked local cytosolic Ca2+ signals. EMBO J. 18:4999–5008. [DOI] [PMC free article] [PubMed] [Google Scholar]
- Toker, A. 1998. Signaling through protein kinase C. Front. Biosci. 3:D1134–D1147. [DOI] [PubMed] [Google Scholar]
- Wang, Q.J., D. Bhattacharyya, S. Garfield, K. Nacro, V.E. Marquez, and P.M. Blumberg. 1999. Differential localization of protein kinase C delta by phorbol esters and related compounds using a fusion protein with green fluorescent protein. J. Biol. Chem. 274:37233–37239. [DOI] [PubMed] [Google Scholar]
- Willems, P.H., B.A. Van den Broek, C.H. Van Os, and J.J. De Pont. 1989. Inhibition of inositol 1,4,5-trisphosphate-induced Ca2+ release in permeabilized pancreatic acinar cells by hormonal and phorbol ester pretreatment. J. Biol. Chem. 264:9762–9767. [PubMed] [Google Scholar]
- Yang, F., X.P. He, J. Russell, and B. Lu. 2003. Ca2+ influx–independent synaptic potentiation mediated by mitochondrial Na+-Ca2+ exchanger and protein kinase C. J. Cell Biol. 163:511–523. [DOI] [PMC free article] [PubMed] [Google Scholar]
- Zylinska, L., D. Guerini, E. Gromadzinska, and L. Lachowicz. 1998. Protein kinases A and C phosphorylate purified Ca2+-ATPase from rat cortex, cerebellum and hippocampus. Biochim. Biophys. Acta. 1448:99–108. [DOI] [PubMed] [Google Scholar]