Abstract
Mathematical modeling is required for understanding the complex behavior of large signal transduction networks. Previous attempts to model signal transduction pathways were often limited to small systems or based on qualitative data only. Here, we developed a mathematical modeling framework for understanding the complex signaling behavior of CD95(APO-1/Fas)-mediated apoptosis. Defects in the regulation of apoptosis result in serious diseases such as cancer, autoimmunity, and neurodegeneration. During the last decade many of the molecular mechanisms of apoptosis signaling have been examined and elucidated. A systemic understanding of apoptosis is, however, still missing. To address the complexity of apoptotic signaling we subdivided this system into subsystems of different information qualities. A new approach for sensitivity analysis within the mathematical model was key for the identification of critical system parameters and two essential system properties: modularity and robustness. Our model describes the regulation of apoptosis on a systems level and resolves the important question of a threshold mechanism for the regulation of apoptosis.
Keywords: mathematical modeling; CD95-induced apoptosis; sensitivity analysis; parameter estimation; threshold mechanism
Introduction
Apoptosis is one of the most complex signaling pathways (Gilman et al., 2002) and an essential property of all higher organisms. Defects in apoptosis result in a number of serious diseases such as cancer, autoimmunity, and neurodegeneration (Krammer, 2000; Peter and Krammer, 2003). To develop efficient therapies, fundamental questions about molecular mechanisms and regulation of apoptosis remain to be answered.
Apoptosis is triggered by a number of factors, including UV light, γ radiation, chemotherapeutic drugs, growth factor withdrawal (“death by neglect”), and signaling from the death receptors (Ashkenazi and Dixit, 1999; Nagata, 1999). Apoptosis pathways can generally be divided into signaling via the death receptors (extrinsic pathway) or the mitochondria (intrinsic pathway). Both pathways imply caspases as effector molecules (Thornberry and Lazebnik, 1998; Salvesen, 2002).
CD95-induced apoptosis is one of the best-studied apoptosis pathways. CD95 is a member of the death receptor family, a subfamily of the TNF-R superfamily. Cross-linking of CD95 either with its natural ligand, CD95L, or with agonistic antibodies, such as anti–APO-1, induces apoptosis in sensitive cells. Upon CD95 stimulation the death-inducing signaling complex (DISC) is formed. The DISC consists of oligomerized CD95, the death domain (DD) containing adaptor molecule FADD, procaspase-8, procaspase-10, and c-FLIP (c-FLIP occurs in two splice forms, c-FLIPL and c-FLIPS). As a result of CD95 DISC formation procaspase-8 is autocatalytically cleaved at the DISC resulting in the formation of active caspase-8 starting the apoptotic signaling cascade (Lavrik et al., 2003). Two CD95-signaling pathways were established. Type I cells are characterized by intensive DISC formation and mitochondria-independent caspase-3 activation. In type II cells the formation of the DISC complex is reduced and the activation of caspase-3 occurs downstream of the mitochondria: the active form of caspase-8 cleaves Bid, followed by tBid translocation to mitochondria resulting in the release of cytochrome C, apoptosome formation, and the activation of caspase-9, which then activates caspase-3 triggering the subsequent apoptotic events.
Despite the ever-increasing number of studies on CD95-induced apoptosis, a systemic understanding of this complex signaling pathway is still missing. It is well accepted that the system response to, for example, biochemical intervention of the apoptotic signaling pathway is regulated by many different factors at a time. The question of a threshold for induction of apoptosis plays a central role in our understanding of the sensitivity and resistance of cells toward various chemotherapeutic agents.
There is no experimental approach available at present that allows monitoring of immediate and long-term changes of all affected molecules in the course of apoptosis. Here, a mathematical model of apoptosis integrating the presently distributed and heterogeneous knowledge about apoptosis in an integrated model would be of great benefit, since it allows the identification of most sensitive signaling molecules and predictions on the systemic behavior of apoptotic signaling, e.g., upon stimulation by different molecules or through interaction of chemotherapeutics. Besides the formulation of biological hypotheses, a mathematical model would be also very beneficial for the design of new experiments by suggesting the most promising next experiments to experimentally address a specific biological question.
Mathematical modeling has a long tradition in biomedical applications and bioengineering. For the analysis and a better understanding of metabolic networks, kinetic pathway models were constructed using a diversity of mathematical and computational methods (Kell and Westerhoff, 1986; Heinrich and Schuster, 1996; Schilling et al., 1999). This development ranges from the examination of steady-states and flux modes to a large variety of control theories. More recently, theoretical models for describing the complex signaling behavior on system levels have been developed (Lauffenburger, 2000; Csete and Doyle, 2002; Kitano, 2002). Models of signal transduction networks are either based on discrete models describing signaling as information processing (Regev et al., 2001) or on continuous models where the information flux is modeled by a biochemical reaction network. In the latter case, the reaction network is translated into a system of ordinary differential equations (Sauro and Fell, 1991; Mendes, 1997; Bhalla and Iyengar, 1999).
A robust and reliable mathematical simulation of signal transduction networks requires quantitative information on reaction rates and molecular concentrations. For most reactions and molecules, these parameters are not directly accessible in vivo. Existing signal transduction data usually refers to different experimental settings, cell types and states of cells and can therefore practically not be used for quantitative models of signal transduction. Further, signaling processes are described on different levels of information quality ranging from mechanistically well-understood interactions to purely qualitative processes like activation or inhibition.
Accordingly, mathematical simulations of signal transduction networks typically address well-investigated pathways where most biochemical mechanisms are well understood (Kholodenko et al., 1999; Schoeberl et al., 2002). In a recent data-based study on the JAK-STAT pathway, Swameye et al. (2003) reliably measured data and parameter estimation (Mendes and Kell, 1998), i.e., the determination of values of unknown model parameters to provide an optimal fit between the simulation and experimental data, and these have been suggested as key components for model identification (Deuflhard, 1983) and reliable quantitative simulations. However, the number of assessable parameters and therefore the maximum size of the model have been very limited due to the large amount of experimental data required for high-dimensional parameter estimation problems and the curse of dimensionality. Curse of dimensionality refers to the problem that the space of possible sets of parameter values grows exponentially with the number of unknown parameters severely impairing the search for the globally optimal parameter values. In a first attempt to theoretically describe apoptotic signaling a mathematical model including more than 20 reactions was proposed (Fussenegger et al., 2000). However, this model was based on ad hoc fixed parameters and thus its potential for understanding the regulation of apoptosis remains very limited.
Here, we will present an approach overcoming the present obstacles in large-scale modeling of signal transduction networks. Our approach integrates information on various different levels in a unified form. We will derive a data-based model of CD95-induced apoptosis with parameters estimated on the basis of quantitative experimental data. Our numerical simulations thus allow the prediction of the systemic behavior of CD95-induced apoptosis including a mechanism for the regulation of apoptosis, which will be demonstrated in detail here for the first time. By validating our model hypotheses experimentally, we will show how through iteration of theoretical modeling and experiments we will gain a new insights into the regulation of apoptosis that would have not been achieved with either the theoretical or experimental part missing.
Results
Structured information model of CD95-induced apoptosis
We reconstructed the network topology of CD95-induced apoptosis by critically searching databases (e.g., Schacherer et al., 2001; http://www.biobase.de/) and the literature. Molecules and reactions directly or indirectly interacting with the known components of this pathway were incorporated leading to a model with ∼70 molecules, 80 reactions, and more than 120 unknown parameters (data not shown). This complexity cannot be matched by experimental data at present.
To reduce the complexity of the model without sacrificing essential components of the network, we incorporated subunits of different information qualities: reactions with well-understood biochemical mechanisms, e.g., those of the DISC-system or of the caspases, were modeled mechanistically. For all other interactions, “black boxes” were introduced, defined by their experimentally observed input–output behavior (see Online supplemental material). Notably, these black boxes do not assume knowledge of the exact underlying mechanisms. Subsystems (boxes) were identified according to the following criteria: the input–output behavior should be measurable, the number of input–output variables should be low, subsystems should represent real functional systems (e.g., mitochondria) and the information within one subsystem should be on the same level. The decomposition of the complete system into subsystems is an iterative and adaptive process. Based on new experimental data, a subsystem might be split into further subsystems.
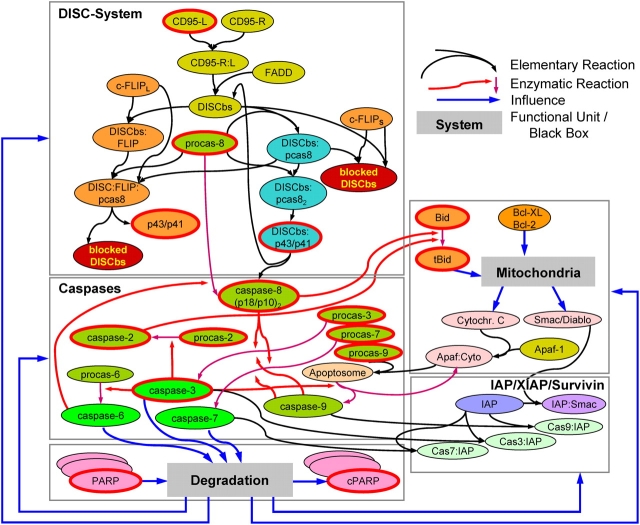
A great advantage of the so-obtained “structured information model” is that it combines heterogeneous information in one model instead of dealing with isolated models. The resulting model of CD95-induced apoptosis consists of 41 molecules (or complexes), 32 reactions, and 2 black boxes (Fig. 1). However, this simplified model still contains more than 50 missing parameters and requires further reduction of complexity to allow robust parameter estimation (see Online supplemental material) given the limited number of data points.
Figure 1.
Structured information model of CD95-induced apoptosis. In the mechanistic part (DISC, Caspases, IAP), interactions are modeled as elementary reactions including competitive inhibitions and enzymatic reactions. Receptors are activated by ligands initiating the DISC formation. After binding to the DISC binding site (DISCbs), procaspase-8 is cleaved (initiator caspase), followed by the activation of executioner caspases (-3, -6, -7). PARP cleavage was chosen as experimental end-point of the pathway. The mitochondria and the degradation process, which influences all molecules, are modeled as black boxes defined by their input-output behavior (see Online supplemental material). Each reaction contains one or more unknown parameters. Experimental time series were measured for all molecules framed in red. For details on reactions and parameters see Table SI. Note that due to model simplifications some molecule species are replaced by virtual substitutes (e.g., XIAP and IAP1/2→”IAP”).
Sensitivity analysis reveals intrinsic system behaviors and leads to reduction of system complexity
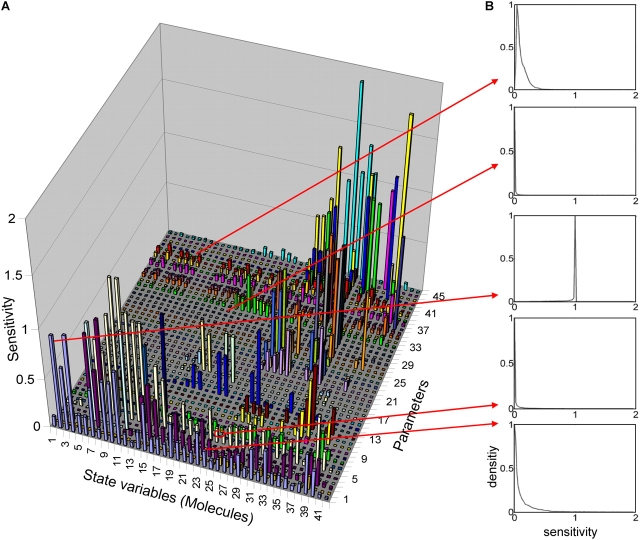
For reduction of complexity, we identified the most critical system parameters by sensitivity analysis. Sensitivities describe the relative changes of molecule concentrations (and therefore of the system behavior) as a result of changes of the parameters. Considering, in general, sensitivities can be determined for specific sets of parameters only (local sensitivity analysis), the usefulness of sensitivity analysis is limited if most parameters are unknown at first. In a virtual experiment, we therefore determined sensitivities for a large number of randomly chosen points in parameter space within specified ranges, covering more than three orders of magnitude (see Materials and methods). Surprisingly, the distribution of most sensitivities showed distinct and narrow peaks (Fig. 2) indicating that most sensitivities of the system are highly robust to large variations in parameter values.
Figure 2.
Sensitivity matrix of parameters and molecules. (A) The sensitivity matrix (sij) shows the relative changes of the concentrations of molecule i (left to right) due to a change of parameter j (front to back). The indices refer to Table SI. Sensitivities are low in general (≪1) indicating high robustness. The sensitivities of the executioner caspases (Fig. S1) are extremely low indicating the extreme robustness of the core functionality of the apoptotic system. (B) Sensitivity of sensitivities: each box shows one histogram for a specific sensitivity, calculated for 300,000 randomly chosen points in parameter space. X axis: sensitivity; Y axis: relative density of occurrence (weighted with a Boltzmann-distribution; see Online supplemental material). The histograms shown here are representative for the complete matrix. They show distinct and narrow peaks in most cases. Sensitivities with a clear peak close to zero indicate that the respective molecule concentration is insensitive to the respective parameter (an important property for further modularization).
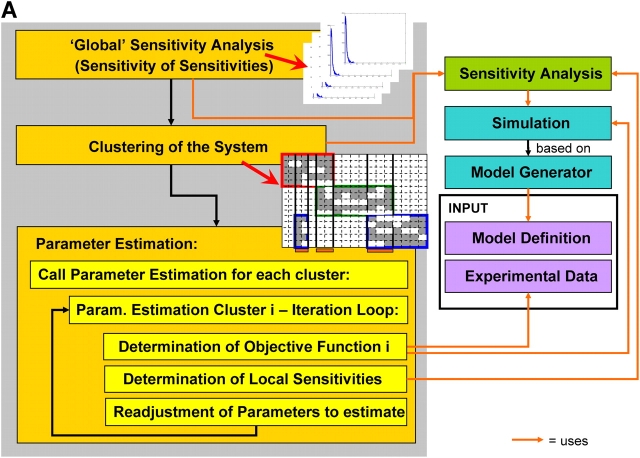
The sensitivity analyses led us to a further inherent system property, the modularity of the apoptotic signaling pathway. Apparently, clusters can be identified that contain a subset of molecules whose concentrations depend on a subset of parameters only (Fig. 2 and Fig. S2). In addition to these parameters that can be efficiently estimated locally there are global parameters belonging to more than one cluster. To address the problem of global parameters we designed a hierarchical approach where parameter estimation is performed on two levels. On the upper level, global parameters are estimated by optimising all clusters: for each cluster, parameter estimation is recursively called at the lower level. The low-level parameter estimation depends on the global parameter values proposed by the algorithm on the upper level, but is independent of local parameters within other clusters (see Online supplemental material). In a second step, we introduced a sensitivity control within the parameter estimation algorithm, which calculates the local sensitivities after each step in parameter space to determine a subset of parameters relevant for the next estimation step (see Online supplemental material). As a result of the sensitivity control within the parameter estimation the value for the objective function related to the optimal fit could be decreased by one to two orders of magnitude. The system dimensionality was reduced from 58 unknown parameters to 18.
Experimental design for probing regulatory mechanisms of CD95-induced apoptosis
Based on the results of the sensitivity analysis we designed a set of experiments to measure time series of concentrations of 15 different molecules after activation of CD95 receptors (Fig. 1). For our experiments, we chose the human B lymphoblastoid cell line SKW 6.4, classified previously as type I cells by their high amount of DISC formation. These cells are highly sensitive to CD95-mediated apoptosis. Cells were stimulated with different concentrations of agonistic anti–APO-1 antibody or LZ-CD95L for various periods of time (from 5 min to 4 d). Each sample was evaluated by three independent approaches. Cell death was determined by flow cytometry, caspase activity was measured by fluorometric activity, and the change of concentration of major apoptotic molecules was evaluated by Western blot. For all measurements, standardization of experiments was crucial.
To standardize the assays, SKW 6.4 cells were taken from the logarithmic growth phase. To ensure the linear relation between the antigen and the strength of the signal in the Western blot, serial dilutions of recombinant proteins or cell lysates were probed with various antibodies. Quantification of chemiluminescence showed good linearity in proportion to the amount of an antigen (Fig. S3). Thus, the following Western blot experiments were performed using the same concentrations of the antibodies.
In a first set of experiments, time series were measured for a “fast” activation scenario with an oversaturated ligand concentration corresponding to more than one ligand per CD95 receptor. Oversaturation was achieved by 5 μg/ml anti–APO-1 corresponding to a ligand–receptor ratio of ∼5:1. The ratio was determined under the assumption that there are ∼40,000 CD95 receptors per cell. This number was estimated from measurements by flow cytometry (data not shown).
A good fit between model simulation and experimental data could be achieved reproducing the fast cleavage of procaspase 8 into its active form, followed by activation of the executioner caspases and cleavage of Bid and PARP (Fig. 3 and Fig. 4, A–C). We conclude that the mathematical model is well suited to quantitatively describe the activation of CD95-induced apoptosis. However, the model is still underdetermined, i.e., different model parameter settings are able to match the same experimental data. Accordingly, generalization of the model for biological predictions is likely limited. Therefore, we decided to gain more information about the system by measuring different activation scenarios with lower initial ligand concentrations and to base the parameter estimation on these multiple conditions (Fig. 5 B and Fig. 6). Thus, an integrated model including different activation scenarios was automatically generated. The integrated model is based on a common set of biochemical parameters but different initial values of ligand concentration. It fits several activation scenarios as a result of one combined parameter estimation step (Fig. 4, A–E).
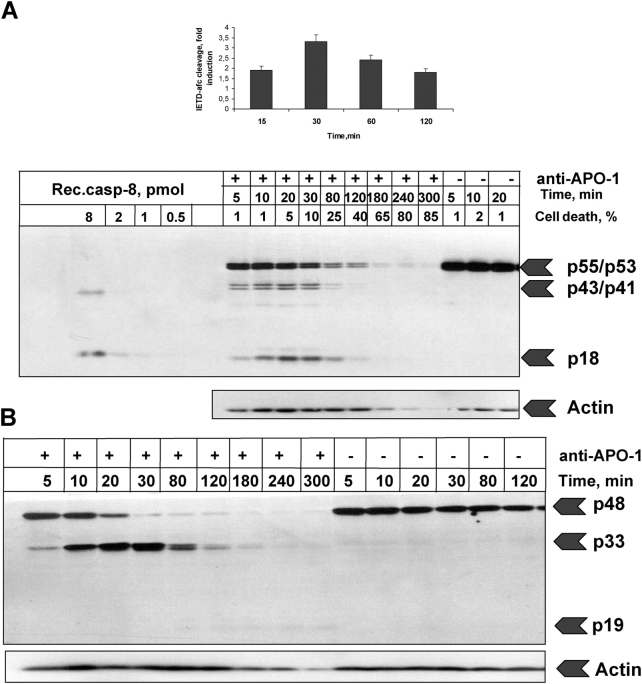
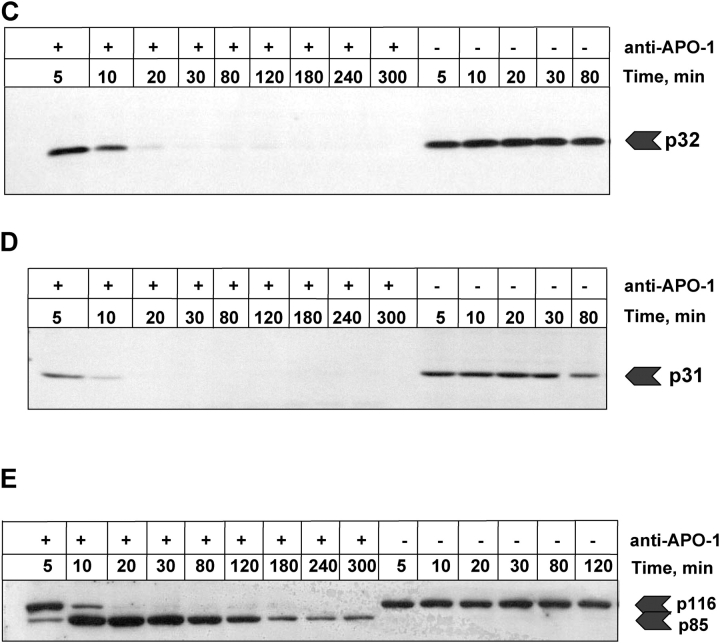
Figure 3.
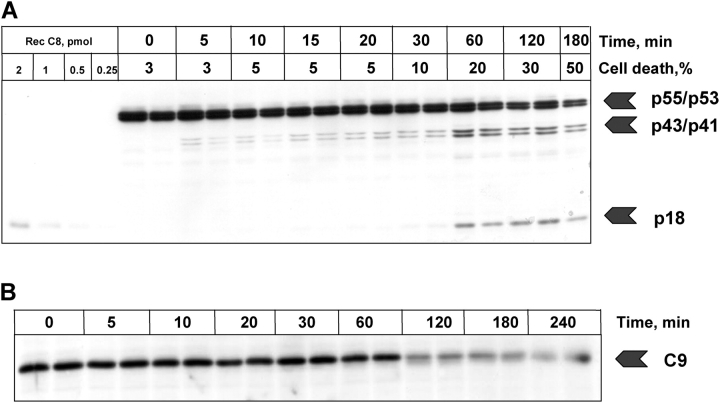
Experimental data obtained for the fast activation scenario. Anti–APO-1 antibodies were added to SKW 6.4 cells in a concentration of 5 μg/ml and the samples were incubated at 37°C for various time points. Unstimulated cells were incubated in parallel for the same amount of time. (A) The cleavage of procaspase-8 was analyzed by Western blotting using anti–caspase-8 monoclonal antibodies. The positions of procaspase-8 (p55/p53) and the respective cleavage fragments are indicated. Recombinant caspase-8 in serial dilutions was loaded on the same Western blot for calibration. Above each lane the percentage of cell death is presented. As a loading control we used anti-actin monoclonal antibodies. The caspase-8 activity was analyzed using a fluorometric activity assay with z-IETD-afc. Data are presented from three independent experiments. (B) The processing of procaspase-2 was analyzed by Western blotting using anti–caspase-2 monoclonal antibodies. The positions of procaspase-2 and the respective cleavage fragments are indicated. (C and D) The processing of procaspases-3 and -7 was analyzed by Western blotting with corresponding antibodies. (E) Analysis of PARP cleavage by Western blotting.
Figure 4.
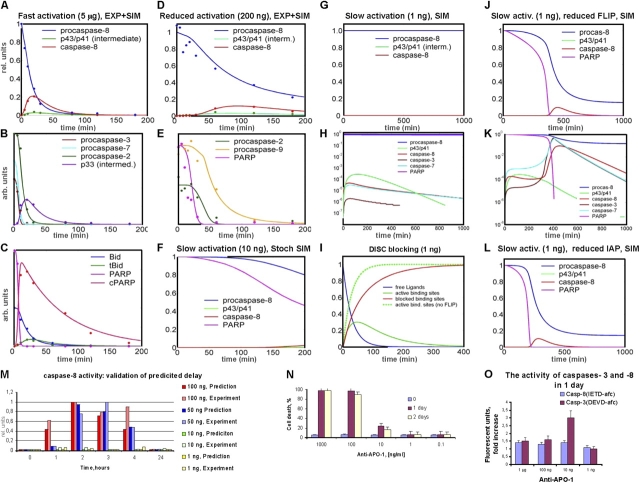
Model predictions and experimental validation. (A–E) Parameter estimation on the basis of fast and reduced activation scenarios (5 μg/ml and 200 ng/ml of anti–APO-1, respectively) led to a good fit between model simulations (SIM, solid lines) and experimental data (EXP, dots) for both scenarios. (A) The high ligand concentration leads to an early activation of receptors, followed by fast DISC formation, resulting in a high cleavage capacity of procaspase-8 via the intermediate product (p43/p41). (B and C) Early generation of active caspase-8 is followed by the cleavage of caspase-3, -7, and -2 as well as by cleavage of Bid and PARP. After PARP cleavage, decomposition of cellular components starts. (D and E) The model computed for slower activation (200 ng/ml) using the same set of biochemical parameters. Due to the smaller percentage of receptors activated by ligands, the capacity of caspase-8 cleavage is much lower. However, there is still a cleavage of 100% of the executioner caspases and PARP resulting in apoptosis. (F–I) To test the hypothesis of a threshold behavior of CD95-induced apoptosis, activation was simulated for even lower ligand concentrations (10 and 1 ng/ml, respectively) using the estimated parameter set previously. Note that for the intermediate activation strength of 10 ng/ml we applied stochastic instead of deterministic simulations (for details see Online supplemental material and Bentele and Eils, 2004). As expected, caspase-8 cleavage is slowing down (F). However, for 1 ng/ml (G) the death process was completely stopped. Active caspase-8 and all the subsequent caspases could not be generated in a number sufficiently high to trigger apoptosis (H, log-scale). According to the model, c-FLIP is blocking the low number of active DISCs (see red and green curve in I) before caspase-8 can be generated in a sufficiently high amount. Without c-FLIP, the number of active DISCs and therefore their cleavage capacity would be significantly higher (dotted line in I). (J and K) The simulation for c-FLIP reduced by 75% shows a slow and steady cleavage of procaspase-8 until caspase-3 is generated in a number sufficiently high to trigger the feedback loop via caspase-6, accelerating the activation of caspase-8 and resulting in apoptosis after a delay of many hours (compare H and K on a log-scale). (L) A similar effect could be simulated for IAP reduced by 75% showing the importance of this inhibitor in case of slow activations (compare G and L). (M) Caspase-8 activity: the model predictions for slow activation scenarios (ligand concentrations between 100 and 1 ng/ml) were confirmed by experiments. In particular, the predicted delay of caspase activation was quantitatively validated. In the 10 ng/ml activation scenario, a significant increase of active caspase-8 was observed after more than 4 h (data not shown) as predicted in panel F, whereas no increase occurred for 1 ng/ml. (N) The death rates are in a good agreement with the model, which predicts triggering of the death process for the scenarios of 10 ng/ml and above. However, the measured death rate for 10 ng/ml was below 100%. Note that these rates were measured for a population of many cells whereas deterministic simulations address single cells (or a population of many cells with exactly the same parameters and initial conditions, respectively). Variability of parameters and of numbers of ligands as well as intrinsic stochastic effects due to low particle numbers might account for fluctuations in scenarios close to the activation threshold. Accordingly, simulations for slightly different parameter values in this scenario showed that the time-point of apoptosis is highly variable or apoptosis does not take place at all (data not shown) resulting in a death rate of below 100% for the cell population. (O) In the subthreshold scenario, only an extremely low increase of active caspase-8 and no increase of active caspase-3 was measured (y axis shows the -fold increase). For higher ligand concentrations, the low caspase activity is due to prior degradation. Y axis for A–L: arbitrary units (except for A and D where the [pro-]caspase concentrations are directly comparable and thus given in relative units). The standard deviation of experimental data was 20% on average.
Figure 5.
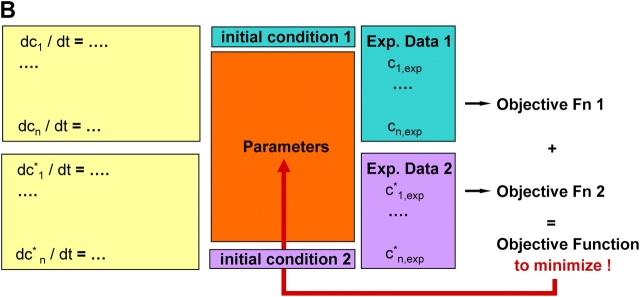
Framework for modeling and simulation of large signal transduction networks. (A) Before parameter estimation, sensitivities are determined for randomly chosen points in parameter space. All sensitivities with a distinct peak close to zero are considered irrelevant (compare Fig. 2). In the next step (clustering), irrelevant sensitivities are removed (white squares), and the matrix is rearranged in a way that provides independent clusters (see Online supplemental material). On this basis, the parameter estimation is performed for each cluster independently by minimization of the respective objective function. In case of global parameters, the parameter estimation for the single clusters is recursively called within the parameter estimation for the global parameters. The right-hand side displays the core part of the computational system. Whenever sensitivity analysis is applied or the objective function has to be determined for parameter estimation, the simulation is started with a certain parameter set. The simulation is based on the biochemical reaction equations and on the definition of the black boxes, which are automatically translated into a system of differential equations (model generation). The result of the simulation is used to evaluate sensitivities and the objective function by comparing model predictions with experimental data. (B) Additional information can be gained by measuring the dynamic system behavior under different initial conditions. The unknown parameters are estimated for all different initial conditions at once. These scenarios are simulated in parallel. The maximum likelihood estimation minimizes the sum of the respective objective functions depending on the corresponding experimental datasets.
Figure 6.
Activation with lower ligand concentration. Anti–APO-1 antibodies were added to SKW 6.4 cells in a concentration of 200 ng/ml and the samples were incubated at 37°C for various time points. (A) The cleavage of procaspase-8 was analyzed by Western blotting using anti–caspase-8 monoclonal antibodies. The positions of procaspase-8 (p55/p53) and the respective cleavage fragments are indicated. (B) The cleavage of procaspase-9 was analyzed by Western blotting using anti–caspase-9 monoclonal antibodies. (C) The processing of procaspase-2 was analyzed by Western blotting. (D) Analysis of PARP cleavage.
Threshold mechanism for CD95-induced apoptosis: model prediction and experimental validation
Both the model predictions and the experimental data show that with decreasing ligand concentrations apoptosis is slowed down considerably; however, cell death is still achieved. To address the question whether the apoptotic process slows down continuously with lower ligand concentrations or whether there is a threshold for induction of apoptosis at a distinct receptor–ligand ratio, we simulated induction of apoptosis for very low ligand concentrations. Our model predicts that below a critical concentration corresponding to a ligand–receptor ratio of ∼1:102, apoptosis is completely stopped (Fig. 4, F–H). This prediction was validated by experiments (Fig. 4, M–O).
It remains puzzling that even for the below-threshold scenario a sufficient number of receptors should be activated to cleave procaspase-8, thereby triggering all subsequent caspases. In the model, the caspase-8 cleavage capacity at the DISC is assumed to be proportional to the number of active CD95 receptors since the DISCs are supposed to remain active after cleaving procaspase-8 molecules. Consequently, the rate of caspase-8 cleavage continuously decreases with a lower ligand concentration. In an intuitive interpretation, one would thus assume that even for a very low ligand concentration apoptosis should not be stopped entirely, but would only be delayed. We addressed the apparent contradiction between model prediction and intuitive considerations by elucidating the exact mechanism of this threshold behavior and by revealing the responsible molecules and molecular interactions in our model.
Binding of the short and the long variants of c-FLIP to the DISC competes with activation of caspase-8 (Krueger et al., 2001). According to the parameter estimation, there are many more CD95 receptors and procaspase-8 molecules than c-FLIP molecules. Note, that we consider this estimate very reliable since the quality of our parameter fit was highly sensitive with respect to different models of c-FLIP interactions (Fig. S4) and different parameter settings in this part of the model. The cleavage rate of procaspase-8 is dependent on the number of active receptors. Whenever c-FLIP binds to a DISC, the respective binding site is blocked. The simulation of a scenario with subthreshold concentrations of activating ligand shows a steady decrease of active DISCs until all of them are blocked by c-FLIP (Fig. 4 I).
As a consequence, the simulation shows a limited generation of the intermediate caspase-8 cleavage product p43/p41, mainly due to the presence of c-FLIPL (Fig. 4, G and H), but no significant generation of active caspase-8 as a result of the early and complete DISC blockage. In contrast, the simulation for a ligand–receptor ratio above the threshold shows an entirely different behavior: due to the higher number of active receptors, the amount of c-FLIP is not sufficient to block all DISCs before active caspase-8 can be generated in a quantity that is sufficient to trigger apoptosis. Thus, the c-FLIP mechanism identified in the model can be considered a switch, which blocks the activation of caspase-8 for signals (ligand concentrations) below a critical quantity and passes on the activation signal above this level. As a consequence, the threshold is highly sensitive to the concentration of c-FLIP (Fig. 4, J and K).
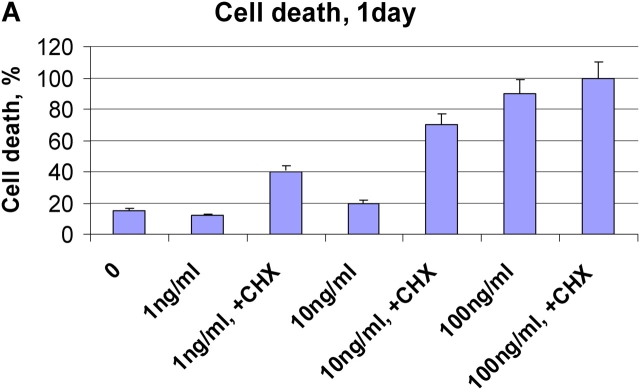
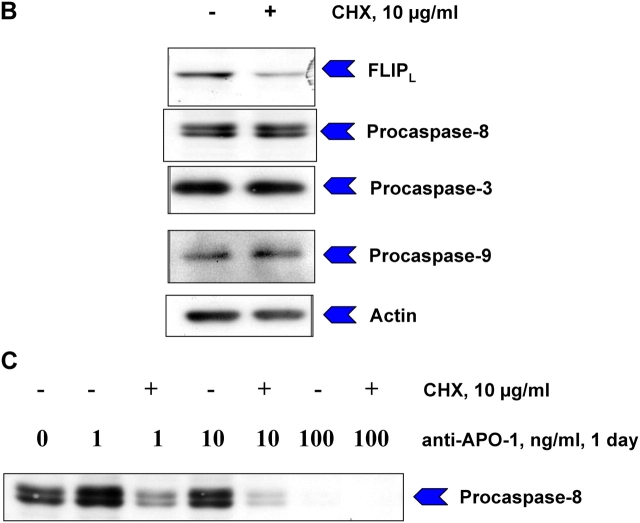
To confirm the model predictions experimentally we down-regulated FLIP level in SKW6.4 cells using translation inhibitor cyclohexamide (CHX; Fig. 7). The addition of CHX decreased c-FLIP level up to 70% and did not change the amount of procaspase-8 (Fig. 7). Down-regulation of c-FLIP under these conditions resulted in cell death already occurring upon a ligand concentration of only 1 ng/ml. This concentration was shown both experimentally and theoretically to be below the critical value required for apoptosis without CHX. These experiments show the important role of c-FLIP concentration in the regulation of CD95-induced apoptosis and clearly confirm our model predictions (Fig. 4, J and K).
Figure 7.
Summary sentence to be provided. (A) SKW 6.4 cells were treated with CHX for 2 h. Thereafter, cells were stimulated with indicated concentrations of anti–APO-1 antibodies for one day. Cell death was determined using FACS analysis. (B) Amounts c-FLIP and procaspases-8, -3, and -9 before and after CHX treatment were analyzed by immunoblotting. (C) SKW 6.4 cells were treated with CHX and anti–APO-1 antibodies as in A. The cleavage of procaspase-8 was analyzed by Western blotting using anti–caspase-8 antibody.
Model-based hypothesis checking of competing threshold mechanisms
We then used our modeling framework to address the discussion about threshold mechanisms involving downstream inhibitors like IAP or XIAP (Silke et al., 2001; Salvesen and Duckett, 2002). Especially in the case of a low caspase-8 activity, IAP concentration is highly relevant because it directly influences the critical caspase-8 activity, above which the feedback amplification loop caspase-8→caspase-3→caspase-6→caspase-8, is triggered. The triggering of this loop is highly sensitive with respect to the concentration of active caspase-8. Once the loop is triggered via caspase-3 cleaved by caspase-8, the death process cannot be stopped anymore (point of no return).
Thus, we considered IAP to induce a similar threshold mechanism by efficiently blocking caspase-3 up to a critical quantity only. Above this quantity, we predict that caspase-3 starts the irreversible death process by triggering the amplification loop. Consequently, for low IAP concentrations, this loop becomes active for decreased concentrations of active caspase-8 resulting in a complete cell death (Fig. 4 L), whereas high IAP concentrations either inhibit or delay this event for many hours or days. Thus, IAP also influences the threshold of ligand concentration, however, IAP alone is not sufficient to inhibit apoptosis in the absence of c-FLIP, since it can block signaling only in case of low caspase-8 activities. Therefore, the influence of IAP is low for ligand concentrations significantly above the threshold. Consequently, our model suggests that the main threshold of CD95-induced apoptosis is determined upstream in the DISC by preventing a steady increase of active caspase-8 resulting in the triggering of the amplification loop for subthreshold ligand concentrations.
The ratio between active receptors and c-FLIP as well as the ratio between binding rates of c-FLIP to DISC and of procaspase-8 to DISC, respectively, are highly relevant parameters for this threshold (Fig. 4, J and K). Another important model prediction addresses the system behavior above the threshold, where the combination of the c-FLIP mechanism with the amplification loop does not lead to a steadily decreased caspase cleavage rate upon a decreased ligand concentration. Instead, the caspase cleavage, the amplification loop and the subsequent death process are supposed to be delayed, but still complete (Fig. 4, M and N), until it is entirely stopped below the threshold. Thus, low ligand concentrations above the threshold result in no observable system changes (e.g., caspase activation) for up to many hours until the caspases abruptly become active and the complete death process starts without any external stimulation of the system.
Experimental validation of threshold mechanism
We experimentally verified the proposed threshold mechanism by testing the model predictions for several scenarios. The caspase-8 activation was measured for a series of lower ligand concentrations, quantitatively confirming the predicted delays, the complete cleavage of procaspase-8 above and the blockage of the active caspase-8 generation below the threshold (Fig. 4, M, H, and O). To prove the proposed mechanism, we systematically scanned the activity of up- and downstream molecules below the threshold.
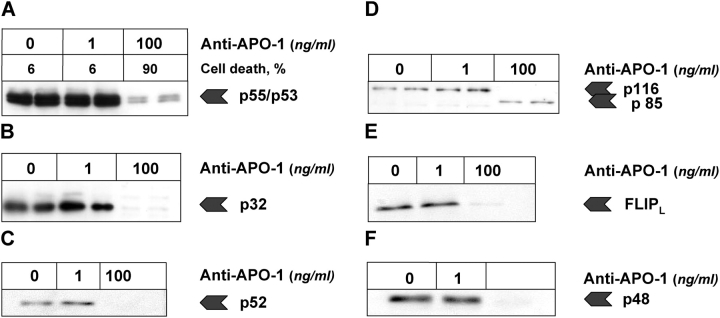
The experiments confirmed that a low amount of p43/41 and an extremely low amount of active caspase-8 were generated below the critical activation threshold as predicted by the model (Fig. 4 O and H). We did not observe any significant activity of caspase-3, which would (according to the simulation) otherwise have triggered the feedback loop (Fig. 4 O). Further, neither PARP cleavage nor cell death (Fig. 8 and Fig. 4 N) was observed. This is a clear indication that the main signal is stopped upstream at the DISC by c-FLIP, and that IAP, the second important inhibitor, prevents the sensitive caspase-3 activity from reaching a significant level upon low amounts of caspase-8 as predicted by simulation.
Figure 8.
Activation with threshold ligand concentration. Anti–APO-1 antibodies were added to SKW 6.4 cells in concentrations of 100 and 1 ng/ml, respectively, and the samples were incubated at 37°C for 1 d. For 1 ng/ml, neither cell death nor any significant caspase-3 and -8 activities were observed (compare Fig. 4). Upon stimulation with 100 ng/ml the cells were dead after 1 d and some residual caspase-3 and -8 activities were monitored. The levels of expression of different apoptotic molecules were monitored by Western blot and are presented for (A) procaspase-8, (B) procaspase-3, (C) procaspase-9, (D) c-Flip, (D) PARP, and (E) procaspase-2.
Discussion
Mathematical framework provides basis for modeling and simulation of complex biochemical pathways
In the present study, we showed that the mathematical model of CD95-induced apoptosis provides novel insights into important regulatory mechanisms for induction of apoptosis. We were able to develop a data-based mathematical model for a very complex signaling pathway such as programmed cell death that was thoroughly validated by experiments. The problem of high number of unknown parameters could be resolved by incorporating parameter sensitivities into the parameter estimation, thus drastically reducing the complexity of the problem. Two inherent system properties, i.e., modularity and high robustness (Alon et al., 1999; Carlson and Doyle, 2002) of parameter sensitivities, which were revealed by our mathematical model, in particular by the new concept of “sensitivity of sensitivities,” were essential here. Different levels of information were incorporated by additionally using black boxes described by their observed input–output behavior where exact knowledge on biochemical reactions is missing.
The developed framework (Fig. 5 A) provides a general basis for large-scale modeling and simulation of complex biochemical networks including signal transduction pathways and metabolic networks. The proposed method for automatic model reduction can be readily applied to other applications such as modeling of pathways involved in cell proliferation and differentiation. The widely used approach of manually simplifying models before parameter fitting is time-consuming and potentially introduces a user bias into the model. In contrast, the intrinsic reduction of the model dimensionality proposed here is systematic and adaptive to both the original model and the experimental data. Further, the techniques applied here, like combination of heterogeneous information levels or modularization of parameter estimation, are based on very general properties of biochemical networks and are well-adapted to the presently limited availability of reliable kinetic data.
Model-based hypothesis checking for qualitative assessment of regulatory mechanism for CD95-induced apoptosis
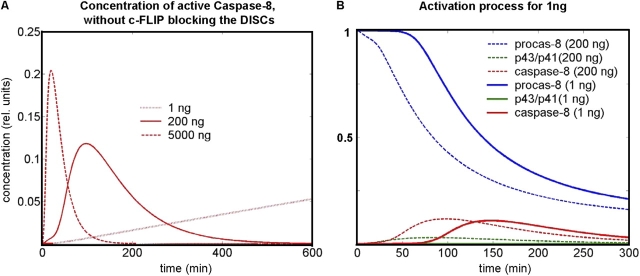
An important result of this combined theoretical and experimental approach was the resolution of the question of a threshold mechanism for regulation of CD95-mediated apoptosis. This regulatory mechanism is closely related to the upstream factor c-FLIP that efficiently blocks caspase-8 activation at the DISC at low ligand concentrations thus stopping the apoptotic program. To probe this regulatory mechanism in silico, alternative mechanisms disregarding the impact of c-FLIP were simulated assuming that procaspase-8 is steadily cleaved at the DISC and the cleavage rate depends on the number of active receptors. The parameters for the cleavage process were chosen as to optimally fit the original “fast” and “slow” activation experiments. Simulations for the subthreshold ligand concentration show a very slow procaspase-8 cleavage that, however, resulted in a significant caspase-8 activity (Fig. 9 A). This is in clear contradiction to the experimental data (Fig. 4 O and Fig. 8). The complete scenario was next simulated under the assumption that c-FLIP is not sufficient to block the low number of DISC binding sites activated as a result of subthreshold ligand concentrations: even for such low ligand concentrations, there would be enough active caspase-8 to trigger the positive feedback loop, followed by cell death after a certain delay (Fig. 9 B). This is again in clear contradiction to our experiments, where apoptosis was never observed at subthreshold ligand concentrations even after a period of several days (Fig. 4, M and N and data not shown).
Figure 9.
Down-regulation of c-FLIP results in abolishing the threshold of CD95-induced apoptosis. (A) Virtual experiment for a ligand concentration of 1 ng under the assumption that c-FLIP is not blocking the DISCs in an early stage, resulting in a steady caspase-8 cleavage. The amplification loop is not considered for 1 ng to show the caspase-8 cleavage contribution of the DISCs only. For comparison, the active caspase-8 concentrations for 200 ng and 5 μg are given (corresponding to Fig. 4, A and D). Thus, even for the low ligand concentration of 1 ng, caspase-8 activity would reach a level in the same range as in case of high ligand concentrations (even though delayed). The relative units refer to the initial concentration of procaspase-8. (B) Complete scenario with amplification loop, simulated under the assumption that c-FLIP does not block the DISCs for 1 ng: the steady increase of active caspase-8 would trigger the complete death process. For comparison, the 200-ng scenario is plotted (corresponding to Fig. 4 D). Assuming that c-FLIP does not effectively block the DISCs for extremely low ligand concentrations, we expect a similar process as triggered by much higher ligand concentrations.
Biological relevance of mathematical modeling of CD95-induced apoptosis
The established loop between model and experiment was an essential component of this study. Outcomes of experiments performed for different scenarios and different molecules are used to verify, to refine, and to adapt the theoretical model, which in return was used for experimental planning. Notably, it would not have been possible to reveal the detailed mechanism for a threshold behavior of CD95-induced apoptosis with either the mathematical or experimental part missing. In this sense, mathematical modeling in the context of programmed cell death has already proven to be an indispensable part of biological knowledge discovery.
The developed mathematical framework now enables us to simulate the mechanism of CD95-induced apoptosis under different conditions (e.g., for different expressions of c-FLIPL, c-FLIPS, or FADD), thereby predicting a higher or lower resistance to apoptosis. Abnormal c-FLIP expression has been identified in various diseases connected with dysregulation in CD95 signaling such as multiple sclerosis, Alzheimer's disease, diabetes mellitus, rheumatoid arthritis, Hodgkin's disease, and different cancers (French and Tschopp, 1997; Micheau, 2003). It was shown that c-FLIPS has a short half-life and c-FLIPS might be down-regulated by inhibitors of protein synthesis resulting in sensitization of tumors to apoptosis. Our modeling framework is a powerful tool for predicting potential interaction partners of chemotherapeutics in the apoptotic pathway and for studying the mechanism behind the regulation of apoptosis by drugs in treatment of cancer and other diseases. This is of utmost biomedical relevance as there is strong evidence showing a highly complex and dynamic pattern of multiple resistance mechanisms in particular after challenging tumor cells by chemotherapeutic drugs. The challenge will be even more increasing, once the in vivo situation of resistance mechanisms is attempted to be functionally understood (Trauzold et al., 2003).
Impact of mathematical modeling for deciphering regulatory mechanisms of signal transduction networks
One of the most important roles of mathematical modeling in this study was related to experimental design and hypothesis generation. Our model predicted a delay of cell death with decreasing stimulation strength of CD95-induced apoptosis, which surprisingly resulted in a complete change of system behavior, i.e., the complete stop of the cell death program, at very low ligand concentrations. Although our model is not able to predict precisely at which concentration level this phase shift occurs for a single cell, the model defines an upper threshold (beyond which all cells dies) and a lower threshold (beyond which no cells die) for CD95-induced apoptosis. Between these two threshold values, the model becomes very instable likely reflecting the stochastic behavior of the death program in this critical activation range. The quantitative predictions by the model were used for designing experiments using ligand concentration for stimulation of apoptosis exactly in this predicted critical range.
One might argue that the hypothesis of a complete stop of apoptosis at low ligand concentration could have been formulated without the help of mathematical modeling. However, even after experimental observation of the threshold behavior its mechanistic explanation would have been subject to intuitive interpretations likely accompanied by many more experiments to further pinpoint potentially responsible regulatory mechanisms.
Evidently, mathematical modeling and numerical simulations are highly suited to probe different scenarios and hypotheses and to come up with detailed description and model-based proofs for novel regulatory mechanism. Notably, in contrast to intuitive interpretations that are usually subject of intense debate in the research community, predictions based on established mathematical model are unequivocal and reproducible. It can be well expected that through experimental design and model-based hypothesis checking mathematical modeling will play an instrumental role in future studies on complex signaling pathways by providing for a more efficient and more profound biomedical research.
The modular and hierarchical structure of our framework provides a high degree of flexibility for future model extensions in various ways, either by adding additional pathways and systems like proliferation or gene expression, or by adding more detailed biochemical mechanisms with more information becoming available. A further challenge will be to describe differences between type I/II cells and to understand different sensitivities to various drugs interacting with the apoptotic pathway. This work is presently underway in our laboratories.
Materials and methods
Structured information model
Mechanistic part.
For the mathematical description of the mechanistic part, interactions were modeled based on biochemical reaction equations. The state of a cell (or of a cell compartment) is described by the concentration of all relevant signal transduction molecules (c1, c2,…, cm). The reaction rates are dependent on these concentrations and on biochemical parameters (k1, k2,…, kn) like binding constants. To describe the temporal behavior, a system of ordinary differential equations is automatically generated as linear combinations of these rates:
 |
(1) |
where dci/dt represents the concentration change of molecule i, vj the rate of reaction j, and νij the stoichiometric matrix linking the reaction rates with the affected molecules (see equation below). The complete list of all reactions and parameters is given in Table SI.
 |
(2) |
Starting with a set of initial concentrations, the ordinary differential equations system was numerically integrated using an adaptive 4th-order Runge-Kutta (Gear, 1971) solver. Most of the parameters k and initial concentrations ci (t = 0) are unknown and subject to parameter estimation.
Black boxes.
All interactions with unknown exact biochemical or biophysical mechanism were modeled in functional subunits defined by their experimentally observed input–output behavior. In contrast to a reaction-based equation system, functions are introduced that describe the change of all molecule concentrations (and other values of interest) influenced by such a subsystem in dependence of all molecules and parameters influencing the subsystem:
 |
(3) |
 : indices of all molecules influenced by the functional subunit
 : indices of all molecules influencing the functional subunit
Boundary conditions (e.g., conservation laws) were taken into account. For concentration changes of molecules influenced by both the black boxes and the mechanistic part both effects are added.
To mathematically reproduce the behavior of these subunits, simplified processes were introduced: the degradation is modeled as an exponential decay function dependent on the executioner caspase activity, a similar dependency is assumed for PARP cleavage (for details see Table SI). For cytochrome C release of mitochondria, B-Splines based on experimental observations (Goldstein et al., 2000) were introduced. They describe a complete release within 5 min as soon as Bid reaches a certain level in comparison to Bcl-2/Bcl-XL.
Sensitivity analysis
Sensitivity analysis was applied to analyze the relative changes of concentrations ci within the relevant timeframe as a result of relative changes of the parameters pj:
 |
(4) |
In our study, we determined the integral of absolute sensitivities  from the beginning of activation to the time point of complete degradation instead of choosing distinct time points for which the sensitivities are determined. The parameters of our system are biochemical parameters like binding constants and the unknown initial molecule concentrations.
In complex systems, sensitivities can mostly be determined for distinct points in parameter space only (local sensitivity analysis). A global sensitivity analysis is usually impaired by the high dimensionality of the parameter space. Here, we apply sensitivity analysis to identify important system parameters and the intrinsic system behavior, as well as to detect “independent” clusters for a more efficient parameter estimation (see Online supplemental material). These clusters have to be identified before parameter estimation.
Therefore, we defined parameter ranges covering more than three orders of magnitude based on typical values taken from literature for each respective parameter type (Michaelis-Menten constants, bimolecular reaction rates, initial concentrations, etc.). We next randomly walked through the parameter space within these ranges, performing a sensitivity analysis at each randomly chosen point. This approach is based on the assumption that biological systems keep their system properties constant although they are subject to high parameter fluctuations. This expectation was met to a great extent. The distribution of sensitivities sij for different locations in the parameter space was plotted as histograms for each sensitivity (Fig. 2 B). The occurrences were weighted to account for the objective function E representing the difference between the experimental data and the simulation result for the respective parameter sets. The weighting factor is based on the Boltzmann-Distribution exp(−E/kbT), amplifying the statistical impact of sensitivities for those parameter sets that are more consistent with the experimental observations and therefore more probable.
Online supplemental material
The online supplemental material contains full information on cell culture and reagents (section 5) as well as a full description of antibodies and recombinant proteins (section 6) used in this study. Details on model definition include a description of the reaction system and the definition of black boxes (section 1). Section 2 explains our approach to cluster-based and sensitivity-controlled parameter estimation. The method for stochastic simulation is sketched in section 3. Finally, section 4 contains information on the implementation of the entire modeling and simulation framework. Online supplemental materials are available at http://www.jcb.org/cgi/content/full/jcb.200404158/DC1.
Acknowledgments
We appreciate helpful discussions with Sabine Westphal, Matthias Kühl, Christian Röder, and Ania Trauzold on the corresponding experimental analyses of type II cells. We thank Johannes Schlöder for discussions on the parameter estimation methods, and Henning Walczak and Marcus Peter for earlier discussions on this project. Marco Weismüller and Andreas Krueger were very helpful in setting up the network topology of apoptosis. We acknowledge helpful support by the Biobase team by adding information on apoptosis into the Transpath database. We thank Sven Baumann for advice on the experiments. R. Eils and M. Bentele thank Willi Jäger for his continuous support of this research.
The present work was supported by the BioFuture grant by Bundesministerium für Bildung und Forschung (11880A) to R. Eils and the Sonderforschungsbereich 415/Project A3 (H. Kalthoff).
M. Bentele and I. Lavrik contributed equally to this work.
Abbreviations used in this paper: CHX, cyclohexamide; DD, death domain; DISC, death-inducing signaling complex.
References
- Alon, U., M.G. Surette, N. Barkai, and S. Leibler. 1999. Robustness in bacterial chemotaxis. Nature. 397:168–171. [DOI] [PubMed] [Google Scholar]
- Ashkenazi, A., and V. Dixit. 1999. Apoptosis control by death and decoy receptors. Curr. Opin. Cell Biol. 11:255–260. [DOI] [PubMed] [Google Scholar]
- Bentele, M., and R. Eils. 2004. General stochastic hybrid method for the simulation of chemical reaction processes in cells. In CMSB ‘04. Lecture Notes in Computer Science. Springer, Heidelberg. In press.
- Bhalla, U.S., and R. Iyengar. 1999. Emergent properties of networks of biological signaling pathways. Science. 283:381–387. [DOI] [PubMed] [Google Scholar]
- Carlson, J.M., and J.C. Doyle. 2002. Complexity and robustness. Proc. Natl. Acad. Sci. USA. 99:2538–2545. [DOI] [PMC free article] [PubMed] [Google Scholar]
- Csete, M.E., and J.C. Doyle. 2002. Reverse engineering of biological complexity. Science. 295:1664–1669. [DOI] [PubMed] [Google Scholar]
- Deuflhard, P. 1983. Numerical Treatment of Inverse Problems in Differential and Integral Equations. Birkhäuser, Boston. 354 pp.
- French, L.E., and J. Tschopp. 1997. Thyroiditis and hepatitis: Fas on the road to disease. Nat. Med. 3:385–388. [DOI] [PubMed] [Google Scholar]
- Fussenegger, M., J. Bailey, and J. Varner. 2000. A mathematical model of caspase function in apoptosis. Nat. Biotechnol. 18:768–774. [DOI] [PubMed] [Google Scholar]
- Gear, C.W. 1971. Numerical Initial Value Problems in Ordinary Differential Equations. Englewood Cliffs, NJ. 253 pp.
- Gilman, A.G., M.I. Simon, H.R. Bourne, B.A. Harris, R. Long, E.M. Ross, J.T. Stull, and R. Taussig. 2002. Overview of the alliance for cellular signaling. Nature. 420:703–706. [DOI] [PubMed] [Google Scholar]
- Goldstein, J.C., N. Waterhouse, P. Juin, G. Evan, and D. Green. 2000. The coordinate release of cytochrome c during apoptosis is rapid, complete and kinetically invariant. Nat. Cell Biol. 2:156–162. [DOI] [PubMed] [Google Scholar]
- Heinrich, R., and S. Schuster. 1996. The Regulation of Cellular Systems. Chapman & Hall, New York. 372 pp.
- Kell, D.B., and H.V. Westerhoff. 1986. Metabolic control theory: its role in microbiology and biotechnology. FEMS Microbiol. Rev. 39:305–320. [Google Scholar]
- Kholodenko, B.N., O.V. Demin, G. Moehren, and J.B. Hoek. 1999. Quantification of short term signaling by the epidermal growth factor receptor. J. Biol. Chem. 274:30169–30181. [DOI] [PubMed] [Google Scholar]
- Kitano, H. 2002. Systems biology: a brief overview. Science. 295:1662–1664. [DOI] [PubMed] [Google Scholar]
- Krammer, P. 2000. CD95's deadly mission in the immune system. Nature. 407:789–795. [DOI] [PubMed] [Google Scholar]
- Krueger, A., I. Schmitz, S. Baumann, P.H. Krammer, and S. Kirchhoff. 2001. Cellular FLICE-inhibitory protein splice variants inhibit different steps of caspase-8 activation at the CD95 death-inducing signaling complex. J. Biol. Chem. 276:20633–20640. [DOI] [PubMed] [Google Scholar]
- Lauffenburger, D.A. 2000. Cell signaling pathways as control modules: complexity for simplicity? Proc. Natl. Acad. Sci. USA. 97:5031–5033. [DOI] [PMC free article] [PubMed] [Google Scholar]
- Lavrik, I., A. Krueger, I. Schmitz, S. Baumann, H. Weyd, P. Krammer, and S. Kirchhoff. 2003. The active caspase-8 heterotetramer is formed at the CD95 DISC. Cell Death Differ. 10:144–145. [DOI] [PubMed] [Google Scholar]
- Mendes, P. 1997. Biochemistry by numbers: simulation of biochemical pathways with Gepasi 3. Trends Biochem. Sci. 22:361–363. [DOI] [PubMed] [Google Scholar]
- Mendes, P., and D. Kell. 1998. Non-linear optimization of biochemical pathways: applications to metabolic engineering and parameter estimation. Bioinformatics. 14:869–883. [DOI] [PubMed] [Google Scholar]
- Micheau, O. 2003. Cellular FLICE-inhibitory protein: an attractive therapeutic target? Expert Opin. Ther. Targets. 7:559–573. [DOI] [PMC free article] [PubMed] [Google Scholar]
- Nagata, S. 1999. Fas ligand-induced apoptosis. Annu. Rev. Genet. 33:29–55. [DOI] [PubMed] [Google Scholar]
- Peter, M., and P. Krammer. 2003. The CD95(APO-1/Fas) DISC and beyond. Cell Death Differ. 10:26–35. [DOI] [PubMed] [Google Scholar]
- Regev, A., W. Silverman, and E.Y. Shapiro. 2001. Representation and simulation of biochemical processes using the pi-calculus process algebra. In Pacific Symposium on Biocomputing, vol. 6. World Scientific Publishers, Singapore. 459–470. [DOI] [PubMed]
- Salvesen, G.S. 2002. Caspases: opening the boxes and interpreting the arrows. Cell Death Differ. 9:3–5. [DOI] [PubMed] [Google Scholar]
- Salvesen, G.S., and C.S. Duckett. 2002. IAP Proteins: blocking the road to death's door. Nature Rev. Mol. Cell Biol. 3:401–410. [DOI] [PubMed] [Google Scholar]
- Sauro, H.M., and D.A. Fell. 1991. SCAMP: A metabolic simulator and control analysis program. Math. Comput. Model. 15:15–28. [Google Scholar]
- Schacherer, F., C. Choi, U. Götze, M. Krull, S. Pistor, and E. Wingender. 2001. The TRANSPATH signal transduction database: a knowledge base on signal transduction networks. Bioinformatics. 17:1053–1057. [DOI] [PubMed] [Google Scholar]
- Schilling, C.H., S. Schuster, B.O. Palsson, and R. Heinrich. 1999. Metabolic pathway analysis: basic concepts and scientific applications in the post-genomic era. Biotechnol. Prog. 15:296–303. [DOI] [PubMed] [Google Scholar]
- Schoeberl, B., C. Eichler-Jonsson, E.D. Gilles, and G. Müller. 2002. Computational modeling of the dynamics of the MAP kinase cascade activated by surface and internalized EGF receptors. Nat. Biotechnol. 20:370–375. [DOI] [PubMed] [Google Scholar]
- Silke, J., P. Ekert, C. Day, C. Hawkins, M. Baka, and J. Chew. 2001. Direct inhibition of caspase 3 is dispensable for the anti-apoptotoc activity of XIAP. EMBO J. 20:3114–3123. [DOI] [PMC free article] [PubMed] [Google Scholar]
- Swameye, I., T.G. Müller, J. Timmer, O. Sandra, and U. Klingmüller. 2003. Identification of nucleocytoplasmic cycling as a remote sensor in cellular signaling by databased modeling. Proc. Natl. Acad. Sci. USA. 100:1028–1033. [DOI] [PMC free article] [PubMed] [Google Scholar]
- Thornberry, N., and Y. Lazebnik. 1998. Caspases: enemies within. Science. 281:1312–1316. [DOI] [PubMed] [Google Scholar]
- Trauzold, A., S. Schmiedel, C. Röder, C. Tams, M. Christgen, S. Oestern, A. Arlt, S. Westphal, M. Kapischke, H. Ungefroren, and H. Kalthoff. 2003. Multiple and synergistic deregulations of apoptosis-controlling genes in pancreatic carcinoma cells. Br. J. Cancer. 89:1714–1721. [DOI] [PMC free article] [PubMed] [Google Scholar]


