Abstract
Inositol 1,4,5-trisphosphate (InsP3) receptors (InsP3Rs) are channels responsible for calcium release from the endoplasmic reticulum (ER). We show that the anti-apoptotic protein Bcl-2 (either wild type or selectively localized to the ER) significantly inhibited InsP3-mediated calcium release and elevation of cytosolic calcium in WEHI7.2 T cells. This inhibition was due to an effect of Bcl-2 at the level of InsP3Rs because responses to both anti-CD3 antibody and a cell-permeant InsP3 ester were decreased. Bcl-2 inhibited the extent of calcium release from the ER of permeabilized WEHI7.2 cells, even at saturating concentrations of InsP3, without decreasing luminal calcium concentration. Furthermore, Bcl-2 reduced the open probability of purified InsP3Rs reconstituted into lipid bilayers. Bcl-2 and InsP3Rs were detected together in macromolecular complexes by coimmunoprecipitation and blue native gel electrophoresis. We suggest that this functional interaction of Bcl-2 with InsP3Rs inhibits InsP3R activation and thereby regulates InsP3-induced calcium release from the ER.
Keywords: InsP3 receptor; calcium signaling; apoptosis; calcium channel; T cell receptor
Introduction
Inositol 1,4,5-trisphosphate (InsP3) receptors (InsP3Rs) are ligand-gated calcium channels located on the ER (Patel et al., 1999; Taylor et al., 1999). These receptors are widespread in distribution and constitute a family of calcium channels with three main subtypes sharing similar but not identical functional properties. InsP3-induced channel opening releases calcium from the ER lumen into the cytosol, generating calcium signals that regulate a wide range of cellular processes, including cell proliferation and apoptosis (Berridge et al., 2003). For example, in T cells, InsP3-induced calcium elevation activates calcineurin-mediated signaling pathways leading to both cell proliferation and apoptosis (Crabtree, 1999). InsP3Rs are necessary for apoptosis induction by glucocorticosteroids and ionizing radiation in T cells (Khan et al., 1996; Jayaraman and Marks, 1997) and by surface IgM ligation in B cells (Sugawara et al., 1997). Calcium activates a variety of apoptosis effectors, including calcineurin, endonucleases, phospholipases, and proteases (for review see Hajnoczky et al., 2003; Orrenius et al., 2003). Also, InsP3-linked calcium signals may trigger apoptosis by disturbing mitochondrial function (Szalai et al., 1999; Pinton et al., 2001; Pacher and Hajnoczky, 2001). Recently, it has been reported that cytochrome c, released from mitochondria, binds to InsP3Rs, inducing calcium release from the ER and amplifying calcium-dependent apoptosis (Boehning et al., 2003).
Bcl-2 is the founding member of a large family of proteins that regulate apoptosis from critical control points on both mitochondria and the ER (Cory and Adams, 2002; Danial and Korsmeyer, 2004). Bcl-2 is an integral membrane protein that localizes to both the ER and mitochondria (Kaufmann et al., 2003). Although a significant proportion of Bcl-2 is on the ER (Kaufmann et al., 2003), its role in inhibiting cytochrome c release from mitochondria has been emphasized (Green and Reed, 1998; Gross et al., 1999). Recent findings indicate that Bcl-2 localized specifically on the ER also inhibits cytochrome c release and apoptosis in response to a variety of signals (Zhu et al., 1996; Hacki et al., 2000; Wang et al., 2001; Thomenius et al., 2003).
Previous studies have shown that changes in cellular calcium signaling can dramatically modulate the induction of apoptosis (for review see Hajnoczky et al., 2003; Orrenius et al., 2003). It has been proposed that the action of Bcl-2 is mediated in part due to its ability to regulate cytosolic and mitochondrial calcium changes. For example, it was demonstrated a decade ago that Bcl-2 dampens calcium oscillations and prevents redistribution of calcium from ER to mitochondria after growth factor withdrawal (Baffy et al., 1993; Magnelli et al., 1994). However, the absolute effect of Bcl-2 is unclear, with changes in cytosolic, ER, and mitochondrial calcium signaling being reported in different studies (Lam et al., 1994; Zornig et al., 1995; Marin et al., 1996; Ichimiya et al., 1998; Zhu et al., 1999; Williams et al., 2000; Pinton et al., 2001). Furthermore, the mechanism by which Bcl-2 interacts with calcium signaling systems is controversial. This is exemplified by the conflicting reports about Bcl-2's effect on ER luminal calcium. We, and others, have provided evidence that Bcl-2 preserves luminal calcium, whereas several recent papers suggest that Bcl-2 increases leakage of calcium from the ER and decreases luminal calcium (for review see Distelhorst and Shore, 2004).
The present study was undertaken to test the hypothesis that Bcl-2 on the ER regulates InsP3-linked calcium signals that mediate cell cycle entry and apoptosis. We report that Bcl-2 inhibits InsP3-induced calcium release from the ER by impeding calcium release through InsP3Rs. This action of Bcl-2 was not due to an alteration in InsP3R expression or luminal calcium concentration, but was mediated through a functional interaction of Bcl-2 with InsP3Rs that inhibited their channel opening in response to InsP3.
Results
Bcl-2 inhibits anti-CD3–induced calcium elevation
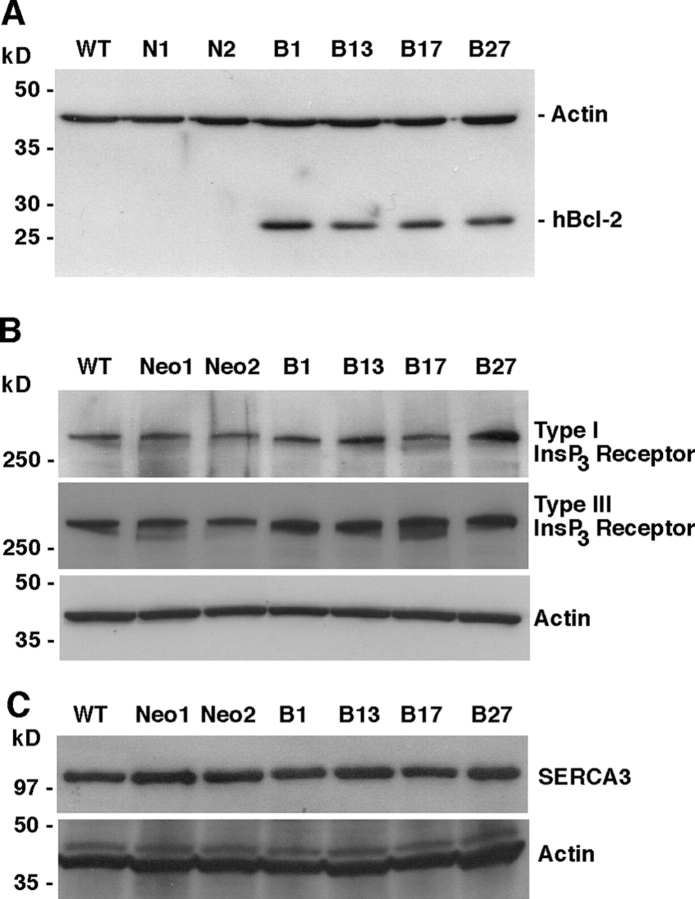
To investigate the effect of Bcl-2 on calcium homeostasis, the T cell receptor (TCR)–positive WEHI7.2 line was stably transfected with an expression vector encoding human Bcl-2 or empty control vector. Bcl-2 was not detected in nontransfected cells or in empty vector transfected control clones (Fig. 1 A; N1 and N2), but was readily detectable in Bcl-2–positive clones (Fig. 1 A; B1, B13, B17, and B27). Bcl-2 expression was monitored frequently by flow cytometry and only cultures with more than 85% of Bcl-2–positive cells were used in experiments. Bcl-2 expression conferred resistance to apoptosis induction by dexamethasone, staurosporine, and thapsigargin (TG; unpublished data). Substantial differences were not detected in the expression levels of InsP3Rs (Fig. 1 B), SERCA pumps (Fig. 1 C), or luminal calcium binding proteins (not depicted).
Figure 1.
Characterization of Bcl-2–positive and –negative clones. Western blot of cell lysates from nontransfected (wild type, WT) WEHI7.2 cells, control clones transfected with empty vector (N1 and N2), and clones stably expressing full-length Bcl-2 (B1, B13, B17, and B27). (A) The blot was probed with anti–hBcl-2 (human Bcl-2) antibody, then reprobed with anti-actin antibody to control for loading. (B) Blots were probed with antibodies to InsP3Rs I and III. (C) Blots were probed with antibodies to SERCA3, then reprobed with anti-actin antibody to control for loading.
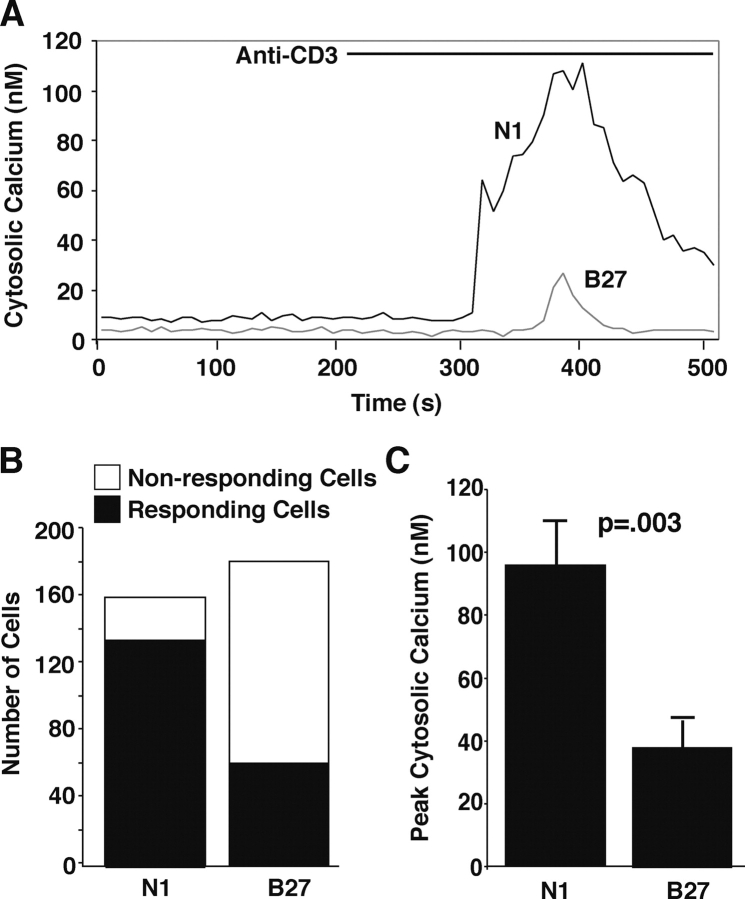
Antibody to the CD3 component of the TCR induced a calcium elevation in control WEHI7.2 cells that was inhibited in Bcl-2–transfected cells (Fig. 2 A). Bcl-2 expression also reduced both the number of cells responding to anti-CD3 antibody (Fig. 2 B) and the amplitude of calcium elevation in responding cells (Fig. 2 C). In addition, Bcl-2 expression appeared to increase the latency up to 2 min between the time when anti-CD3 antibody was added and when the elevation of cytosolic calcium was first detected. The inhibitory effect of Bcl-2 on anti-CD3–induced calcium elevation was confirmed by directly comparing multiple Bcl-2–negative and –positive clones (Fig. 3, A and C). Also, Bcl-2 selectively targeted for expression on the ER inhibited anti-CD3–induced calcium elevation (Fig. 3 E).
Figure 2.
Inhibition of CD3/TCR-mediated calcium elevation by Bcl-2. Cytosolic calcium concentration was measured by single cell calcium imaging using the calcium indicator Fura-2 AM in the presence of 1.3 mM extracellular calcium. (A) Representative calcium traces comparing Bcl-2–negative (N1) and –positive (B27) clones. (B) The number of cells responding or failing to respond with a significant increase in cytoplasmic calcium concentration twofold above baseline after exposure to anti-CD3 antibody. (C) Peak calcium elevation induced by anti-CD3. Only cells responding to anti-CD3 antibody are included in the analysis. Symbols represent mean ± SEM and summarize data from a total of 161 N1 cells (five separate experiments) and 181 B27 cells (six separate experiments). Statistical analysis was performed with the Mann-Whitney U Test and confirmed with the Wilcoxon Rank Sum Test.
Figure 3.
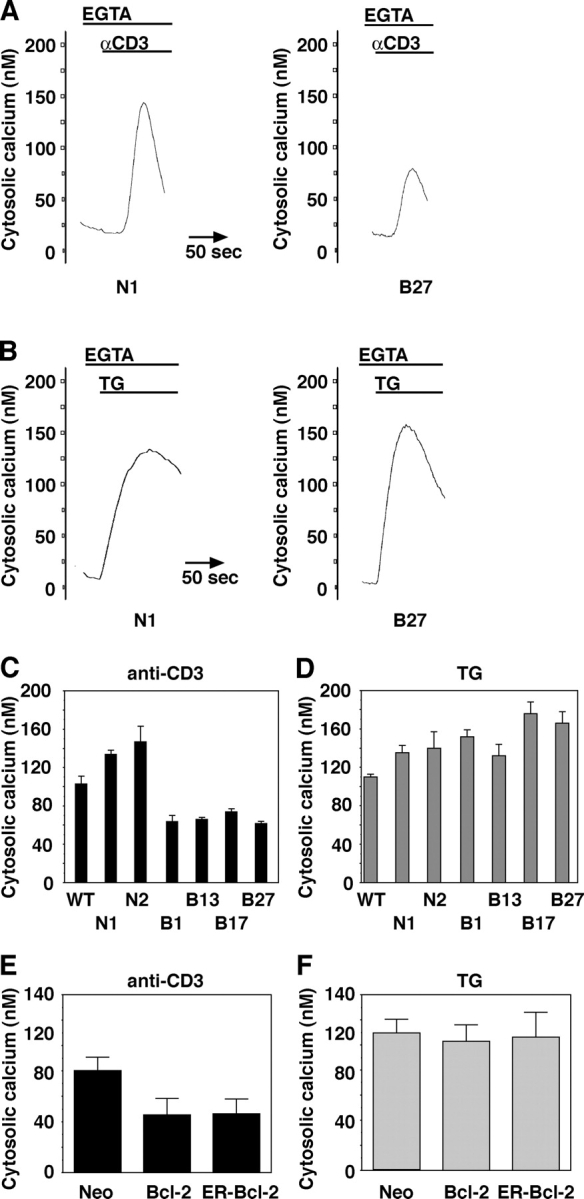
Bcl-2 inhibits anti-CD3–induced calcium elevation, but not TG-induced calcium elevation. Cytoplasmic calcium elevation induced by anti-CD3 antibody and by TG was measured in parallel in multiple Bcl-2–positive and –negative clones described in Fig. 1. Cells were incubated in ECB containing 1.3 mM calcium until the beginning of recordings when EGTA was added to chelate extracellular calcium. Fluorometry tracings show the transient elevation of cytoplasmic calcium induced by anti-CD3 antibody (A) or by 100 nM TG (B). Histograms summarize the peak cytosolic calcium elevation induced by anti-CD3 antibody (C) or 100 nM TG (D) in multiple experiments (mean ± SEM). F and G summarize multiple experiments (mean ± SEM) in which peak calcium elevation induced by anti-CD3 (E) and by 100 nM TG (F) was measured in WEHI7.2 cells stably expressing Flag-tagged wild-type Bcl-2 and Flag-tagged ER-targeted Bcl-2 or control expression vector (Neo).
ER calcium levels are not affected by Bcl-2 expression
We investigated several possible mechanisms by which Bcl-2 expression could decrease agonist-induced calcium signals. First, we tested whether or not Bcl-2 expression affected ER calcium levels. This test was performed by two complementary approaches: (1) quantitation of the TG releasable calcium pool and (2) direct measurement of free luminal calcium concentration. TG inhibits SERCA pumps and causes a passive leak of calcium from ER lumen into cytoplasm. TG-induced calcium elevation is an indirect measure of ER calcium content. We found no difference in the magnitude of the TG releasable calcium pool (Fig. 3, B, D, and F). Therefore, absence of an effect of Bcl-2 on TG-induced calcium elevation suggests that the inhibitory effect of Bcl-2 on anti-CD3–induced calcium elevation is not secondary to a Bcl-2–imposed decrease in ER luminal calcium concentration.
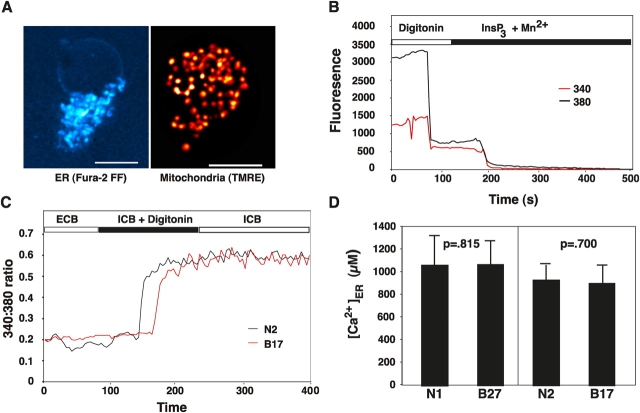
Luminal calcium concentration was measured directly using the low affinity calcium-sensitive dye Fura-2FF AM. Optimal conditions for loading Fura-2FF AM into the ER were determined in preliminary experiments. The organelle distribution of Fura-2FF fluorescence was in a reticular pattern distinct from the punctate mitochondrial pattern detected with the potentiometric dye tetramethylrhodamine ethyl ester (TMRE; Fig. 4 A). To quantify the relative amount of Fura-2FF localized to the ER lumen, the plasma membrane was permeabilized with digitonin and cells were perfused with intracellular buffer (ICB) supplemented with an ATP-regenerating system, 10 μM InsP3, and 100 μM MnCl2 (Fig. 4 B). The initial decrease in the emission intensity at both 340 and 380 nm excitation (at ∼80 s) signifies the point at which the plasma membrane is permeabilized. The subsequent decrease in 340 and 380 nm emission (at ∼190 s) is due to InsP3-induced opening of InsP3Rs on the ER, allowing MnCl2 to enter the ER lumen. Fura-2FF has high affinity for MnCl2, which in turn quenches the dye. In multiple experiments, more than 90% of the fluorescence remaining after digitonin permeabilization was quenched by perfusing cells with 10 μM InsP3 and 100 μM MnCl2. Using this assay system, ER luminal calcium concentration was compared in Bcl-2–negative and –positive clones. A typical continuous single cell tracing is shown in Fig. 4 C. Cells were initially perfused with extracellular buffer (ECB) and then with ICB supplemented with an ATP regenerating system and digitonin. The 340:380 fluorescence emission ratio increased dramatically when cells were permeabilized, reflecting a typically high ER luminal calcium concentration. The calcium concentration was calculated from the steady-state ratio in numerous experiments (Fig. 4 D). Two sets of experiments were performed. The first consisted of a direct comparison of N1 versus B27 cells, and the second set consisted of a direct comparison of N2 versus B17 cells. Based on these findings, there was no detectable difference between Bcl-2–positive and –negative cells in terms of free calcium concentration within the ER lumen. In these experiments, luminal calcium was allowed to come to steady-state, provided with ATP by an ATP-regenerating system. In a different experimental approach, cells were perfused with 10 μg/ml digitonin in ECB and luminal calcium concentration was based on the 340:380 ratio at the time point where cells were initially permeabilized. This alternative experimental approach confirmed no difference in ER luminal calcium concentration between Bcl-2–positive and –negative clones (unpublished data). These findings indicate that the inhibitory effect of Bcl-2 on anti-CD3–induced calcium elevation was not due to a Bcl-2–imposed decrease in the mobilizable ER calcium pool.
Figure 4.
Bcl-2 does not decrease luminal free calcium concentration. Free luminal ER calcium concentration was measured using the low affinity calcium sensitive dye Fura-2FF AM. (A) Intracellular localization of Fura-2FF fluorescence (left) and fluorescence from the mitochondrial dye TMRE (right) was detected as nonconfocal Z-series stacks followed by deconvolution. Bars, 5 μm. (B) Typical single cell traces showing fluorescence emission at 340 and 380 nm excitation. Cells were loaded with Fura-2FF AM while suspended in ECB. Cells were then perfused with ICB supplemented with an ATP generating system and 10 μg/ml digitonin. Fluorescence at both 340 and 380 nm decreased dramatically when cells were permeabilized by digitonin. Cells were then perfused with ICB containing 10 μM InsP3 and 100 μM MnCl2. Mn2+ enters the ER and quenches luminal Fura-2FF after opening of InsP3Rs by InsP3. (C) Typical single cell traces monitoring the ratio of fluorescence at 340 and 380 nm excitation. The 340:380 ratio increases rapidly when cells are permeabilized with digitonin. The 340:380 ratio gradually reaches steady-state levels. (D) Summary of luminal ER calcium concentration based on steady-state 340:380 ratios after cell permeabilization with digitonin. Measurements were performed in six experiments constituting parallel comparisons of 59 Neo1 control cells versus 50 B27 cells, and in 13 experiments constituting parallel comparisons of 180 Neo2 control cells versus 85 B17 cells. Symbols represent mean ± SEM. Statistical analysis was performed with the Mann-Whitney U Test and confirmed with the Wilcoxon Rank Sum Test.
Thus, the inhibition of anti-CD3–induced calcium elevation by Bcl-2 is due either to Bcl-2–mediated interference with the signal transduction pathway that mediates this response or to a direct effect of Bcl-2 on InsP3R function.
Bcl-2 targets the InsP3R to inhibit calcium release
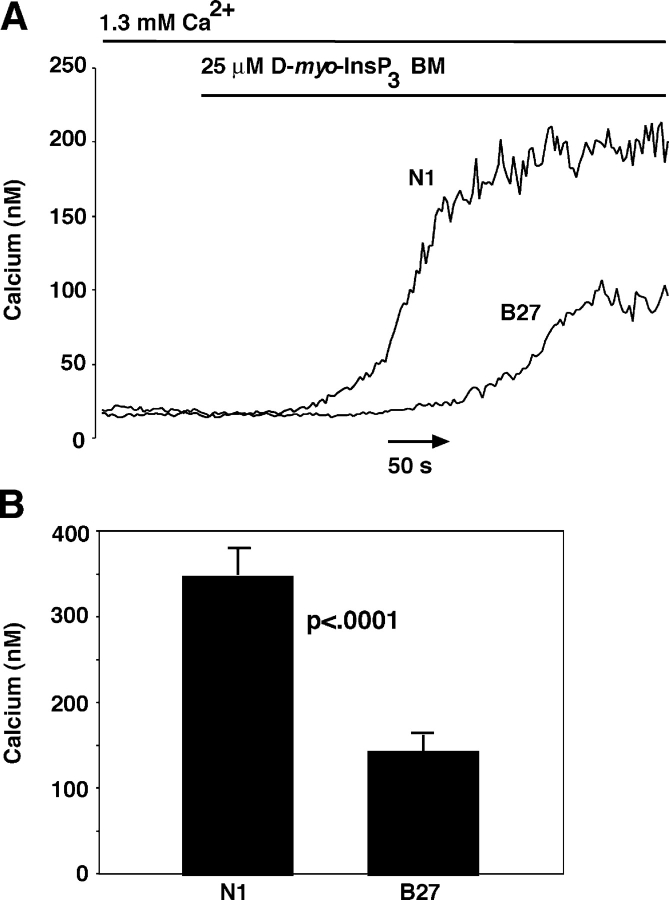
To exclude the first possibility, the signal transduction pathway mediating the response to anti-CD3 antibody was bypassed by measuring cytoplasmic calcium elevation after addition of a cell-permeant InsP3 ester, D-myo InsP3 hexakisbutyryloxymethyl ester (D-myo InsP3BM), to intact Bcl-2–positive and –negative cells. After a brief delay required for de-esterification, D-myo InsP3BM induced an elevation in cytosolic calcium that had a shorter latency period, a more rapid rate of increase, and a higher peak amplitude in Bcl-2–negative cells compared with Bcl-2–positive cells (Fig. 5). These findings indicated that Bcl-2 acts at the level of the ER to inhibit anti-CD3–induced calcium elevation, rather than interfering with upstream components of the signal transduction pathway initiated by TCR activation.
Figure 5.
Bcl-2 inhibits cytoplasmic calcium elevation induced by cell-permeant InsP3 ester. Cytosolic calcium concentration was measured by single cell calcium imaging using the calcium indicator Fura-2 AM in the presence of 1.3 mM extracellular calcium. (A) Representative calcium traces comparing Bcl-2–negative (N1) and –positive (B27) clones. (B) Summary of peak calcium concentration induced by 25 μM InsP3 ester in three separate experiments on a total of 42 N1 cells and 31 B27 cells. Symbols represent mean ± SEM and statistical analysis was performed with the Mann-Whitney U Test and confirmed with the Wilcoxon Rank Sum Test.
To examine further if Bcl-2 was acting at the level of InsP3Rs, the affinity of InsP3Rs for InsP3 was measured in microsomes isolated from Bcl-2–positive and –negative cells using a competitive binding assay. The K d for radiolabeled InsP3 binding was consistently higher in Bcl-2–positive microsomes than in Bcl-2–negative microsomes (7.0 ± 1.3 nM vs. 4.8 ± 1.1 nM; P < 0.001), indicating that Bcl-2 decreases InsP3R binding affinity. To determine if decreased InsP3 binding affinity fully explains the inhibitory effect of Bcl-2 on InsP3-induced calcium elevation, the relationship between InsP3 concentration and calcium release from the ER was investigated. For this purpose, ER luminal calcium was continuously monitored with the low affinity calcium indicator Fura-2FF, before and after adding InsP3 to cells in which the plasma membrane had been permeabilized by digitonin. In typical calcium tracings, increasing concentrations of InsP3 induced a stepwise decrease in Fura-2FF ratio, reflecting a stepwise decline in luminal calcium due to InsP3-induced release of calcium into the cytoplasm (Fig. 6 A). This finding was highly reproducible as shown in the InsP3 dose response analysis and indicates that Bcl-2 inhibits the extent of InsP3-induced calcium release from the ER even at saturating InsP3 concentrations (Fig. 6 B). In contrast, the extent of calcium release induced by TG was similar in Bcl-2–positive and –negative cells (Fig. 6 C). These findings indicate that Bcl-2 inhibits InsP3-induced calcium release, even at saturating InsP3 concentrations well above the K d for InsP3 binding. Thus, an alteration in InsP3 binding affinity does not fully explain the inhibition of InsP3-induced calcium release by Bcl-2. Nevertheless, these findings further suggest that Bcl-2 regulates cellular calcium signaling at the level of the InsP3Rs.
Figure 6.
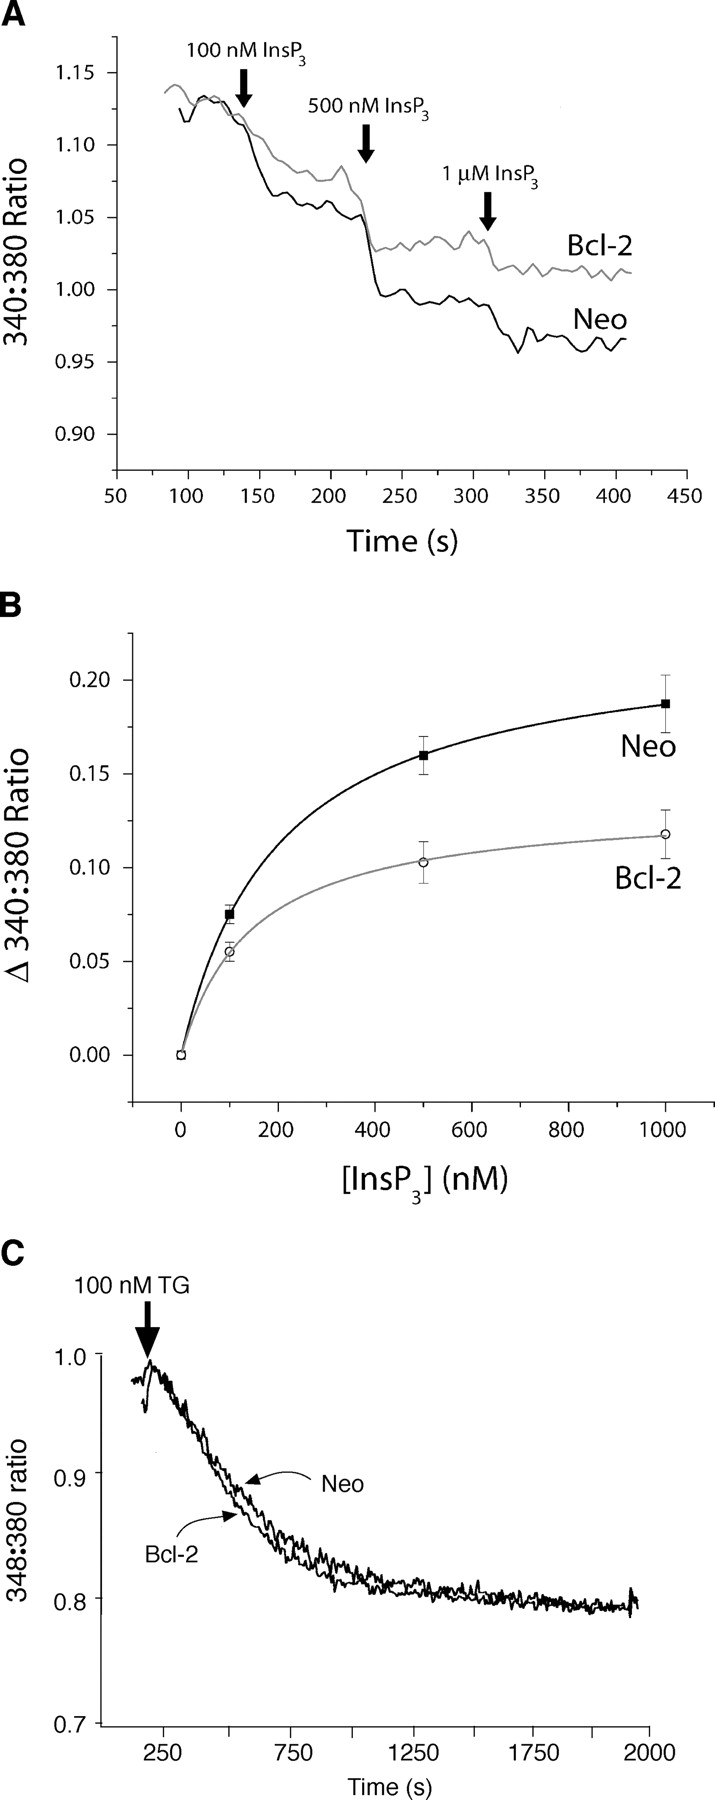
Bcl-2 inhibits the extent of calcium release even at saturating concentrations of InsP3. Cells were loaded with Fura-2FF AM to monitor ER luminal calcium as described in Fig. 4. After cell permeabilization with digitonin, increasing concentrations of InsP3 were added sequentially while continuously monitoring the Fura-2FF 340:380 ratio. (A) Continuous recording of Fura-2FF ratio in neo control and Bcl-2 overexpressing WEHI7.2 cells. The stepwise decrease in the 340:380 ratio corresponds to the decline in luminal calcium secondary to InsP3-induced release of calcium into the cytoplasm. (B) Linear least squares dose response analysis of multiple experiments like that shown in panel A (symbols represent mean ± SEM for nine separate experiments). (C) 1 μM TG was added to intact unpermeabilized Fura-2FF–loaded cells and the Fura-2FF 340:380 ratio was monitored continuously. The decrease in Fura-2FF ratio is due to a stepwise decline in luminal calcium induced by TG-mediated SERCA pump inhibition.
Bcl-2 inhibits InsP3R channel opening in vitro
To determine if Bcl-2 regulates InsP3R channel activity, the effect of purified full-length Bcl-2 protein on single type I InsP3R channels was measured under steady-state conditions. Single InsP3R channels were incorporated in planar lipid bilayers. InsP3R channel incorporation was visualized as a series of discrete positive (upward) current fluctuations in the presence of 2 μM InsP3 and 250 nM calcium in the cis compartment (cytoplasmic side of the channel) as shown in control traces in Fig. 7 A. A conductance of 300 pS and reversal potential of ∼23 mV was measured from the current–voltage relationship (unpublished data), corresponding to those values expected for an InsP3R channel under these experimental conditions (Ramos-Franco et al., 1998). A reduction in single channel activity was observed upon addition of ∼0.1 μM Bcl-2 in the compartment bathing the cytoplasmic side (cis compartment) of the InsP3R channel (Fig. 7 A). Conductance and reversal potential (unpublished data) were not changed by adding Bcl-2. Thus, Bcl-2 only reduces open probability without important changes in conduction or gating properties. To quantify the change in open probability of the InsP3R channel induced by Bcl-2, all-point histograms were constructed, permitting comparison of the relative areas for the control records and those obtained after the addition of Bcl-2 (Fig. 7 B). For clarity, only Gaussian distribution fits are shown. The total recording time considered in the analysis for each condition was 9 s. In the control situation (Fig. 7 B, dashed line), the closed state appears as an accumulation of points near 0 pA, whereas the open state is visualized as a peak at ∼8 pA. The probability in absence of added Bcl-2 was 0.27, calculated as the ratio between the area of the open state and the total area of the histogram. Addition of Bcl-2 reduced the probability by 4.5-fold to 0.058. This effect was seen as a reduction of the height of the peak at the open state (without change in the amplitude of the current) and a corresponding increase in the amount of points at the closed level (Fig. 7 B, solid line). Similar findings were obtained in experiments where the current carrier was potassium instead of cesium (cis/trans 250/50 mM KCl; unpublished data). In this case, the total recording time considered in the analysis was much longer (120 s) for each condition. Addition of ∼0.1 μM Bcl-2 to the cytoplasmic face of the InsP3R reduced the channel open probability by 2.92-fold. Potassium or cesium are commonly used instead of calcium because conductance of the channel for monovalent cations is much higher than that for divalent cations, improving the resolution (signal to noise ratio) of single channel currents without significantly changing gating properties. In summary, these results demonstrate an inhibitory interaction between Bcl-2 and InsP3Rs in vitro.
Figure 7.
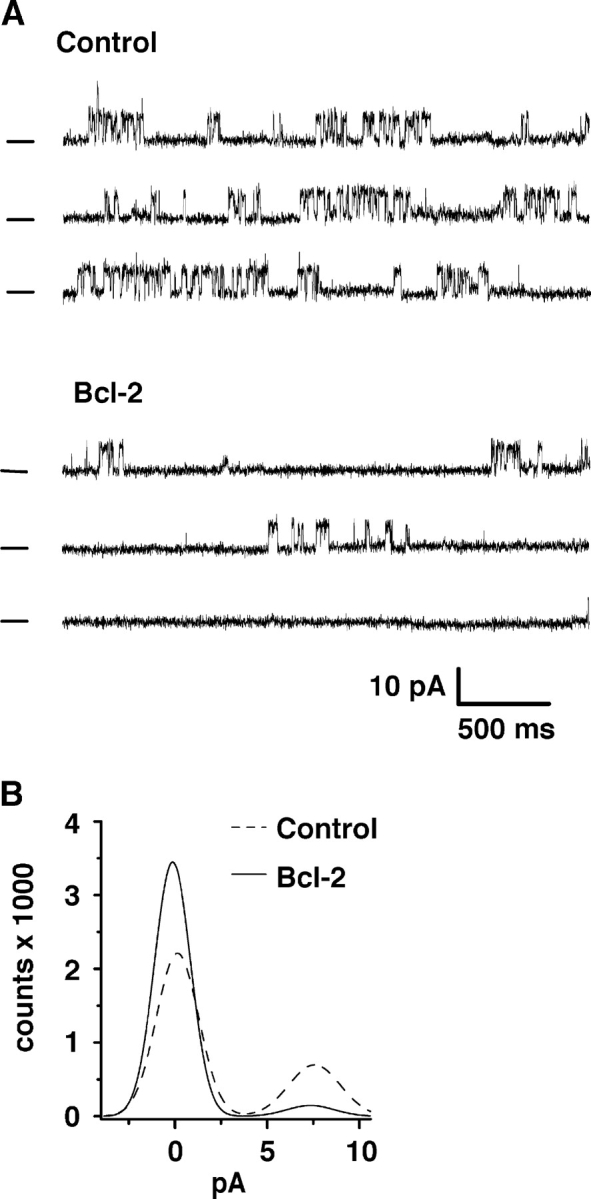
Bcl-2 reduces InsP3R channel open probability. Single InsP3Rs were incorporated into artificial planar lipid bilayers, and the effect of Bcl-2 on channel activity was studied after addition of ∼0.1 μM purified full-length Bcl-2 to the solution bathing the cytoplasmic face of the channel. (A) Representative single channel traces showing the level of activity of a channel under control conditions (top trace; cis/trans 220 mM CsCH3SO3/20 mM CsCH3SO3, pH 7.4) in the presence of 2 μM InsP3. The holding potential was 0 mV. Channel openings are seen as upward current deflections. The bottom trace shows the same InsP3R channel after addition of Bcl-2 to the cis compartment (cytoplasmic side of channel). Bcl-2 significantly reduces the open probability. The bar at the left indicates the zero current level (closed state). (B) All-points amplitude histogram of the experiment shown in A. The effect on open probability is demonstrated by a reduction of the peak representing the open level.
Bcl-2 and InsP3Rs form a macromolecular complex in WEHI7.2 cells
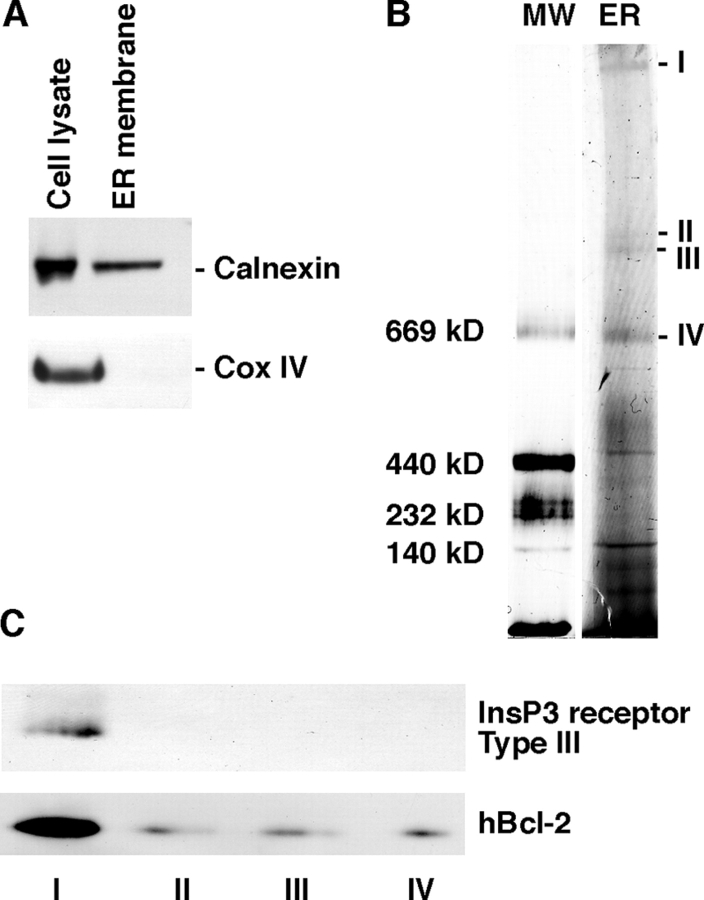
To determine if Bcl-2 associates with InsP3Rs in vivo, ER membranes were isolated from Bcl-2–expressing WEHI7.2 cells (clone 17) and subjected to blue native–PAGE (BN-PAGE), a technique in which protein complexes are separated in the first dimension on nondenaturing gels and protein complexes are then analyzed by SDS-PAGE/Western blotting in the second dimension (Schagger et al., 1994). Multiple high molecular mass complexes were resolved in first dimension gels (Fig. 8 B). The four largest complexes were cut from the gel and subjected to SDS-PAGE/Western blotting (Fig. 8 C). The findings indicate that at least a portion of Bcl-2 is located together with InsP3Rs in the largest complex. Bcl-2 was also detected in the smaller complexes analyzed, suggesting either that some of the Bcl-2 had dissociated from the InsP3R complexes during preparation or that not all of the Bcl-2 is associated with InsP3Rs.
Figure 8.
Bcl-2 is present in complexes with InsP3Rs. (A) Western blots showing levels of calnexin and cox IV in cell lysates and purified ER membrane from Bcl-2–expressing WEHI7.2 cells (clone 17). (B) Identification of protein complexes in purified ER membranes by BN-PAGE. MW, molecular size markers; ER, ER membrane. I–IV point to complexes that were cut from this gel and separated by SDS-PAGE. White line indicates that intervening lanes have been spliced out. (C) Complexes I–IV from B were resolved by SDS-PAGE and analyzed by Western blotting with antibody to Type III InsP3R (top) and antibody to human Bcl-2 (bottom).
The potential interaction of Bcl-2 and InsP3Rs was further analyzed by coimmunoprecipitation (Fig. 9). InsP3Rs were immunoprecipitated from Neo control cells (clone N1) and Bcl-2–expressing cells (clone B17), and immunoprecipitates were analyzed by Western blotting with an antibody specific for Bcl-2 (Fig. 9 A). The results indicate that Bcl-2 coimmunoprecipitates with InsP3Rs. Bcl-2 coimmunoprecipitation with InsP3Rs was detected using antibodies to each of the three InsP3R subtypes (Fig. 9 B). In the reciprocal experiment, Bcl-2 was immunoprecipitated and InsP3Rs were detected as coimmunoprecitating proteins by Western blotting, confirming the interaction between Bcl-2 and InsP3Rs (Fig. 9 C). To control for the specificity of interaction between Bcl-2 and InsP3Rs, immunoprecipitates were also analyzed by Western blotting using an antibody to SERCA3 (Fig. 9 D). This ER membrane protein did not coimmunoprecipitate with either Bcl-2 or InsP3Rs. Because the associations described in Fig. 9 (A–C) were shown in cells overexpressing Bcl-2, we next examined if similar interactions occurred in cells that endogenously expressed Bcl-2. For this purpose, we took advantage of another T cell line, S49.A2, which has been demonstrated to express Bcl-2 (Wang et al., 2003). Coimmunoprecipitation of endogenous Bcl-2 with InsP3Rs, using either anti–Bcl-2 or anti-InsP3R antibody, was detected in these cells (Fig. 9 E). SERCA3 did not coimmunoprecipitate with either endogenous Bcl-2 or InsP3Rs (Fig. 9 F). In summary, the findings of coimmunoprecipitation experiments suggest that Bcl-2 forms a complex with InsP3Rs.
Figure 9.
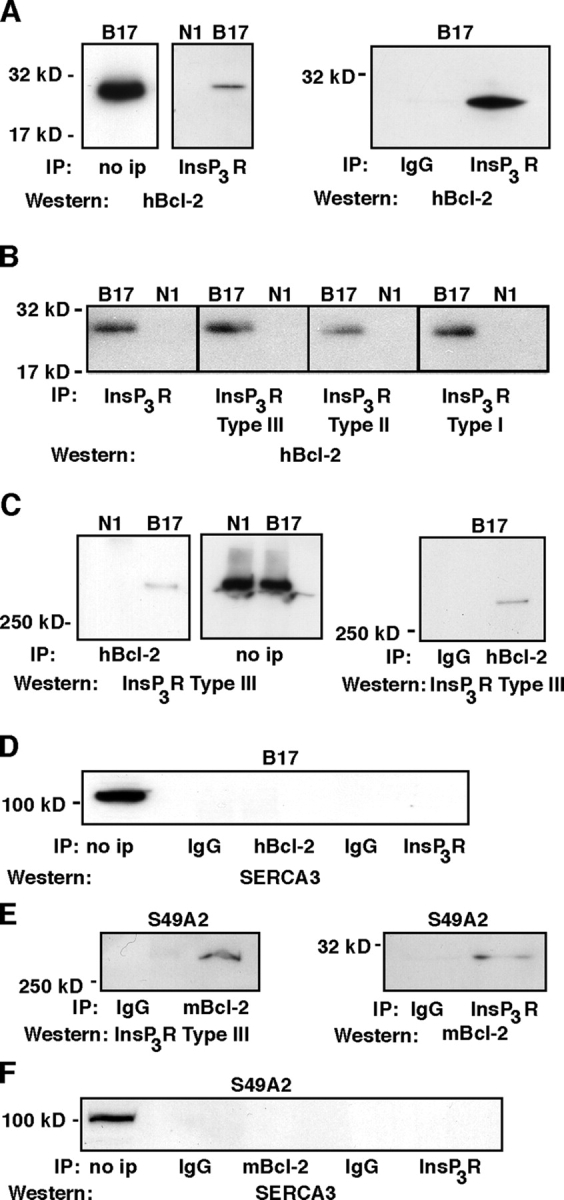
Coimmunoprecipitation of Bcl-2 with InsP3Rs. (A) InsP3Rs were immunoprecipitated from N1 and B17 clones using a subtype nonspecific antibody. Immunoprecipitates were analyzed by Western blotting using an antibody to hBcl-2. The level of overexpressed human Bcl-2 is shown by Western blotting in the “no ip” lane. (B) InsP3Rs were immunoprecipitated from N1 and B17 cells using antibodies that recognize either all three subtypes (left) or antibodies specific for each subtype (second through fourth panels). Immunoprecipitates were analyzed by Western blotting using anti–human Bcl-2 antibody. (C) Human Bcl-2 (i.e., overexpressed Bcl-2) was immunoprecipitated, and immunoprecipitates were analyzed by Western blotting using antibody specific for InsP3R subtype III. The levels of type III InsP3Rs are shown by Western blotting in the “no ip” lane. (D) Bcl-2 and InsP3Rs were immunoprecipitated from the B17 clone as described in preceding panels, and immunoprecipitates were analyzed by Western blotting using antibody to SERCA3. The level of SERCA3 in B17 cells is shown in the “no ip” lane. (E) Endogenous mouse Bcl-2 and InsP3Rs were immunoprecipitated from S49.A2 cells using an antibody specific for mouse Bcl-2 and an antibody that reacts with all three subtypes of InsP3Rs, respectively. In all panels, the lanes labeled “IgG” represent immunoprecipitations performed using nonspecific IgG control antibodies. InsP3Rs were detected in Bcl-2 immunoprecipitates using antibody to Type III InsP3Rs (left), while endogenous Bcl-2 was detected in InsP3R immunoprecipitates by probing Western blots with an antibody to murine Bcl-2 (right). (F) Bcl-2 and InsP3Rs were immunoprecipitated from S49A2 cells as described in preceding panels, and immunoprecipitates were analyzed by Western blotting using antibody to SERCA3. The level of SERCA3 in S49A2 cells is shown in the “no ip” lane.
Discussion
Here we report that Bcl-2 inhibits InsP3-induced calcium elevation in the WEHI7.2 T cell line. The focus has been on understanding the mechanism by which Bcl-2 inhibits anti-CD3–induced calcium elevation. The findings of a systematic series of experiments all point to a regulatory effect of Bcl-2 on InsP3R function. First, the observation that Bcl-2 inhibits anti-CD3–induced calcium elevation was confirmed in multiple Bcl-2–expressing clones of the WEHI7.2 line by both fluorometric and digital imaging methods of calcium measurement. Second, an inhibitory effect of Bcl-2 on ER calcium release was detected when the signal transduction pathway mediating anti-CD3–induced InsP3 synthesis was bypassed by adding a cell-permeant InsP3 ester to cells or by adding InsP3 to digitonin-permeabilized cells. Third, anti-CD3–induced calcium elevation was inhibited not only by wild-type Bcl-2, which localizes to both the ER and mitochondria, but also by Bcl-2 selectively targeted to the ER membrane. These findings indicate that the action of Bcl-2 resides at the level of the ER, rather than in the upstream signal transduction pathway that mediates InsP3 synthesis. Fourth, a series of control experiments indicated that inhibition of InsP3-induced calcium release by Bcl-2 was not due to decreased luminal calcium concentration, decreased InsP3R levels, or altered expression of luminal calcium binding proteins. Fifth, Bcl-2 inhibited the extent of InsP3-induced calcium release even at saturating InsP3 concentrations, indicating that the major action of Bcl-2 is not to decrease the affinity of InsP3Rs for InsP3 but to decrease InsP3R channel opening even under conditions of maximal stimulation. Although the complete mechanism is yet to be determined, based on coimmunoprecipitation and BN-PAGE experiments it appears that Bcl-2 coexists in a macromolecular complex with InsP3Rs, resulting in an inhibition of InsP3-induced calcium release. This concept is further supported by in vitro evidence that purified Bcl-2 inhibited the frequency of InsP3 channel opening when added to InsP3Rs integrated into planar lipid bilayers.
Although an inhibitory action of Bcl-2 on InsP3-mediated calcium release has not been reported previously, an inhibitory effect of Bcl-2 on calcium-mediated signaling pathways has been reported, including the induction of the transcription factor c-fos (Qi et al., 1997). Significantly, Linette et al. (1996) demonstrated that Bcl-2 inhibits anti-CD3/TCR–mediated activation of NFATc and induction of interleukin-2 (IL-2) expression, thereby inhibiting cell cycle entry by delaying Go/G1 transition into S phase and also inhibiting TCR activation-mediated apoptosis. Active NFATc is generated by calcineurin, which binds to and dephosphorylates NFATc in the cytoplasm, permitting NFATc to enter the nucleus. It has been suggested that Bcl-2 inhibits NFATc activation by sequestering calcineurin to intracellular membranes (Shibasaki et al., 1997). Our findings suggest that Bcl-2 may inhibit calcineurin activation by inhibiting InsP3-mediated calcium release from the ER. In T cells, calcium/calcineurin-mediated activation of NFATc increases IL-2 expression, which in turn stimulates dual pathways, one leading to cell death and the other leading to cell survival. IL-2 induces cell death via Stat2-mediated induction of the death receptor ligand Fas, whereas IL-2 promotes cell survival via Akt-mediated induction of Bcl-2 expression (Parijs et al., 1999). The findings of the present paper raise the possibility that increased expression of Bcl-2 may form a feedback loop that dampens InsP3-mediated calcium signals, thereby controlling T cell proliferation while maintaining cell survival.
InsP3Rs are known to associate with several factors that regulate InsP3-gated channel activity (Mackrill, 1999; Roderick and Bootman, 2003). This paper is the first to suggest that Bcl-2 may interact with InsP3Rs and regulate their functional activity. Although the full functional significance of the inhibitory effect of Bcl-2 on InsP3R channel activity is as yet unknown, this action of Bcl-2 may contribute to the established inhibitory effects of Bcl-2 on cell cycle entry and/or apoptosis induction. In view of the wide range of cellular functions mediated by InsP3-induced calcium signals (Berridge et al., 2003), it will be interesting in future studies to determine if the function of Bcl-2 goes beyond that of regulating cell cycle entry and apoptosis.
Materials and methods
Reagents
TG, EGTA, digitonin, and other reagents were obtained from Sigma-Aldrich. D-myo-InsP3 and L-myo-InsP3 were obtained from Calbiochem. Fura-2 AM was obtained from Molecular Probes. Fura-2FF AM was obtained from Tef Labs. Hamster anti–mouse CD3e epsilon chain mAb was obtained from BD Biosciences.
Cell culture and transfection procedures
WEHI7.2 and S49.A2 cells were cultured in DME supplemented with 10% serum, l-glutamine, and nonessential amino acids. Human Bcl-2 α cDNA from the pB4 plasmid (American Type Culture Collection) was cloned into the pSFFV-Neo vector. Transfection and cloning were performed as described previously (Dieken and Miesfeld, 1992). Flag-tagged Bcl-2 was selectively localized to the ER by exchanging the COOH-terminal transmembrane sequence of Bcl-2 for the ER-targeting sequence of cytochrome b5, as described previously (Wang et al., 2001). Bcl-2 expression was monitored by flow cytometry of fixed cells using anti–Bcl-2 antibody (BD Biosciences; 15131A) at a 1:500 dilution and Alexa Fluor 488 goat anti–hamster IgG (H+L) conjugate (Molecular Probes; A-21110) as the secondary antibody at a dilution of 1:500.
Calcium fluorometry
Cells (10 ml volume, 1 million per milliliter) were incubated with 1 μM Fura-2 AM for 45 min at 25°C in ECB (130 mM NaCl, 5 mM KCl, 1.5 mM CaCl2, 1 mM MgCl2, 25 mM Hepes, pH 7.5, 1 mg/ml BSA, and 5 mM glucose), after which they were pelleted and resuspended in ECB for an additional incubation at 25°C for 30 min to permit dye de-esterification. Fluorescence was continuously recorded at 37°C (alternating 340 and 380 nm excitation, 510 nm emission) in a fluorometer (Photon Technology Inc.). EGTA (final concentration 10 mM) was added to chelate extracellular calcium immediately before adding 100 nM TG, anti-CD3 antibody (BD Biosciences; 1:150 dilution), or 25 μM D-myo InsP3BM. In experiments using D-myo InsP3BM, the volume of cell suspensions was scaled down to 250 μl in a 300 μl cuvette. All measurements were performed in triplicate. Rmax and Rmin values were determined in each experiment by cell permeabilization with digitonin, followed by sequential addition of calcium and EGTA/Tris. Calcium concentration was calculated, based on the published K d for Fura-2 of 220 nM, by the equation of Grynkiewicz et al. (1985) using Felix Software (Photon Technologies Inc.).
Calcium imaging
Cells adhered to poly-l-lysine–coated coverslips (15 mm) were loaded with 1 μM Fura-2 AM (Molecular Probes) as described in Calcium fluorometry. Coverslips were placed in a recording/perfusion chamber (model RC-25F; Warner Instruments) mounted on the stage of an inverted microscope (model Diaphot; Nikon) equipped with a 20× Fluor objective. Excitation light was alternated between 340 and 380 nm by a filter wheel (Sutter Instrument Co.) and emitted light was filtered at >510 nm and collected with an intensified charge-coupled device camera (model UltraPix; PerkinElmer). The video signal was digitized using Ultraview software (PerkinElmer) and subsequently processed using Microsoft Excel. Cells were perfused with ECB at 25°C and stock solutions of both anti-CD3 antibody (1:40 dilution) and 25 μM D-myo InsP3BM were diluted in ECB immediately before addition to the perfusion chamber. To determine Rmin, cells were perfused with ECB deficient in calcium and supplemented with 4 mM EGTA and 10 μM ionomycin. Rmax was obtained by perfusing cells with ECB supplemented with 4 mM CaCl2 and 10 μM ionomycin. Calcium concentration was calculated as described in Calcium fluorometry.
ER calcium measurement
Luminal calcium measurement was modified after that of Hofer (1999). Cells adhered to poly-l-lysine–coated coverslips were incubated with 1 μM Fura-2FF AM for 30 min at 37°C in ECB, after which the buffer was replaced with fresh ECB and the incubation continued for 45 min at 25°C to permit de-esterification. Cell imaging was performed as described in Calcium imaging. Cells were initially perfused with ECB at 25°C, and then with ICB (125 mM KCl, 25 mM NaCl, 10 mM Hepes, 0.5 mM Na2ATP, 200 μM CaCl2, and 500 μM EGTA, pH 7.25), supplemented with an ATP-regenerating system consisting of 10 μg/ml creatine phosphokinase Type I and 10 mM phosphocreatine. As soon as cells were permeabilized, the perfusion buffer was switched to ICB plus ATP-regenerating system. After the fluorescence ratio reached steady-state, cells were perfused with the same buffer supplemented with D-myo-InsP3 at concentrations given in the text and accompanying figures. Stock solutions of D-myo-InsP3 and L-myo-InsP3 were prepared at a concentration of 3 mM in calcium-free water and stored at −20°C until use. After cell permeabilization with digitonin, the proportion of Fura-2FF located in the ER was determined by quenching luminal dye by perfusing with 10 μM D-myo-InsP3 in ICB supplemented with 100 μM MnCl2. To determine Rmin, permeabilized cells were perfused with ECB deficient in calcium and supplemented with 4 mM EGTA and 10 μM ionomycin. Rmax was obtained by perfusing permeabilized cells with ECB supplemented with 4 mM CaCl2.
The InsP3 dose response relationship was determined by sequential addition of D-myo-InsP3 to digitonin-permeabilized cells while continuously monitoring the Fura-2FF 340:380 ratio. The InsP3-mediated change in the 340:380 ratio was plotted as a function of InsP3 concentration by nonlinear least squares best fit of the data to the Langmuir isotherm equation using Origin 6.0 (Microcal).
Organelle imaging
Confocal Z-series stacks of TMRE-loaded (0.1 μM, 10 min) cells were acquired after permeabilization with digitonin in ICB at RT using an Ultra View LCI (PerkinElmer) with a microscope (model TE300; Nikon), ×100/1.3 objective (Nikon), and Orca ER camera (Hamamatsu) at excitation 568 nm, emission 600 ± 40 nm. The laser intensity was kept at a minimum to prevent irradiation-induced mitochondrial damage. Image acquisition was by UltraView software (PerkinElmer). Nonconfocal Z-series stacks of Fura-2FF loaded cells were obtained after permeabilization with digitonin in ICB at RT using an Ultra View LCI with a microscope, ×100/1.3 objective, epifluorescence arc-lamp as a light source (excitation 330–380 nm, dichroic 400LP, emission 420LP), and Orca ER camera. Subsequent image restoration was achieved with the deconvolution software AutoDeblur (Autoquant).
Western blotting
Cell lysates containing 40–60 μg of protein were separated by SDS-PAGE (15% for Bcl-2 and 4–15% linear gradient for InsP3Rs) followed by electrophoretic transfer onto Immobilon-P PVDF membranes (Millipore). The following antibodies and their respective dilutions were used: anti–human Bcl-2 (BD Biosciences; 15131A, 1:2000), anti–mouse Bcl-2 (BD Biosciences; 554218, 1:1000), anti-actin (Santa Cruz Biotechnology, Inc.; sc-8432, 1:1000), anti-InsP3R Type I (Calbiochem; 407144, 1:2000), anti-InsP3R Type II (Chemicon; AB3000, 1:100), anti-InsP3R Type III (BD Biosciences; 610312, 1:2000), and anti-SERCA3 ATPase (Affinity BioReagents, Inc.; PA1-910, 1:500).
BN-PAGE
ER membranes were isolated from WEHI7.2 cells as described previously (Krajewski et al., 1993). In brief, cells (1–10 × 108) were washed twice with ice-cold PBS (Invitrogen), pH 7.2, and resuspended in 1.5 ml of homogenization buffer (20 mM Hepes, pH 7.4, 2.5 mM EDTA, 250 mM sucrose, and protease inhibitor cocktail). After homogenization for 15–25 strokes with a Dounce homogenizer, samples were centrifuged at 3,000 g for 15 min at 4°C and 1 ml of supernatant was layered onto an 11-ml sucrose gradient (0.75 to 1.9 M sucrose in 20 mM Hepes, pH 7.4, and 2.5 mM EGTA) and centrifuged at 110,000 g for 2 h at 4°C. Sequential fractions of 0.8 ml were collected from the gradient and the distribution of ER and mitochondria was determined by Western blotting. Calnexin (anti-calnexin antibody, SPA-8600; StressGen Biotechnologies) and Cox IV (anti IV COX, A-6403; Molecular Probes) were used as markers of ER and mitochondria, respectively. Fractions containing purified ER membranes were pooled and mixed with three volumes of 20 mM Hepes, pH 7.4. The sample was centrifuged at 105,000 g for 1.5 h at 4°C and the resulting membrane pellet was used for BN-PAGE, performed as described previously (Schagger et al., 1994). The ER membrane was solubilized with 750 mM 6-aminocaproic acid, 50 mM BisTris, pH 7.0, and 1% dodecyl maltoside (5 μg total protein per microliter), and centrifuged at 100,000 g for 15 min at 4°C. Before starting BN-PAGE, Coomassie blue was added to the resulting supernatant to 0.25%. 100 μg of protein was added to each well of 4–10% linear gradient BN-PAGE. Single bands were excised from the blue native gel and applied to a 4–20% linear gradient SDS-PAGE with sample buffer, followed by Western blotting. Sizes of molecular complexes were estimated using a high molecular mass calibration kit for native electrophoresis (17–0445-01; Amersham Biosciences). After completion of electrophoresis, gels were subjected to Western blotting using antibodies to InsP3Rs and human Bcl-2 as described above.
Immunoprecipitation
108 cells were washed twice with PBS and incubated on ice 30 min with 1 ml lysis buffer (50 mM Tris-HCl, pH 7.5, 100 mM NaCl, 2 mM EDTA, 1% CHAPS wt/vol, 50 mM NaF, 200 nM okadaic acid, 1 mM Na3VO4, and protease inhibitor cocktail [Complete Mini; Roche Applied Science]). Cell lysates were centrifuged at 20,000 g for 15 min at 4°C. The resulting supernatant was rotated with 100 μl of 50% protein A or protein G agarose beads at 4°C for 2 h. After removing the beads, the supernatant was incubated with one of the following antibodies: anti–human Bcl-2 (hamster 1:250), anti–mouse Bcl-2 (1:250), anti-InsP3R antibody (anti-Type I, 1:200; anti-Type II, 1:150; anti-Type III, 1:200; or antibody recognizing all three subtypes [Calbiochem; 407143]) overnight at 4°C, followed by rotation with 50 μl protein A or G agarose for 2 h at 4°C. Nonspecific control antibodies used were rabbit serum (1:200 dilution; Life Technologies) and hamster IgG (5 μg/ml; BD Biosciences). The beads were washed four times with lysis buffer and boiled for 5 min in 50 μl sample buffer. The eluted proteins were resolved by SDS-PAGE and analyzed by Western blotting.
InsP3 binding
Specific binding of radiolabeled InsP3 to microsomes was measured as described previously (Riley et al., 2002). Microsomes (50 μg) were added in duplicate to 100 μl binding buffer (2 nM 3H-InsP3 [Dupont NET-911], 2 mM Tris, pH 9.0, 1 mM EDTA, and 1 mg/ml albumin, with or without a range of concentrations of unlabeled InsP3) and incubated on ice for 20 min. The mixture was centrifuged for 15 min at 20,000 g at 4°C. Pellets were solubilized in 100 μl water and added to 10 ml ACS scintillation cocktail (Amersham Biosciences) and their activity was determined by liquid scintillation counting. Nonspecific binding was determined using an excess of unlabeled InsP3. The K d was calculated by Scatchard analysis.
Planar lipid bilayer analysis of InsP3R channel activity
Full-length human Bcl-2 was purified from Escherichia coli M-15 (pRep-4) cells transformed with a pProex-1/hBcl-2 using methods described previously (Lam et al., 1998). Type I InsP3Rs were purified from microsomes isolated from COS-1 cells transfected with pInsP3R1-DT1-ALT plasmid as described previously (Mignery et al., 1989, 1990). Gradient fractions containing InsP3R protein were then identified by immunoblotting with Type 1 receptor antibody and reconstituted into proteoliposomes as previously described (Mignery et al., 1992; Perez et al., 1997). Planar lipid bilayers were formed across a 150-μm diameter aperture in the wall of a Delrin partition as described previously (Perez et al., 1997). Proteoliposomes were added to the solution on one side of the bilayer (defined as the cis-chamber). The other side was defined as the trans-chamber. Standard solutions contained 220 mM CsCH3SO3 cis (20 mM trans), 20 mM Hepes, pH 7.4, and 1 mM EGTA ([Ca2+]Free = 250 nM). A custom current/voltage conversion amplifier was used to optimize single-channel recording. Acquisition software (pClamp; Axon Instruments, Inc.), an IBM compatible 486 computer, and a 12-bit A/D-D/A converter (Axon Instruments, Inc.) were used. Single channel data were digitized at 5–10 KHz and filtered at 1 KHz. Channel sidedness was determined by InsP3 sensitivity. The orientation of the channels studied was such that the InsP3 sensitive side (i.e., cytoplasmic side) was in the cis compartment.
Acknowledgments
We thank George Dubyak, David Friel, Edmunds Reineks, Huiling He, Irma Lengu, Michael Malone, Anthony Berdis, Rod O'Conner, Steven Madison, and Anthony Holmes for advice and help with experiments.
This work was supported by National Institutes of Health grants CA85804 and CA42755 (C.W. Distelhorst), by an International Union Against Cancer Yamagiwa-Yoshida Memorial International Cancer Study grant (C.W. Distelhorst), and by Fondecyt 1020927 and 7020927 (P. Velez). We also thank the Biotechnology and Biological Sciences Research Council and Human Frontier Science Programme (M.D. Bootman and H.L. Roderick) for financial support and the Engineering and Physical Sciences Research Council Mass Spectrometry Service for mass spectra.
Abbreviations used in this paper: BN-PAGE, blue native–PAGE; ECB, extracellular buffer; D-myo InsP3BM, D-myo InsP3 hexakisbutyryloxymethyl ester; ICB, intracellular buffer; IL-2, interleukin-2; InsP3, inositol 1,4,5-trisphosphate; InsP3R, InsP3 receptor; TCR, T cell receptor; TG, thapsigargin; TMRE, tetramethylrhodamine ethyl ester.
References
- Baffy, G., T. Miyashita, J.R. Williamson, and J.C. Reed. 1993. Apoptosis induced by withdrawal of interleukin-3 (IL-3) from an IL-3-dependent hematopoietic cell line is associated with repartitioning of intracellular calcium and is blocked by enforced Bcl-2 oncoprotein production. J. Biol. Chem. 268:6511–6519. [PubMed] [Google Scholar]
- Berridge, M.J., M.D. Bootman, and H.L. Roderick. 2003. Calcium signaling: dynamics, homeostasis and remodelling. Nat. Rev. Mol. Cell Biol. 4:517–529. [DOI] [PubMed] [Google Scholar]
- Boehning, D., R.L. Patterson, L. Sedaghat, N.O. Glebova, T. Kurosaki, and S.H. Snyder. 2003. Cytochrome c binds to inositol (1,4,5) trisphosphate receptors, amplifying calcium-dependent apoptosis. Nat. Cell Biol. 5:1051–1061. [DOI] [PubMed] [Google Scholar]
- Cory, S., and J.M. Adams. 2002. The Bcl-2 family: regulators of the cellular life-or-death switch. Nat. Rev. Cancer. 2:647–656. [DOI] [PubMed] [Google Scholar]
- Crabtree, G.R. 1999. Generic signals and specific outcomes: signaling through Ca2+, calcineurin, and NF-AT. Cell. 96:611–614. [DOI] [PubMed] [Google Scholar]
- Danial, N.N., and S.J. Korsmeyer. 2004. Cell death: critical control points. Cell. 116:205–219. [DOI] [PubMed] [Google Scholar]
- Dieken, E.S., and R.L. Miesfeld. 1992. Transcriptional transactivation functions localized to the glucocorticoid receptor N terminus are necessary for steroid induction of lymphocyte apoptosis. Mol. Cell. Biol. 12:589–597. [DOI] [PMC free article] [PubMed] [Google Scholar]
- Distelhorst, C.W., and G.C. Shore. 2004. Bcl-2 and calcium: controversy beneath the surface. Oncogene. 23:2875–2880. [DOI] [PubMed] [Google Scholar]
- Green, D.R., and J.C. Reed. 1998. Mitochondria and apoptosis. Science. 281:1309–1312. [DOI] [PubMed] [Google Scholar]
- Gross, A., J.M. McDonnell, and S.J. Korsmeyer. 1999. BCL-2 family members and the mitochondria in apoptosis. Genes Dev. 13:1899–1911. [DOI] [PubMed] [Google Scholar]
- Grynkiewicz, G., M. Poenie, and R.Y. Tsien. 1985. A new generation of Ca2+ indicators with greatly improved fluorescence properties. J. Biol. Chem. 260:3440–3450. [PubMed] [Google Scholar]
- Hacki, J., L. Egger, L. Monney, S. Conus, T. Rosse, I. Fellary, and C. Borner. 2000. Apoptotic crosstalk between the endoplasmic reticulum and mitochondria controlled by Bcl-2. Oncogene. 19:2286–2295. [DOI] [PubMed] [Google Scholar]
- Hajnoczky, G., E. Davies, and M. Madesh. 2003. Calcium signaling and apoptosis. Biochem. Biophys. Res. Commun. 304:445–454. [DOI] [PubMed] [Google Scholar]
- Hofer, A.M. 1999. Measurement of free [Ca2+] changes in agonist-sensitive internal stores using compartmentalized fluorescent indicators. Calcium Signaling Protocols. Vol. 114. D.G. Lambert, editor. Humana Press Inc., Totowa, NJ. 249–265. [DOI] [PubMed]
- Ichimiya, M., S.H. Chang, H. Liiu, I.K. Berezesky, B.F. Trump, and P.A. Amstad. 1998. Effect of Bcl-2 on oxidant-induced cell death and intracellular Ca2+ mobilization. Am. J. Physiol. 275:C832–C839. [DOI] [PubMed] [Google Scholar]
- Jayaraman, T., and A.R. Marks. 1997. T cells deficient in inositol 1,4,5-trisphosphate receptor are resistant to apoptosis. Mol. Cell. Biol. 17:3005–3012. [DOI] [PMC free article] [PubMed] [Google Scholar]
- Kaufmann, T., S. Schlipf, J. Sanz, K. Neubert, R. Stein, and C. Borner. 2003. Characterization of the signal that directs Bcl-x(L), but not Bcl-2, to the mitochondrial outer membrane. J. Cell Biol. 160:53–64. [DOI] [PMC free article] [PubMed] [Google Scholar]
- Khan, A.A., M.J. Soloski, A.H. Sharp, G. Schilling, D.M. Sabatini, S.-H. Li, C.A. Ross, and S.H. Snyder. 1996. Lymphocyte apoptosis: mediation by increased type 3 inositol 1,4,5,-trisphosphate receptor. Science. 273:503–507. [DOI] [PubMed] [Google Scholar]
- Krajewski, S., S. Tanaka, S. Takayama, M.J. Schibler, W. Fenton, and J.C. Reed. 1993. Investigation of the subcellular distribution of the bcl-2 oncoprotein: residence in the nuclear envelope, endoplasmic reticulum, and outer mitochondrial membranes. Cancer Res. 53:4701–4714. [PubMed] [Google Scholar]
- Lam, M., G. Dubyak, L. Chen, G. Nuñez, R.L. Miesfeld, and C.W. Distelhorst. 1994. Evidence that BCL-2 represses apoptosis by regulating endoplasmic reticulum-associated Ca2+ fluxes. Proc. Natl. Acad. Sci. USA. 91:6569–6573. [DOI] [PMC free article] [PubMed] [Google Scholar]
- Lam, M., M.B. Bhat, G. Nunez, J. Ma, and C.W. Distelhorst. 1998. Regulation of Bcl-xL channel activity by calcium. J. Biol. Chem. 273:17307–17310. [DOI] [PubMed] [Google Scholar]
- Linette, G.P., Y. Li, K. Roth, and S.J. Korsmeyer. 1996. Cross talk between cell death and cell cycle progression: BCL-2 regulates NFAT-mediated activation. Proc. Natl. Acad. Sci. USA. 93:9545–9552. [DOI] [PMC free article] [PubMed] [Google Scholar]
- Mackrill, J. 1999. Protein-protein interactions in intracellular Ca2+ release channel function. Biochem. J. 337:345–361. [PMC free article] [PubMed] [Google Scholar]
- Magnelli, L., M. Cinelli, A. Turchetti, and V.P. Chiarugi. 1994. Bcl-2 overexpression abolishes early calcium waving preceding apoptosis in NIH-3T3 murine fibroblasts. Biochem. Biophys. Res. Commun. 204:84–90. [DOI] [PubMed] [Google Scholar]
- Marin, M.C., A. Fernandez, R.J. Bick, S. Brisbay, L.M. Buja, M. Snuggs, D.J. McConkey, A.C. von Eschenbach, M.J. Keating, and T.J. McDonnell. 1996. Apoptosis suppression by bcl-2 is correlated with the regulation of nuclear and cytosolic Ca2+. Oncogene. 12:2259–2266. [PubMed] [Google Scholar]
- Mignery, G.A., T.C. Sudhof, K. Takel, and P. De Camilli. 1989. Putative receptor for inositol 1,4,5-trisphosphate similar to ryanodine receptor. Nature. 342:192–195. [DOI] [PubMed] [Google Scholar]
- Mignery, G.A., C.L. Newton, B.T. Archer III, and T.C. Sudhof. 1990. Structure and expression of the rat inositol-1,4,5-trisphosphate receptor. J. Biol. Chem. 265:12679–12685. [PubMed] [Google Scholar]
- Mignery, G.A., P.A. Johnston, and T.C. Sudhof. 1992. Mechanism of Ca2+ inhibition of InsP3 binding to the cerebellar InsP3 receptor. J Biol Chem. 267:7450–7455. [PubMed] [Google Scholar]
- Orrenius, S., B. Zhivotovsky, and P. Nicotera. 2003. Regulation of cell death: The calcium-apoptosis link. Nat. Rev. Mol. Cell Biol. 4:552–565. [DOI] [PubMed] [Google Scholar]
- Pacher, P., and G. Hajnoczky. 2001. Propagation of the apoptotic signal by mitochondrial waves. EMBO J. 20:4107–4121. [DOI] [PMC free article] [PubMed] [Google Scholar]
- Parijs, L.V., Y. Refaeli, J.D. Lord, B.H. Nelson, A.K. Abbas, and D. Baltimore. 1999. Uncoupling IL-2 signals that regulate T cell proliferation, survival, and Fas-mediated activation-induced cell death. Immunity. 11:281–288. [DOI] [PubMed] [Google Scholar]
- Patel, S., S.K. Joseph, and A.P. Thomas. 1999. Molecular properties of inositol 1,4,5-trisphosphate receptors. Cell Calcium. 25:247–264. [DOI] [PubMed] [Google Scholar]
- Perez, P.J., J. Ramos-Franco, M. Fill, and G.A. Mignery. 1997. Identification and functional reconstitution of the type-2 InsP3 receptor from ventricular cardiac myocytes. J. Biol. Chem. 272:23961–23969. [DOI] [PubMed] [Google Scholar]
- Pinton, P., D. Ferrari, E. Rapizzi, F. De Virgilio, T. Pozzan, and R. Rizzuto. 2001. The Ca2+ concentration of the endoplasmic reticulum is a key determinant of ceramide-induced apoptosis: significance for the molecular mechanism of Bcl-2 action. EMBO J. 20:2690–2701. [DOI] [PMC free article] [PubMed] [Google Scholar]
- Qi, X.-M., M. Simonson, and C.W. Distelhorst. 1997. Bcl-2 inhibits c-fos induction by calcium. Oncogene. 15:2849–2853. [DOI] [PubMed] [Google Scholar]
- Ramos-Franco, J., S. Caenepeel, M. Fill, and G. Mignery. 1998. Single channel function of recombinant type-1 inositol 1,4,5-trisphosphate receptor ligand binding domain splice variants. Biophys. J. 75:2783–2793. [DOI] [PMC free article] [PubMed] [Google Scholar]
- Riley, A.M., S.A. Morris, E.P. Nerou, V. Correa, B.V. Potter, and C.W. Taylor. 2002. Interactions of inositol 1,4,5-trisphosphate (IP(3)) receptors with synthetic poly(ethylene glycol)-linked dimers of IP(3) suggest close spacing of the IP(3)-binding site. J. Biol. Chem. 277:40290–40295. [DOI] [PubMed] [Google Scholar]
- Roderick, H.L., and M.D. Bootman. 2003. Bi-directional signalling from the InsP3 receptor: regulation by calcium and accessory factors. Biochem. Soc. Trans. 31:950–953. [DOI] [PubMed] [Google Scholar]
- Schagger, H., W.A. Cramer, and G. von Jagow. 1994. Analysis of molecular masses and oligomeric states of protein complexes by blue native electrophoresis and isolation of membrane protein complexes by two-dimensional native electrophoresis. Anal. Biochem. 217:220–230. [DOI] [PubMed] [Google Scholar]
- Shibasaki, F., E. Kondo, T. Akagi, and F. McKeon. 1997. Suppression of signalling through transcription factor NF-AT by interactions between calcineurin and Bcl-2. Nature. 386:728–731. [DOI] [PubMed] [Google Scholar]
- Sugawara, H., M. Kurosaki, M. Takata, and T. Kurosaki. 1997. Genetic evidence for involvement of type 1, type 2 and type 3 inositol 1,4,5-trisphosphate receptors in signal transduction through the B-cell antigen receptor. EMBO J. 16:3078–3088. [DOI] [PMC free article] [PubMed] [Google Scholar]
- Szalai, G., R. Krishnamurthy, and G. Hajnoczky. 1999. Apoptosis driven by IP(3)-linked mitochondrial calcium signals. EMBO J. 18:6349–6361. [DOI] [PMC free article] [PubMed] [Google Scholar]
- Taylor, C.W., A.A. Genazzani, and S.A. Morris. 1999. Expression of inositol trisphosphate receptors. Cell Calcium. 26:237–251. [DOI] [PubMed] [Google Scholar]
- Thomenius, M.J., N.S. Wang, E.Z. Reineks, Z. Wang, and C.W. Distelhorst. 2003. Bcl-2 on the endoplasmic reticulum regulates Bax activity by binding to BH3-only proteins. J. Biol. Chem. 278:6243–6250. [DOI] [PubMed] [Google Scholar]
- Wang, N.S., M. Unkila, E.Z. Reineks, and C.W. Distelhorst. 2001. Transient expression of wild-type or mitochondrially targeted Bcl-2 induced apoptosis, whereas transient expression of endoplasmic reticulum-targeted Bcl-2 is protective against Bax-induced cell death. J. Biol. Chem. 276:44117–44128. [DOI] [PubMed] [Google Scholar]
- Wang, Z., M.H. Malone, H. He, K.S. McColl, and C.W. Distelhorst. 2003. Microarray analysis uncovers the induction of the proapoptotic BH3-only protein Bim in multiple models of glucocorticoid-induced apoptosis. J. Biol. Chem. 278:23861–23867. [DOI] [PubMed] [Google Scholar]
- Williams, S.S., J.N. French, M. Gilbert, A.A. Rangaswami, J. Walleczek, and S.J. Knox. 2000. Bcl-2 overexpression results in enhanced capacitative calcium entry and resistance to SKF-96395-induced apoptosis. Cancer Res. 60:4358–4361. [PubMed] [Google Scholar]
- Zhu, L., S. Ling, X.-D. Yu, L.K. Venkatesh, T. Subramanian, G. Chinnadurai, and T.H. Kuo. 1999. Modulation of mitochondrial Ca2+ homeostasis by Bcl-2. J. Biol. Chem. 274:33267–33273. [DOI] [PubMed] [Google Scholar]
- Zhu, W., A. Cowie, G.W. Wasfy, L.Z. Penn, B. Leber, and D.W. Andrews. 1996. Bcl-2 mutants with restricted subcellular location reveal spatially distinct pathways for apoptosis in different cell types. EMBO J. 15:4130–4141. [PMC free article] [PubMed] [Google Scholar]
- Zornig, M., G. Busch, R. Beneke, E. Gulbins, F. Lang, A. Ma, S. Korsmeyer, and T. Moroy. 1995. Survival and death of prelymphomatous B-cells from N-myc/bcl-2 double transgenic mice correlates with the regulation of intracellular Ca2+ fluxes. Oncogene. 11:2165–2174. [PubMed] [Google Scholar]


