

Abstract
Phosphatidylinositol 4,5-bisphosphate (PIP2) is the obligatory precursor of inositol 1,4,5-trisphosphate (InsP3 or IP3) and is therefore critical to intracellular Ca2+ signaling. Using RNA interference (RNAi), we identified the short splice variant of type I phosphatidylinositol 4-phosphate 5-kinase γ (PIP5KIγ87) as the major contributor of the PIP2 pool that supports G protein–coupled receptor (GPCR)-mediated IP3 generation. PIP5KIγ87 RNAi decreases the histamine-induced IP3 response and Ca2+ flux by 70%. Strikingly, RNAi of other PIP5KI isoforms has minimal effect, even though some of these isoforms account for a larger percent of total PIP2 mass and have previously been implicated in receptor mediated endocytosis or focal adhesion formation. Therefore, PIP5KIγ87's PIP2 pool that supports GPCR-mediated Ca2+ signaling is functionally compartmentalized from those generated by the other PIP5KIs.
Introduction
Phosphatidylinositol 4,5-bisphosphate (PIP2) regulates multiple plasma membrane (PM) functions (Doughman et al., 2003; Yin and Janmey, 2003), and it is also a substrate for PLC-mediated inositol 1,4,5-trisphosphate (InsP3 or IP3) generation. In spite of PIP2's obligatory role as an IP3 precursor, and the importance of IP3 mediated Ca2+ signaling, surprisingly little is known about the identity of the phosphoinositide kinases involved. Unlike yeast, which has a single type I phosphatidylinositol 4-phosphate 5-kinase (PIP5KI) that synthesizes PIP2 (Audhya and Emr, 2003), mammals have three major PIP5KI isoforms named α, β and γ (Doughman et al., 2003).
PIP5KIγ has two splice variants (PIP5KIγ87 and 90) that are distinguished by a 28–amino acid extension at the COOH terminus of PIP5KIγ90 (Di Paolo et al., 2002; Ling et al., 2002; Fig. 1 A). PIP5KIγ90 is particularly enriched in neurons (Wenk et al., 2001); it is the major PIP2 synthesizing enzyme at the synapse, where it has been implicated in the regulation of clathrin coat recruitment, actin dynamics (Wenk et al., 2001) and focal adhesion formation (Di Paolo et al., 2002; Ling et al., 2002). In contrast, PIP5KIγ87 is not involved in focal adhesion formation or clathrin-mediated endocytosis (in HeLa cells; Padron et al., 2003).
Figure 1.
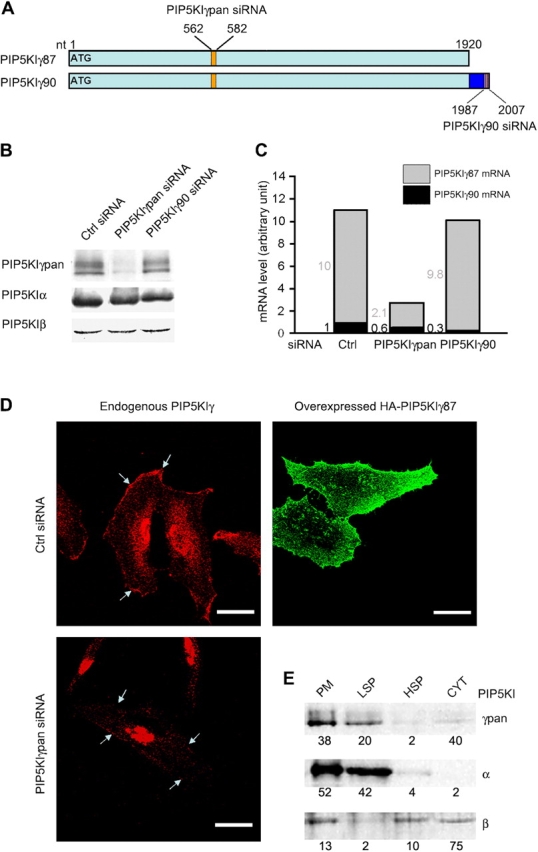
PIP5KIγ RNAi. (A) PIP5KIγ siRNA design. Pan siRNA is directed against both isoforms. (B) PIP5KIγ protein knockdown. Effect of PIP5Kγ RNAi on protein expression of the targeted and nontargeted PIP5KIs. Western blots were probed with isoform specific antibodies. Additional data are provided in Table S1, available at http://www.jcb.org/cgi/content/full/jcb.200408008/DC1. (C) Quantitative real-time PCR. PCR primers were used to quantitate PIP5KIγpan and PIP5KIγ90 mRNA and PIP5KIγ87 mRNA was calculated from the difference. Numbers indicate the amounts of each isoform relative to PIP5KIγ90 in control cells. Data are the average of duplicate RNAi samples from a single experiment. Similar results were obtained from another experiment. (D) PIP5KIγ is enriched in the PM. Endogenous PIP5KIγ was detected with anti-PIP5KIγpan antibody, and overexpressed HA-PIP5KIγ87 (in cDNA-transfected cells) were stained with anti-HA. Arrows indicate PM. Bars, 50 μm. (E) Differential PIP5KI membrane association. Fractions obtained after sequential sedimentation were loaded equivalently, except for the cytosol fraction (CYT), which was loaded 10 times less. Western blot band intensity was determined by quantitative densitometry, and expressed as a percent of total recovered, after correcting for differences in fraction of sample loaded.
Here, we examined the role of PIP5KIγ87 in intracellular Ca2+ signaling. Previous biochemical studies have shown that cells have agonist-sensitive and -insensitive PIP2 pools (Koreh and Monaco, 1986). Inhibitor studies suggest that the agonist-sensitive pool can be further classified as constitutive or de novo generated in response to agonists (Nakanishi et al., 1995). Some of these pools are enriched in cholesterol–sphingolipid raft domains (Pike and Casey, 1996) and the stringent spatial and temporal regulation of Ca2+ may be specified by assembling key players into supramolecular signaling complexes (Delmas et al., 2004). We now report that PIP5KIγ87 is the major source of the agonist-sensitive PM PIP2 pool that fuels the initial Ca2+ response to external stimuli.
Results and discussion
Knockdown of PIP5KIγ87 by RNA interference
We use small interfering RNA (siRNA) mediated RNA interference (RNAi) to knockdown each PIP5KI individually (Padron et al., 2003). Anti-PIP5KIγpan antibody recognizes a sharp 87-kD band and a slower migrating diffuse band (Fig. 1 B) which is probably hyperphosphorylated PIP5KIγ87 (Park et al., 2001; Wenk et al., 2001). Anti-PIP5KIγpan stains the PM, the perinuclear region and the nucleus (Fig. 1 D). Low level HA-PIP5KIγ87 overexpression confirms that PIP5KIγ is enriched in the PM and punctate internal structures, but rules out nuclear localization.
Biochemical fractionation shows that 60% of PIP5KIγ87 is sedimented by high speed centrifugation (Fig. 1 E), and approximately two thirds of this is associated with the PM enriched fraction. PIP5KIα is much more membrane bound, whereas PIP5KIβ is least membrane associated. Therefore, these PIP5KIs have different patterns of membrane association. Nevertheless, each can potentially generate PIP2 at the PM and internal membranes.
Because it is not possible to knockdown PIP5KIγ87 exclusively, we compared the effects of siRNA directed against both PIP5KIγ isoforms (PIP5KIγpan) to that of PIP5KIγ90 alone. PIP5KIγpan siRNA decreases all PIP5KIγ bands in Western blots (Fig. 1 B) and reduces PM and cytoplasmic anti-PIP5KIγ immunofluorescence, but not the nonspecific nuclear staining (Fig. 1 D). PIP5KIγ90 siRNA has little effect on either PIP5KIγ bands (Fig. 1 B), even though quantitative real-time PCR established that PIP5KIγ90 mRNA is decreased by 70% (Fig. 1 C). We conclude that HeLa cells have very little PIP5KIγ90.
Unexpectedly, PIP5KIγpan siRNA preferentially knocks down PIP5Kγ87 mRNA relative to PIP5KIγ90. Because PIP5Kγ87 is more abundant than PIP5Kγ90 in HeLa cells and PIP5Kγpan siRNA generates a distinct phenotype (compared with that of PIP5Kγ90 siRNA), the PIP5KIγpan siRNA effects described here can be attributed primarily to PIP5KIγ87 knockdown. Importantly, PIP5KIγpan siRNA has almost no effect on PIP5KIα and β protein expression (Fig. 1 B), establishing that the PIP5KIγ87 knockdown phenotype is not complicated by compensatory changes in the other PIP5KIs. This was originally a concern, because we have previously found that knockdown of one PIP5KI induces changes in the mRNA level of some other PIP5KIs (Padron et al., 2003).
PIP5KIγ87 is the major supplier of the PIP2 pool that supports GPCR-mediated Ca2+ signaling
Histamine binding to the H1 type G protein–coupled receptor (GPCR) in HeLa cells (Tilly et al., 1990) initiates a PLCβ activation cascade that culminates in the hydrolysis of PIP2 to generate IP3 and diacylglycerol. When control cells were stimulated with a supramaximal histamine dose (100 μM), they generate a transient robust IP3 response (Fig. 2 A). PIP5KIγ87 RNAi decreases the initial IP3 peak by 69% [to 10 ± 3 pmol IP3/mg protein (n = 5)] (Fig. 2, A and B). Neither PIP5KIγ90 nor PIP5KIβ RNAi has any apparent effect, and PIP5KIα RNAi only decreases the initial IP3 peak slightly [by 11%; to 28 ± 2 pmol/mg protein (n = 3)] (Fig. 2 B). Although we cannot rule out a small contribution by PIP5KIβ or α because each is less completely knocked down than PIP5KIγ, we can conclude that PIP5KIγ87 is the dominant regulator.
Figure 2.

PIP5KIγpan siRNA blocks histamine-stimulated IP3 generation. Cells were stimulated with 100 μM histamine. (A) Effect of PIP5KIγpan siRNA on IP3 generation. Data shown are representative of five independent experiments. (B) Effect of PIP5KI RNAi on the initial IP3 peak response. Values are mean ± SEM of multiple independent experiments (n).
Consistent with a decrease in IP3 production, PIP5KIγpan RNAi also attenuates histamine-induced Ca2+ signaling. In control cells, 100 μM histamine induces a rapid and transient rise in intracellular Ca2+ concentration ([Ca2+]i) in 95% of the cells examined (Fig. 3 A). PIP5KIγ87 RNAi reduces the percent of responding cells slightly (by 13%), decreases the amplitude of the first Ca2+ peak more [by 36%; from 1.14 ± 0.07 (n = 19) to 0.73 ± 0.08 (n = 10) fluorescence ratio unit], and has the most impact on Ca2+ flux [76% decrease; from 0.33 ± 0.03 (n = 19) to 0.08 ± 0.01 (n = 10) unit/s] (Fig. 3 A). Because Ca2+ flux correlates with the open probability of the IP3Rs and hence the rate of IP3 generation (Johenning et al., 2004), our results establish that PIP5KIγ87 RNAi depletes the PIP2 pool used for IP3 generation. A similarly large decrease in Ca2+ flux was also observed when PIP2 was depleted by overexpressing the PIP2 phosphatase synaptojanin (Johenning et al., 2004).
Figure 3.

PIP5KIγpan siRNA attenuates intracellular Ca 2+ signaling. Cells loaded with fura2-AM in randomly chosen microscopic fields were ratio imaged (F340/F380) to obtain baseline Ca2+ values. Histamine was added in the absence of extracellular Ca2+, and the ratio image was recorded as a function of time. (A) Ca2+ response to 100 μM histamine (indicated by the arrow). Representative tracings for each type of RNAi are shown. Values in bar graphs are expressed as percent (mean ± SEM) of control. (B) In vivo rescue of intracellular Ca2+ signaling in PIP5KIγpan siRNA-treated cells by Shuttle PIP2. Top panels are representative tracings. (Bottom) The Ca2+ flux of the transients elicited by the second histamine addition was plotted and 10 cells were analyzed per condition.
The weakened Ca2+ response by PIP5KIγ87 RNAi cells is not due to depletion of Ca2+ stores, because thapsigargin releases similar amounts of Ca2+ into the cytosol of control and siRNA cells (unpublished data). The [Ca2+]i response to UTP, which binds a different GPCR than histamine (P2Y and H1, respectively), is blunted as well (unpublished data). [Ca2+]i increase in the presence of 1.3 mM of extracellular Ca2+ (Table S2, available at http://www.jcb.org/cgi/content/full/jcb.200408008/DC1) is also attenuated, confirming that the lack of PIP2 impacts the entire Ca2+ signaling cascade that starts with Ca2+ release from internal stores and ends with capacitative Ca2+ entry (that usually follows the depletion of intracellular Ca2+ stores).
As expected, in control cells, 1 μM histamine induces a slower Ca2+ flux than 100 μM histamine [0.24 ± 0.01 (n = 63) vs. 0.33 ± 0.03 (n = 19) fluorescence ratio unit/s]. Paradoxically, PIP5KIγ87 RNAi cells have the same low Ca2+ flux [0.08 ± 0.01 (n = 46) vs. 0.08 ± 0.01 (n = 10) fluorescence ratio unit/s] at both histamine doses. We cannot explain why this is the case. Perhaps because PIP2 is already limiting at submaximal stimulation, increasing the intensity of the stimulus does not significantly increase the amount of IP3 generated due to lack of substrate.
Unlike PIP5KIγ87 RNAi, PIP5KIγ90, α or β RNAi has much less effects (Fig. 3 A), paralleling the trend observed with IP3 production (Fig. 2 B). Thus, the PIP5KIγpan siRNA phenotype can be most simply explained by a decrease in the amount of PLCβ accessible PM PIP2 and that this pool is generated primarily by PIP5KIγ87.
If PIP5KIγ87 RNAi suppresses Ca2+ signaling by depleting PM PIP2, restoring membrane PIP2 should rescue the Ca2+ response. We used a membrane permeant polyamine shuttle carrier to deliver exogenous PIP2 into intact cells (Ozaki et al., 2000; Wang et al., 2003). Control HeLa cells respond to sequential histamine challenges identically, and Shuttle PIP2 does not change the Ca2+ response significantly (Fig. 3 B). PIP5KIγ87 RNAi cells, which are already less responsive to the first stimulus than control cells, have an even more blunted response to the second stimulus in the absence of Shuttle PIP2 (Fig. 3 B, left). This is consistent with depletion of the already small PIP2 pool by the first stimulus, and inadequate refilling before the second stimulus. Significantly, Shuttle PIP2 restores the Ca2+ response of PIP5KIγ87 RNAi cells to ∼74% of that observed in Ctrl RNAi cells (Fig. 3 B). Therefore, the Ca2+ signaling defect is due to PIP2 depletion by PIP5KIγ RNAi.
Together, our results demonstrate that PIP5KIγ87 has a critical role in GPCR-mediated IP3 signaling in HeLa cells. Interestingly, overexpressed mouse PIP5KIβ (equivalent to human PIP5KIα described in this paper) stimulates tyrosine kinase receptor activated-IP3 generation in B lymphocytes (Saito et al., 2003). Together, these results raise the intriguing possibility that the GPCR- and tyrosine kinase receptor-coupled PIP2 pools may be governed by different PIP5KIs. We plan to determine if this is the case in future studies.
Effects of PIP5KIγ87 RNAi on PIP2 content and distribution
To understand how PIP5KIγ87 uniquely contributes to GPCR mediated IP3 signaling, we estimated the size and location of its PIP2 pool relative to those of other PIP5KIs. PIP5KIγpan siRNA reduces PIP2 mass, determined by HPLC (Nasuhoglu et al., 2002), by 14% [from 377 ± 90 (n = 3) to 325 ± 95 (n = 3) pmol/mg protein] and 32P-incorporation into PIP2, determined by TLC, to a similar extent (Fig. 4 A). PIP5KIγ90 siRNA has no statistically significant effect. PIP5KIβ RNAi decreases PIP2 mass by 34% (Fig. 4 A), which is consistent with the large decrease in [32P]PIP2 reported previously (Padron et al., 2003). Paradoxically, although PIP5KIα RNAi does not decrease [32P]PIP2 (Padron et al., 2003), it decreases PIP2 mass by 33%. The difference between the TLC and HPLC estimates may be because they measure different parameters. 32P-labeling/TLC detects PIP2 that turns over during the labeling period, whereas the HPLC method does not involve radiolabeling (Nasuhoglu et al., 2002) and measures PIP2 mass. It is possible that the 4-h labeling interval we used was not long enough to completely equilibrate a particularly stable PIP2 pool, and therefore underestimates its size.
Figure 4.
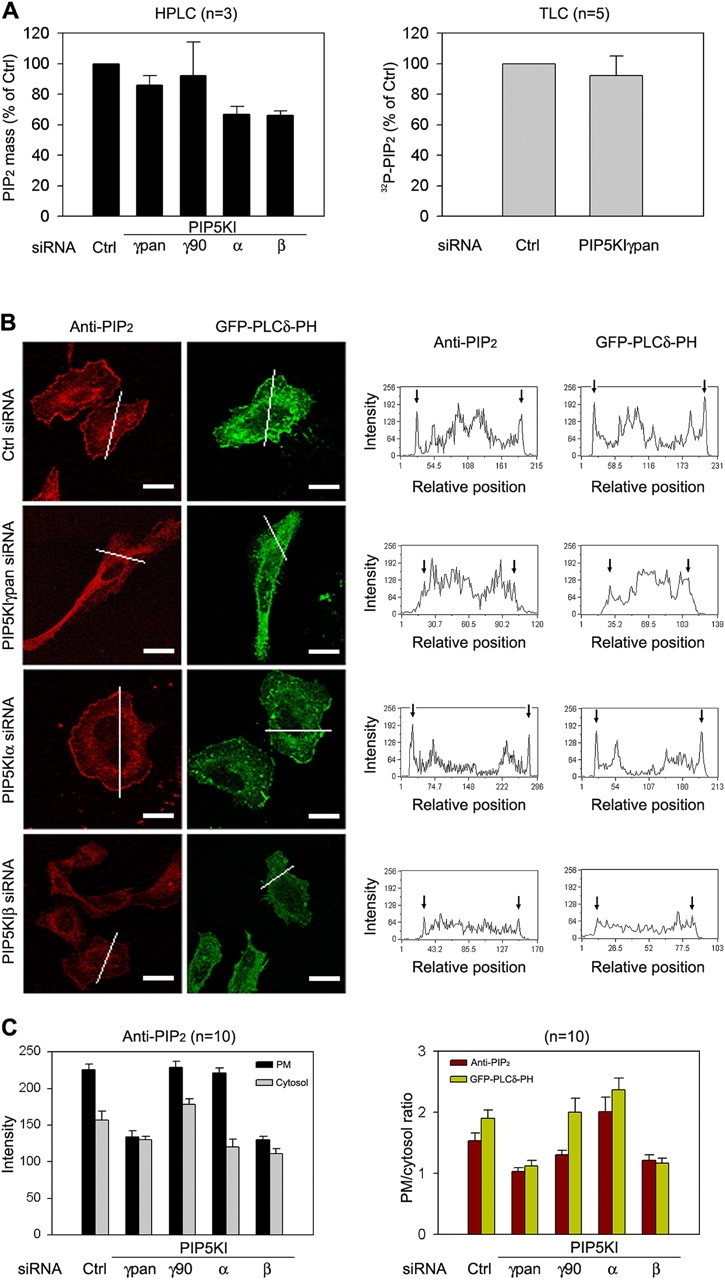
Effect of PIP5KI RNAi on PIP2. (A) PIP2 mass (HPLC) and 32P-incorporation (TLC). Means ± SEM of independent experiments are shown. (B) PIP2 distribution as detected with anti-PIP2 and overexpressed GFP-PLCδ-PH. Cross-sectional plots of fluorescence intensity are shown next to the image. Bars, 50 μm. (C) Analysis of PIP2 quantitation. (Left) The average intensities of anti-PIP2 at the PM and inside the cell are expressed in arbitrary units (mean ± SEM). 10 cells were analyzed per RNAi condition. (Right) PM/cytoplasmic intensity ratios of anti-PIP2 and GFP-PLCδ-PH were shown. 10 cells were analyzed per label per RNAi condition.
PIP5KIγ87 RNAi decreases PM PIP2 significantly. PIP2 was detected by single cell fluorescence imaging using overexpressed GFP-PLCδ-PH (Varnai and Balla, 1998; Watt et al., 2002) and anti-PIP2 (Laux et al., 2000; Matsuda et al., 2001; Fig. 4 B). Although it is generally accepted that the PM is particularly enriched in PIP2 and that GFP-PLCδ-PH labels the PM intensely, internal GFP-PLCδ-PH labeling has also been reported in at least some types of cells (Matsuda et al., 2001). However, because GFP-PLCδ-PH was overexpressed and also binds IP3 (Hirose et al., 1999), it is difficult to determine if the internal GFP-PLCδ-PH is bound to PIP2/IP3 or represents unliganded PH. This issue is clarified somewhat by a quantitative immuno-electron microscopic study which shows that the PM accounts for 40% of total GST-PLCδ-PH labeling, and internal organelles account for the remainder (Watt et al., 2002).
Our anti-PIP2 staining results clearly shows that PIP2 is present in internal membranes as well as PM in HeLa cells. Using image quantitation (Fig. 4, B and C), we estimate that anti-PIP2 fluorescence in the vicinity of the PM accounts for 12.3 ± 1.2% (n = 10) of total, and its intensity is 1.54 ± 0.13 times (n = 10) higher than in internal sites (PM/cytosol ratio; Fig. 4 C). Although these cross-sectional analyses underestimate the size of the PM pool (compared with morphometric analysis by electron microscopy, as described by Watt et al., 2002), it can be used to compare the effects of different PIP5KI RNAi.
PIP5KIγpan RNAi decreases the PM anti-PIP2 intensity from 226 ± 7 to 134 ± 8 arbitrary units (59% of control) and internal PIP2 from 157 ± 12 to 130 ± 12 arbitrary units (84% of control; Fig. 4 C). Therefore, PM PIP2 is preferentially depleted. PIP5KIβ RNAi decreases anti-PIP2 intensity at the PM to the same extent (to 58% of control; Fig. 4 B) but has a greater effect on internal PIP2 (71% of control). In contrast, PIP5KIα RNAi has no detectable effect on PM PIP2 (98% remains after RNAi), but decreases internal staining (76% remaining; Fig. 4, B and C). The differential responses of PM versus internal PIP2 is evident when the average intensity of PM PIP2 is expressed as a ratio to that in the cytosol (Fig. 4 C, right). Qualitatively similar, but not identical, changes are also observed with GFP-PLCδ-PH (Fig. 4 C). Thus, these two independent methods both show that PIP5KIγ87 and PIP5KIβ RNAi decrease PM PIP2, even though only the former suppresses GPCR-mediated IP3/Ca2+ signaling.
In conclusion, PIP5KIγ87 is the major source of the GPCR mobilized PIP2 pool. This specialized PIP2 accounts for a small fraction of total PIP2, a significant fraction of PM PIP2 and most of the histamine induced IP3 response. The exquisitely selective effect of PIP5KIγ87 RNAi on Ca2+ signaling suggests that the cell's PIP2 is functionally compartmentalized in a PIP5KI-dependent manner. This study provides a mechanistic understanding of how PIP2 can regulate multiple PM functions independently. Additional studies will determine if PIP5KIγ87 is part of the supramolecular PLCβ signaling scaffold that specifies rapid local Ca2+ generation and propagation (Delmas et al., 2004), and whether the functionally compartmentalized PIP2 is physically segregated in the PM.
Materials and methods
Antibodies
Anti-PIP5KIα was purchased from Santa Cruz Biotechnology, Inc. Anti-PIP5KIβ and PIP5KIγpan were gifts from C. Carpenter (Harvard Medical School, Boston, MA) and P. De Camilli (Yale University, New Haven, CT; Wenk et al., 2001), respectively. Monoclonal anti-PIP2 (Fukami et al., 1988) was a gift from K. Fukami (University of Tokyo, Tokyo, Japan).
RNAi
We used the human PIP5KI isoforms designation, which is different from the mouse designation. siRNA oligonucleotides were performed as described previously (Padron et al., 2003). HeLa cells were transfected with the siRNA and used 48–72 h later.
Quantitative real-time PCR
RNA extracted from HeLa cells transfected with siRNA were reverse transcribed and used for PCR in a sequence detection system (Prism 7000; Applied Biosystems). Primers directed at nucleotides 414–478 (pan) and 1993–2048 (unique to PIP5KIγ90) were used (Padron et al., 2003).
PIP2 measurements
PIP2 mass was determined by a nonradioactive HPLC detection system (Nasuhoglu et al., 2002). 32P-incorporation into PIP2 was determined by labeling cells for 4 h with 32P-PO4 (NEN Life Science Products), resolving lipids by TLC, and quantitation by phosphorimager analysis (Wang et al., 2003). PM PIP2 was determined by image analysis of cells overexpressing low amounts of GFP-PLCδ-PH (Varnai and Balla, 1998), or labeling with anti-PIP2 (Laux et al., 2000; Matsuda et al., 2001). Fluorescence images were captured by confocal microscopy (model LSM5; Carl Zeiss MicroImaging, Inc.) and intensity plots were analyzed by MetaMorph Offline software (Varnai and Balla, 1998). The average fluorescence intensity of the two cell edges and between the cell edges were defined as PM and cytoplasmic PIP2, respectively, and are expressed in arbitrary units.
Immunofluorescence microscopy
For most purposes, 0.4% formaldehyde fixed cells were permeabilized with Triton X-100 and processed for confocal microscopy as described previously (Wang et al., 2003). Anti-PIP2 staining was detected by permeabilizing fixed cells with 10 μg/ml digitonin, which preserves the lipid signal better than Triton X-100.
Multistep membrane fractionation
Cells were homogenized by 25 strokes in a prechilled steel homogenizer and homogenates were centrifuged sequentially to obtain the crude organelle/membrane fractions as described previously (Wei et al., 2002). LSP is enriched for Golgi membranes and early endosomes, and HSP is enriched for lysosomes and late endosomes. The PM fraction was obtained by placing the 19,000 g pellet on top of a sucrose cushion, and collecting the membranes at the top after centrifugation at 100,000 g.
IP3 measurement
Cell monolayers incubated in Ca2+-free Hank's buffer supplemented with 0.1% BSA were stimulated with 100 μM histamine (Sigma-Aldrich) for 0–25 s at RT and the reaction was stopped with PCA. IP3 content was assayed by competition with exogenous [3H]IP3 to bind calf cerebellar microsomes (Sun et al., 1995).
Single cell Ca2+ imaging
Cells plated on glass-bottom culture dishes (Mat Tek) were loaded with fura2/AM, washed and incubated for 30 min at RT to allow de-esterification of the loaded dye. The dish was mounted on the stage of an inverted fluorescence microscope (Axiovert 200; Carl Zeiss MicroImaging, Inc.) with a 40× objective. Cells were excited at 340 and 380 nm and the change in fluorescence ratio values (F340/F380) as a function of time in individual cells within a field was recorded simultaneously. The percent of responding cells was obtained by dividing those with a Ca2+ signal to total cells recorded. The ratio of maximal F340/F380 induced by histamine to basal F340/F380 is defined as the Ca2+ peak. Ca2+ flux is defined as the slope of a line between the initiation of a persistent increase in F340/F380 and the maximal F340/F380.
Intracellular delivery of PIP2 by Shuttle PIP2
siRNA-treated cells were stimulated with 1 μM histamine in the absence of extracellular Ca2+ and ratio imaged. Histamine was washed out and cells were loaded with a mixture of 1 μM diC16-PIP2 and 1 μM of carrier 2 (Shuttle PIP2; Echelon Biosciences, Inc.) diluted in the Hank's buffer (PIP2) or buffer only (Mock; Wang et al., 2003) for 10–15 min on the microscope stage. Cells were then reexposed to 1 μM histamine and imaged again.
Online supplemental material
Table S1 illustrates the effect of PIP5KI RNAi on PIP5KI protein expression. HeLa cells transfected with siRNA for each PIP5KI was lysed and subjected to Western blotting with isoform specific antibodies. Table S2 illustrates the effect of PIP5KI RNAi on histamine induced Ca2+ transients. HeLa cells transfected with siRNA were stimulated with histamine, and Ca2+ transients were recorded on single cells loaded with fura2. Online supplemental material is available at http://www.jcb.org/cgi/content/full/jcb.200408008/DC1.
Acknowledgments
We thank D.W. Hilgemann, S. Muallem, and I. Bezprozvanny for stimulating discussions, and K.M. Lin for help with initial Ca2+ measurements.
This work is supported by National Institutes of Health GM21681 and the Robert A. Welch Foundation to H.L. Yin, the Leukemia and Lymphoma Society Career Development Fellowship to Y.J. Wang and the Welch Foundation and the American Diabetes Association Career Development Award to W.H. Li.
Abbreviations used in this paper: [Ca2+]i, intracellular Ca2+ concentration; GPCR, G protein–coupled receptor; IP3, inositol 1,4,5-trisphosphate; PIP5KIγ, type I phosphatidylinositol 4-phosphate 5-kinase γ; PIP2, phosphatidylinositol 4,5-bisphosphate; PM, plasma membrane; RNAi, RNA interference; siRNA, small interfering RNA.
References
- Audhya, A., and S.D. Emr. 2003. Regulation of PI4,5P2 synthesis by nuclear-cytoplasmic shuttling of the Mss4 lipid kinase. EMBO J. 22:4223–4236. [DOI] [PMC free article] [PubMed] [Google Scholar]
- Delmas, P., M. Crest, and D.A. Brown. 2004. Functional organization of PLC signaling microdomains in neurons. Trends Neurosci. 27:41–47. [DOI] [PubMed] [Google Scholar]
- Di Paolo, G., L. Pellegrini, K. Letinic, G. Cestra, R. Zoncu, S. Voronov, S. Chang, J. Guo, M.R. Wenk, and P. De Camilli. 2002. Recruitment and regulation of phosphatidylinositol phosphate kinase type 1 γ by the FERM domain of talin. Nature. 420:85–89. [DOI] [PubMed] [Google Scholar]
- Doughman, R.L., A.J. Firestone, and R.A. Anderson. 2003. Phosphatidylinositol phosphate kinases put PI4,5P2 in its place. J. Membr. Biol. 194:77–89. [DOI] [PubMed] [Google Scholar]
- Fukami, K., K. Matsuoka, O. Nakanishi, A. Yamakawa, S. Kawai, and T. Takenawa. 1988. Antibody to phosphatidylinositol 4,5-bisphosphate inhibits oncogene-induced mitogenesis. Proc. Natl. Acad. Sci. USA. 85:9057–9061. [DOI] [PMC free article] [PubMed] [Google Scholar]
- Hirose, K., S. Kadowaki, M. Tanabe, H. Takeshima, and M. Iino. 1999. Spatiotemporal dynamics of inositol 1,4,5-trisphosphate that underlies complex Ca2+ mobilization patterns. Science. 284:1527–1530. [DOI] [PubMed] [Google Scholar]
- Johenning, F.W., M.R. Wenk, P. Uhlen, B. DeGray, E. Lee, P. De Camilli, and B.E. Ehrlich. 2004. InsP3-mediated intracellular calcium signaling is altered by expression of synaptojanin-1. Biochem. J. 382:687–694. [DOI] [PMC free article] [PubMed] [Google Scholar]
- Koreh, K., and M.E. Monaco. 1986. The relationship of hormone-sensitive and hormone-insensitive phosphatidylinositol to phosphatidylinositol 4, 5-bisphosphate in the WRK-1 cell. J. Biol. Chem. 261:88–91. [PubMed] [Google Scholar]
- Laux, T., K. Fukami, M. Thelen, T. Golub, D. Frey, and P. Caroni. 2000. GAP43, MARCKS, and CAP23 modulate PI(4,5)P(2) at plasmalemmal rafts, and regulate cell cortex actin dynamics through a common mechanism. J. Cell Biol. 149:1455–1472. [DOI] [PMC free article] [PubMed] [Google Scholar]
- Ling, K., R.L. Doughman, A.J. Firestone, M.W. Bunce, and R.A. Anderson. 2002. Type I γ phosphatidylinositol phosphate kinase targets and regulates focal adhesions. Nature. 420:89–93. [DOI] [PubMed] [Google Scholar]
- Matsuda, M., H.F. Paterson, R. Rodriguez, A.C. Fensome, M.V. Ellis, K. Swann, and M. Katan. 2001. Real time fluorescence imaging of PLC γ translocation and its interaction with the epidermal growth factor receptor. J. Cell Biol. 153:599–612. [DOI] [PMC free article] [PubMed] [Google Scholar]
- Nakanishi, S., K.J. Catt, and T. Balla. 1995. A wortmannin-sensitive phosphatidylinositol 4-kinase that regulates hormone-sensitive pools of inositol phospholipids. Proc. Natl. Acad. Sci. USA. 92:5317–5321. [DOI] [PMC free article] [PubMed] [Google Scholar]
- Nasuhoglu, C., S. Feng, J. Mao, M. Yamamoto, H.L. Yin, S. Earnest, B. Barylko, J.P. Albanesi, and D.W. Hilgemann. 2002. Nonradioactive analysis of phosphatidylinositides and other anionic phospholipids by anion-exchange high-performance liquid chromatography with suppressed conductivity detection. Anal. Biochem. 301:243–254. [DOI] [PubMed] [Google Scholar]
- Ozaki, S., D.B. DeWald, J.C. Shope, J. Chen, and G.D. Prestwich. 2000. Intracellular delivery of phosphoinositides and inositol phosphates using polyamine carriers. Proc. Natl. Acad. Sci. USA. 97:11286–11291. [DOI] [PMC free article] [PubMed] [Google Scholar]
- Padron, D., Y.J. Wang, M. Yamamato, H.L. Yin, and M.G. Roth. 2003. Phosphatidylinositol phosphate 5-kinase Iβ recruits AP-2 to the plasma membrane and regulates rates of constitutive endocytosis. J. Cell Biol. 162:693–701. [DOI] [PMC free article] [PubMed] [Google Scholar]
- Park, S.J., T. Itoh, and T. Takenawa. 2001. Phosphatidylinositol 4-phosphate 5-kinase type I is regulated through phosphorylation response by extracellular stimuli. J. Biol. Chem. 276:4781–4787. [DOI] [PubMed] [Google Scholar]
- Pike, L.J., and L. Casey. 1996. Localization and turnover of phosphatidylinositol 4,5-bisphosphate in cavenolin-enriched membrane domains. J. Biol. Chem. 271:26453–26456. [DOI] [PubMed] [Google Scholar]
- Saito, K., K.F. Tolias, A. Saci, H.B. Koon, L.A. Humphries, A. Scharenberg, D.J. Rawlings, J.P. Kinet, and C.L. Carpenter. 2003. BTK regulates PtdIns-4,5-P2 synthesis: importance for calcium signaling and PI3K activity. Immunity. 19:669–678. [DOI] [PubMed] [Google Scholar]
- Sun, H.Q., K. Kwiatkowska, D.C. Wooten, and H.L. Yin. 1995. Effects of CapG overexpression on agonist-induced motility and second messenger generation. J. Cell Biol. 129:147–156. [DOI] [PMC free article] [PubMed] [Google Scholar]
- Tilly, B.C., L.G. Tertoolen, A.C. Lambrechts, R. Remorie, S.W. De Laat, and W.H. Moolenaar. 1990. Histamine-H1-receptor-mediated phosphoinositide hydrolysis, Ca2+ signalling and membrane-potential oscillations in human HeLa carcinoma cells. Biochem. J. 266:235–243. [DOI] [PMC free article] [PubMed] [Google Scholar]
- Varnai, P., and T. Balla. 1998. Visualization of phosphoinositides that bind pleckstrin homology domains: calcium- and agonist-induced dynamic changes and relationship to myo-[3H]inositol–labeled phosphoinositide pools. J. Cell Biol. 143:501–510. [DOI] [PMC free article] [PubMed] [Google Scholar]
- Wang, Y.J., J. Wang, H.Q. Sun, M. Martinez, Y.X. Sun, E. Macia, T. Kirchhausen, J.P. Albanesi, M.G. Roth, and H.L. Yin. 2003. Phosphatidylinositol 4 phosphate regulates targeting of clathrin adaptor AP-1 complexes to the Golgi. Cell. 114:299–310. [DOI] [PubMed] [Google Scholar]
- Watt, S.A., G. Kular, I.N. Fleming, C.P. Downes, and J.M. Lucocq. 2002. Subcellular localization of phosphatidylinositol 4,5-bisphosphate using the pleckstrin homology domain of phospholipase C delta1. Biochem. J. 363:657–666. [DOI] [PMC free article] [PubMed] [Google Scholar]
- Wei, Y.J., H.Q. Sun, M. Yamamoto, P. Wlodarski, K. Kunii, M. Martinez, B. Barylko, J.P. Albanesi, and H.L. Yin. 2002. Type II phosphatidylinositol 4-kinase β is a cytosolic and peripheral membrane protein that is recruited to the plasma membrane and activated by Rac-GTP. J. Biol. Chem. 277:46586–46593. [DOI] [PubMed] [Google Scholar]
- Wenk, M.R., L. Pellegrini, V.A. Klenchin, G. Di Paolo, S. Chang, L. Daniell, M. Arioka, T.F. Martin, and P. De Camilli. 2001. PIP kinase Iγ is the major PI(4,5)P(2) synthesizing enzyme at the synapse. Neuron. 32:79–88. [DOI] [PubMed] [Google Scholar]
- Yin, H.L., and P.A. Janmey. 2003. Phosphoinositide regulation of the actin cytoskeleton. Annu. Rev. Physiol. 65:761–789. [DOI] [PubMed] [Google Scholar]