Abstract
Cell death and survival of neural progenitor (NP) cells are determined by signals that are largely unknown. We have analyzed pro-apoptotic signaling in individual NP cells that have been derived from mouse embryonic stem cells. NP formation was concomitant with elevated apoptosis and increased expression of ceramide and prostate apoptosis response 4 (PAR-4). Morpholino oligonucleotide-mediated antisense knockdown of PAR-4 or inhibition of ceramide biosynthesis reduced stem cell apoptosis, whereas PAR-4 overexpression and treatment with ceramide analogs elevated apoptosis. Apoptotic cells also stained for proliferating cell nuclear antigen (a nuclear mitosis marker protein), but not for nestin (a marker for NP cells). In mitotic cells, asymmetric distribution of PAR-4 and nestin resulted in one nestin(−)/PAR-4(+) daughter cell, in which ceramide elevation induced apoptosis. The other cell was nestin(+), but PAR-4(−), and was not apoptotic. Asymmetric distribution of PAR-4 and simultaneous elevation of endogenous ceramide provides a possible mechanism underlying asymmetric differentiation and apoptosis of neuronal stem cells in the developing brain.
Keywords: embryonic stem cells; neuronal differentiation; neuroprogenitor; sphingolipid; nestin
Introduction
Apoptosis of neuronal stem cells is required to avoid hyperproliferation of brain tissue during embryonal mouse brain development (Blaschke et al., 1996; Sommer and Rao 2002). Consistent with this, caspase 9 and Apaf1 knockout mice show extreme forebrain malformation at gestational d E14 due to overproliferation of neural stem cells (Cecconi et al., 1998; Kuida et al., 1998). Recently, we have shown that during d E12–E16 of mouse development, brain ceramide and prostate apoptosis response 4 (PAR-4), an endogenous inhibitor of atypical PKCζ, are elevated (Bieberich et al., 2001). This is concurrent with the presence of numerous apoptotic cells in the subventricular/ventricular zone. Also, we have shown that both ceramide and PAR-4 are required to induce apoptosis in neuronal cells via down-regulation of PKCζ and MAPK-dependent cell survival pathways. Our analyses provide evidence that ceramide/PAR-4–induced apoptosis is a major mechanism of active cell death in developing mouse brain. This hypothesis is consistent with the observation that ceramide triggers cytochrome c release from mitochondria and subsequent activation of the caspase 9– and caspase 3–dependent signaling pathway for apoptosis (Hakem et al., 1998; Movsesyan et al., 2002). However, we have also found that at d E14, several pro- or anti-apoptotic stimuli are simultaneously up-regulated, indicating a complex and interdependent regulation of cell division, apoptosis, and cell survival in neural stem cells (Bieberich et al., 2001).
According to a current model, apoptosis of neuronal stem cells may occur very soon after cell division, leaving one daughter cell committed to cell death, whereas the other one may further proliferate or differentiate (Kuan et al., 2000; Sommer and Rao, 2002). This asymmetric model of apoptosis during neural differentiation implies that cell death or survival is regulated immediately on cell division of stem cells. Most recently, asymmetric distribution of the Notch inhibitor Numb to one daughter cell during mitosis of neural precursor cells has been suggested to regulate cell death in Drosophila and mammals (Orgogozo et al., 2002; Shen et al., 2002). We hypothesized that asymmetric cell death of mammalian neural progenitors (NPs) may also result from the unequal distribution of pro- or anti-apoptotic factors to the daughter cells during cell division. We tested this hypothesis by analyzing the expression of several pro- or anti-apoptotic proteins involved in ceramide-induced apoptosis of differentiating embryonic stem (ES) cells and their correlation with cell division and death.
The observation that ceramide and PAR-4 are concurrently elevated during the peak time of apoptosis in embryonic mouse brain (Bieberich et al., 2001) prompted us to determine the function of ceramide and PAR-4 in the regulation of NP cell death. Mouse ES cells have been shown to differentiate in culture into neurons and glial cells by recapitulating the stages of neuronal differentiation that occur in vivo (Fraichard et al., 1995; Mayer-Proschel et al., 1997). In particular, the formation of NP cells is a critical stage of commitment and differentiation into neuronal and glial cells. In ES cells, this stage occurs during serum deprivation on embryoid body (EB) formation, and during the expansion of EB-derived cells in serum-free medium plus fibroblast growth factor 2 (FGF-2; Hancock et al., 2000). In embryonic mouse brain, these stages probably correspond to populations of differentiating neural stem cells in the subventricular/ventricular zone between E12 and E18 (Hatten 1999). Accordingly, in vitro neural differentiation of ES cells by serum deprivation is a valid model for the functional correlation of ceramide and PAR-4 elevation with induction of apoptosis in both, in vitro differentiating ES cells and neural stem cells in embryonic mouse brain.
To define the molecular mechanisms underlying ceramide-induced apoptosis in NP cells, we have analyzed the expression levels and patterns of ceramide and PAR-4 in NP cells derived from ES cells. We have used high performance TLC (HPTLC) of lipid extracts of differentiating ES cells to measure ceramide levels during differentiation. The intracellular distribution of ceramide was detected using an antibody that has been used for specific immunostaining of ceramide in fixed cells (Grassme et al., 2001). Immunofluorescence microscopy of NP cells revealed that PAR-4, ceramide, and the intermediate filament protein nestin are asymmetrically distributed during cell division. The coexpression of PAR-4 and ceramide was concurrent with TUNEL staining for apoptosis. The other daughter cell that did not express PAR-4 was nestin positive and was not apoptotic. Thus, asymmetric distribution of PAR-4 may regulate ceramide-induced apoptosis during the proliferation and differentiation of stem cells.
Results
Ceramide expression is up-regulated during neural differentiation of ES cells
Mouse ES cells were differentiated after a serum deprivation protocol outlined in Fig. 1 A. This method yielded ES-derived cell cultures highly enriched in neural cells after 25 d in culture (Okabe et al., 1996; Hancock et al., 2000). Neuronal differentiation was verified by staining of marker proteins using immunoblotting (Fig. 1 B) and immunofluorescence microscopy (Fig. 2). ES cell differentiation was initiated by aggregating the ES cells (Fig. 2 A) to form EBs. The EBs were incubated in suspension culture in serum-containing medium for 4 d (Fig. 1 A, stages EB1–EB4). The differentiating EBs were then plated on tissue culture plates and allowed to attach in serum-containing medium for 1 d, and were then shifted to serum-free medium for three additional days of culture (Fig. 1 A and Fig. 2 A, EB5–EB8). The Oct4 protein, a marker of pluripotent stem cells (Pesce and Scholer, 2001), was detected in the EB8 stage, reflecting the presence of residual undifferentiated pluripotent stem cells within the EBs (Fig. 1 B, lane 1). No Oct4 expression was detectable after the dissociation and replating of the EBs in serum-free, FGF-2–containing medium (Fig. 1, A and B; lanes 2–4). The serum-free conditions did not support the proliferation of nonneural cell types, whereas FGF-2 supported the robust proliferation of NP cells (Fig. 1 A, stages NP1–NP4; Fig. 2 B shows NP2). The early neural precursor cell marker vimentin was only detected in EB8 and NP2 (Fig. 1 B, lane 1 and lane 2), whereas the NP marker nestin was detected at low levels at EB8 and at high levels at NP2 and D1 (Fig. 1 B, lanes 1–3; Fig. 2 B). The expansion of EBs was followed by a massive increase of the number of nestin-positive progenitor cells from ∼60% (Fig. 2 B, NP2) to >80% at NP4. Differentiation of NP cells to glial cells and neurons was initiated by withdrawal of FGF-2 from the culture medium (Fig. 1 A; stages D1–D4) and verified by staining for the glial fibrillary acidic protein (GFAP) and the neuronal marker proteins microtubuli-associated protein 2 (MAP-2) and synaptophysin (Figs. 1 B, lane 3 and lane 4; Fig. 2 C). No expression of NP markers was detected after D1 (Fig. 1 B, lane 4). Expression of GFAP was detected at D1 and D4, whereas MAP-2 and synaptophysin were only detected at D4, the most mature differentiation stage tested. It should be noted that <20% of Hoechst-stained cells showed neither GFAP nor MAP-2 staining, which verifies that the portion of nonneuronal cells within the fully differentiated culture was negligibly low (Fig. 2 C).
Figure 1.
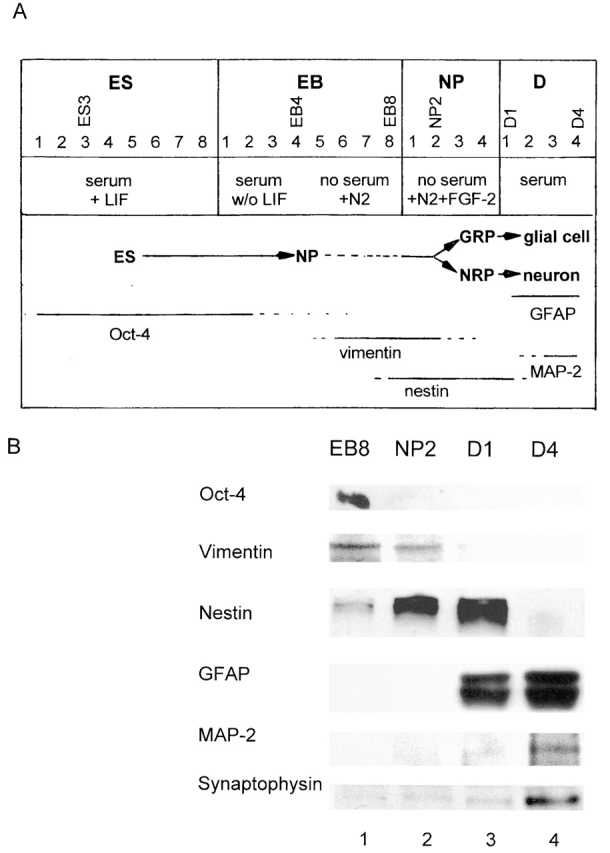
In vitro neuronal differentiation of ES cells, overview, and marker protein expression. ES, embryonic stem cell; EB, embryoid body; NP, neuronal progenitor cell; GRP, glial restricted precursor cells; NRP, neuronal restricted precursor cell (for terminology, see Mayer-Proschel et al., 1997; Wu et al., 2002). In B, immunostaining for marker proteins was performed with protein extracts from stem cells at the differentiation stages shown in A.
Figure 2.
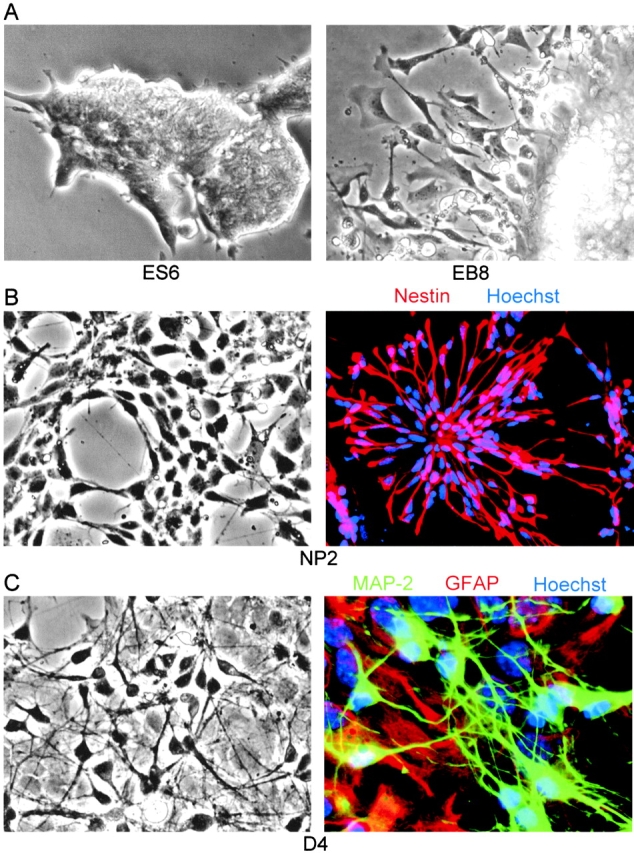
In vitro neuronal differentiation of ES cells, morphology, and histochemical characterization. (A) ES6, ES cells 2 d in feeder-free cultures; EB8, EBs after 4 d in serum-free medium; (B) NP2, NPs after 2 d in FGF-2 containing, serum-free medium; nestin (red), Hoechst (blue); (C) D4, differentiated neurons and glial cells after 4 d in serum-containing medium; MAP-2 (green), GFAP (red), Hoechst (blue). For differentiation stages, see Fig. 1A. GFAP, glial fibrillary acidic protein; MAP-2, microtubuli-associated protein 2.
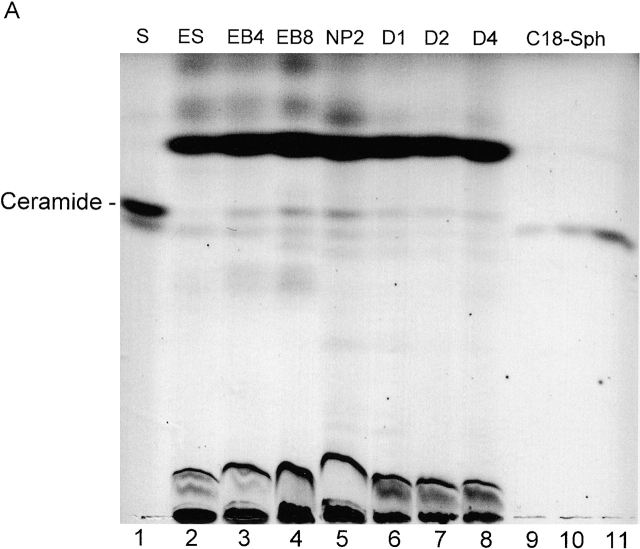
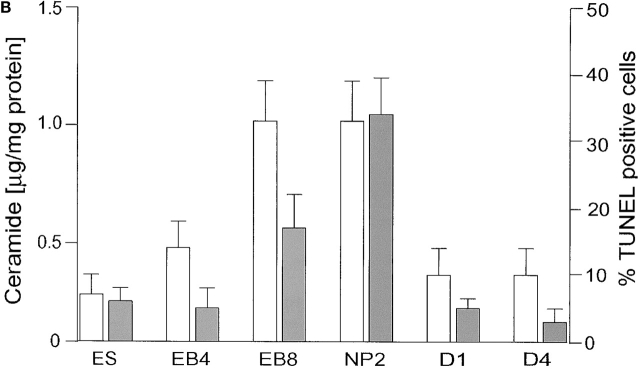
To measure ceramide levels during ES cell differentiation, 50–100 mg of cells were harvested at different time points during differentiation. Sphingolipids were isolated using organic solvent extraction. As shown in Fig. 3 (A and B), quantitative HPTLC and DAG kinase assay revealed that fibroblast-free, undifferentiated ES cells (Fig. 3 A, lane 2) contained <0.2 ± 0.1 μg ceramide/mg cell protein. After 4 d of EB formation (EB4 stage), ceramide had increased to 0.4 ± 0.1 μg ceramide/mg cell protein (Fig. 3 A, lane 3). Endogenous ceramide was further elevated to 1.0 ± 0.2 μg/mg cell protein by the EB8 stage of differentiation (Fig. 3 A, lane 4). The increased ceramide concentration was maintained through the NP2 stage of differentiation (Fig. 3 A, lane 5). In the D1 stage of differentiation, the ceramide concentration was found to be reduced by 70% (0.3 ± 0.1 μg ceramide/mg cell protein) and did not change significantly after 4 d of differentiation (Fig. 3 A; D1, D2, and D4, lanes 6, 7, and 8, respectively). Together, these results indicate that the peak elevation of ceramide occurs during the initial formation of NP cells on serum deprivation of EBs and during NP expansion in the presence of FGF-2.
Figure 3.
Ceramide content and apoptosis during in vitro neuronal differentiation of ES cells. (A) Neutral lipids were purified from differentiating ES cells and a lipid amount corresponding to 750 μg of cellular protein/lane separated by HPTLC in the running solvent CH3Cl/HOAc (9:1, vol/vol). Lipids were stained with the cupric acetate reagent. Ceramide (open bars) was quantified by densitometric analysis and comparison with known amounts of standard lipid (N-oleoyl sphingosine). Lane 1, ceramide standard from bovine brain; lane 2, fibroblast-freed ES cells, after 4 d in culture; lane 3, EBs at the EB4 stage; lane 4, EBs at the EB8 stage; lane 5, NPs at the NP2 stage; lanes 6–8, three terminal differentiation stages, 24 (D1 stage), 48 (D2 stage), and 96 h (D4 stage) on cultivation of NP cells in serum-containing medium; lanes 9–11, N-oleoyl sphingosine, 250, 500, and 1,000 ng, respectively. (B) Lipids were extracted from differentiated ES cells and the amount of ceramide quantified using the DAG kinase assay. Apoptosis (solid bars) was determined by TUNEL staining. For HPTLC, DAG kinase, and TUNEL analyses, experiments were performed with five independent ES cultures. The bars show the standard mean and deviation of percentage of TUNEL-positive cells that were counted in five areas of 200 cells in each experiment.
Apoptosis during neuroprogenitor expansion is dependent on ceramide elevation
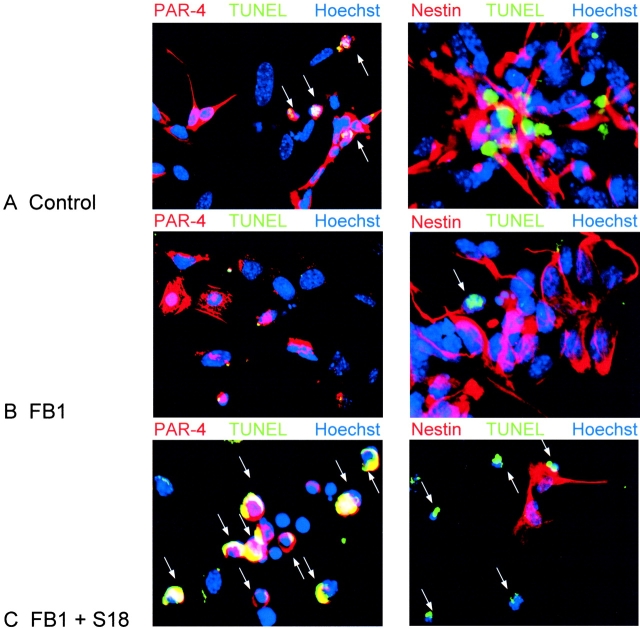
We determined the degree of apoptosis in differentiating ES cultures because we have previously proposed that ceramide elevation induces apoptosis in NP cells (Bieberich et al., 2001). As shown in Fig. 3 B, the degree of apoptosis was quantified by counting TUNEL-stained cells. Apoptosis was elevated at the EB8 stage (20 ± 5%) and was highest at the NP2 stage (35 ± 5%). The fraction of apoptotic cells rapidly decreased on induction of neural differentiation, and was already <20% at D1. Differentiated neurons at D4 did not show a significant degree of apoptosis (<10 ± 5%). These results show that the peak time of apoptosis coincided with the peak elevation of endogenous ceramide. Consistent with this, inhibition of ceramide biosynthesis by incubation with 25 μM of the ceramide synthase inhibitor fumonisin B1 (FB1) or 50 nM of the serine palmitoyltransferase (SPT) inhibitor myriocin for 48 h reduced the degree of apoptosis at the EB8 and NP2 stage by ∼50%. Fig. 4 (right) shows that at the NP2 stage, apoptosis proceeded in differentiating ES cells that did not stain for nestin (Fig. 4 A). In these cells, FB1 significantly reduced the degree of apoptosis (Fig. 4 B). Apoptosis was restored by the addition of 30 μM N-acetyl sphingosine (C2-ceramide; not depicted), 80 μM of the novel ceramide analogue N-oleoyl serinol (Fig. 4 C, S18; for review see Bieberich et al., 2001), or 1 μM of natural ceramide (not depicted) that was extracted from differentiating ES cells. Together, these results showed that elevation of endogenous ceramide was a prerequisite for the induction of apoptosis in differentiating ES cells at the NP2 stage.
Figure 4.
Alteration of neural stem cell apoptosis by inhibition of ceramide biosynthesis or incubation with ceramide analogs. (A–C) Differentiating ES cells at the NP2 stage were immunostained for PAR-4 (red, left) and nestin (red, right), apoptotic cells were TUNEL stained (green), and nuclei were counterstained with Hoechst dye (blue). A, control cells without FB1 or the novel ceramide analogue S18; B, cells incubated for 48 h with 25 μM FB1; C, cells incubated for 48 h with FB1 (ceramide depletion) followed by overnight treatment with 80 μM S18. Arrows indicate apoptotic cells.
Ceramide-induced apoptosis is dependent on PAR-4 expression in nestin-negative cells
Previously, we have reported that expression of PAR-4, an inhibitor protein of PKCζ, is the prerequisite for induction of apoptosis by incubation of differentiating ES cells with S18 or C2-ceramide (Bieberich et al., 2001). These results were confirmed by incubation of FB1-treated cells at the NP2 stage with S18, C2-ceramide, or natural ceramide that was extracted from differentiating ES cells. Fig. 4 (left) shows that apoptosis was only seen in cells that expressed PAR-4 (Fig. 4 A). S18 or ceramide incubation did not alter the number of PAR-4–positive cells, but it restored the degree of apoptosis to that found with cells that were not pretreated with FB1. S18 incubation did not alter the concentration of endogenous ceramide, indicating that ceramide elevation was not a by-product of apoptotic cells, but the cause of apoptosis. Notably, the majority of apoptotic cells (>90%) that stained for PAR-4 were nestin negative (Fig. 4).
To suppress PAR-4 expression, ES cells at the NP1 stage were transfected with a PAR-4–specific morpholino phosphorodiamidate antisense oligonucleotide (morpholino) that was designed on the basis of a previously published antisense oligonucleotide sequence (Guo et al., 1998, 2001). Morpholinos have been shown to avoid many of the pitfalls associated with conventional antisense oligonucleotides, and have been successfully used for transfection of embryos and cultured cells (Morcos, 2001). Fig. 5 A (left) shows NP cells 48 h after transfection with a standard morpholino provided as negative control. The number of TUNEL-stained cells in the negative control was equivalent to that found with untransfected cells (35%, see Fig. 3 B), indicating that the degree of apoptosis was not affected due to any unspecific effect of the morpholino. This result was consistent with the observation that the expression level of PAR-4 in untransfected and control morpholino-transfected NP cells was the same (Fig. 5 B, lane 1 and lane 2). Incubation of control morpholino-transfected NP cells with 80 μM S18 increased the number of apoptotic cells to that found with S18-treated, untransfected cells (>80%). However, transfection of NP cells with a PAR-4–specific antisense morpholino reduced S18-induced apoptosis to a level <30% (Fig. 5 A, right). Consistently, transfection with the PAR-4 antisense morpholino suppressed the expression level of PAR-4 to ∼25% of that detected in untransfected cells (Fig. 5 B, lane 3).
Figure 5.
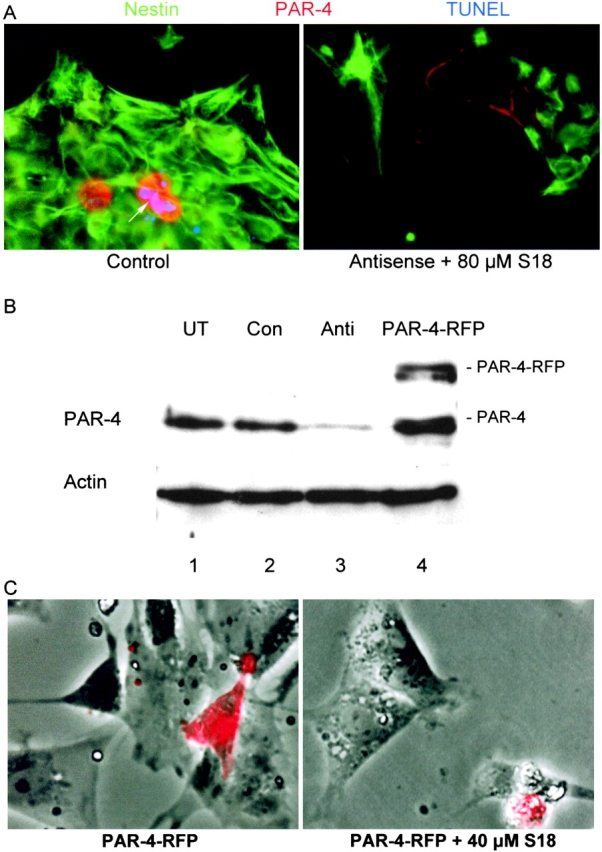
Alteration of neural stem cell apoptosis by antisense knockdown or overexpression of PAR-4. (A) Differentiating ES cells at the NP1 stage were transfected with a morpholino phosphorodiamidate antisense oligonucleotide against PAR-4, and 48 h later (NP3 stage), were incubated overnight with 80 μM S18. The figure shows PAR-4 (red), nestin (green), and TUNEL (blue) staining of cells transfected with standard control antisense oligonucleotide (left), and cells transfected with PAR-4–specific antisense oligonucleotide followed by incubation with S18 (right). (B) Staining of PAR-4 on immunoblots of protein from differentiating ES cells (NP3 stage) that were transfected with or without PAR-4–specific antisense oligonucleotide or PAR-4-RFP, respectively. Lane 1, untransfected (UT) NP cells; lane 2, NP cells transfected with standard control antisense oligonucleotide (Con); lane 3, NP cells transfected with PAR-4–specific antisense oligonucleotide (Anti); lane 4, NP cells transfected with PAR-4-RFP. (C) In differentiating ES cells at the EB8 stage, inhibition of ceramide biosynthesis was initiated by incubation with 50 nM myriocin, and was then maintained throughout the subsequent differentiation stages. After NP expansion (NP1 stage), cells were transfected with PAR-4-RFP, and 48 h later (NP3 stage), were incubated overnight with 80 μM S18 (right). The figure shows phase contrast and overlay with RFP (red) fluorescence. Arrow in A indicates apoptotic cells.
To determine the effect of elevated PAR-4 expression, we transfected myriocin-treated ES cells at the NP1 stage with PAR-4 linked to far-red–shifted red fluorescent protein (Fig. 5 B, lane 4; PAR-4-RFP). Fig. 5 C shows that PAR-4-RFP expression by itself did not induce apoptosis in the transfected cells. However, apoptosis was observed when transfected cells were incubated with 40 μM S18, a concentration at which no or only a low degree of ceramide analogue-induced apoptosis occurred in untransfected or mock (RFP)-transfected cells (unpublished data). Apoptosis was induced almost exclusively in PAR-4-RFP–expressing cells, whereas the population of cells without PAR-4-RFP remained unaffected. In summary, these results show that the expression and/or elevation of PAR-4 were the prerequisite for ceramide-induced apoptosis in differentiating ES cells.
Apoptosis is induced by simultaneous up-regulation of PAR-4 and ceramide biosynthesis
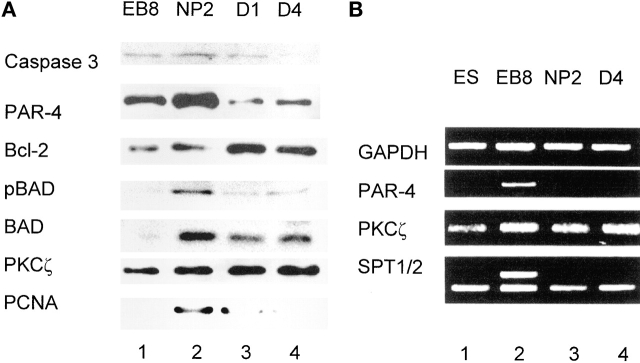
To identify the genes involved in the regulation of apoptosis in differentiating ES cells, we have determined the temporal expression pattern of pro- or anti-apoptotic proteins and ceramide biosynthesis/metabolism during EB and NP formation. Fig. 6 A shows that PAR-4 expression was significantly elevated at the EB8 and NP2 stages (Fig. 6 A, lane 1 and lane 2). By the first day of neural differentiation (D1), the PAR-4 level dropped to <20% of that at NP2 (Fig. 6 A, lane 2 and lane 3). The peak time of PAR-4 expression at the NP2 stage was concurrent with caspase 3 activation and increased proliferating cell nuclear antigen (PCNA) levels (Fig. 6 A, lane 2). PCNA is a marker for mitotic cells (Chan et al., 2002), indicating that PAR-4 elevation and caspase 3 activation is predominant at stages with a large number of proliferating stem cells. The expression of PKCζ did not change during neuronal differentiation. PKCζ activity is inhibited by ceramide-enhanced binding of PAR-4, leading to an up-regulation of the caspase 9– and caspase 3–dependent apoptotic pathway (Diaz-Meco et al., 1996; Mattson, 2000). We confirmed the participation of caspase 9 in ceramide-induced apoptosis of differentiating ES cells by the observation that preincubation with the cell-permeable caspase 9 inhibitor peptide LEHD-CHO suppressed apoptosis that was inducible with S18 or natural ceramide isolated from ES cells. Upstream regulators of caspase 3, in particular, anti-apoptotic b-cell lymphoma 2 (Bcl-2) and pro-apoptotic Bcl-2 antagonist of death (Bad) were inversely regulated, suggesting activation of caspase 3 via the mitochondrial death pathway (Fig. 6 A). However, a high degree of Bad phosphorylation was detectable at NP2 (Fig. 6 A, lane 2) indicating the presence of both apoptotic and anti-apoptotic signaling at this stage. The expression of Bad dropped and that of Bcl-2 increased during D1 and D4, consistent with lower levels of caspase 3 activation and apoptosis at these differentiation stages (Fig. 6 A, lane 3 and lane 4).
Figure 6.
Expression of differentiation markers and pro- or anti-apoptotic proteins in differentiating ES cells. (A) During in vitro neural differentiation of ES-J1 mouse ES cells, protein was extracted from the cells, separated by SDS-PAGE, and blotted onto nitrocellulose. Each lane shows the immunostaining corresponding to 35 μg cell protein. See Fig. 1 for definition of differentiation stages. The protein analysis was performed with five independent differentiation experiments. (B) RNA was isolated from differentiating ES-J1 cells (see Fig. 1 for definition of differentiation stages) and subjected to RT-PCR. SPT1/2, SPT subunit 1 and 2. Each experiment was repeated four times.
We also analyzed the gene expression of PAR-4, PKCζ, and SPT that catalyzes the initial reaction of ceramide biosynthesis using RT-PCR. The highest level of PAR-4 mRNA was found at the EB8 stage (Fig. 6 B, lane 2). Interestingly, the level of PAR-4 mRNA drops within 48 h from EB8 to NP2 (Fig. 6 B, lane 2 and lane 3), although the NP2 stage shows the highest concentration of PAR-4 protein (Fig. 6 A, lane 2). The transcription of PKCζ appears not to be modulated during neuronal differentiation, which is consistent with the unchanged level of protein expression. There is a more than 10-fold increase in gene expression of SPT subunit 1 (SPT1) at the EB8 stage, whereas the transcription of the SPT subunit 2 (SPT2) mRNA remains unchanged at all differentiation stages from EB8 to D4 (Fig. 6 B, lanes 2–4). Up-regulation of SPT1 gene expression is consistent with elevated ceramide biosynthesis at EB8 and NP2 because SPT1 activates SPT2 (Hanada et al., 1998). Together, our results show that apoptosis of differentiating ES cells at the NP2 stage is most likely induced by up-regulation of ceramide biosynthesis and elevation of PAR-4 expression.
Asymmetric distribution of PAR-4 and nestin during mitosis of neuronal stem cells
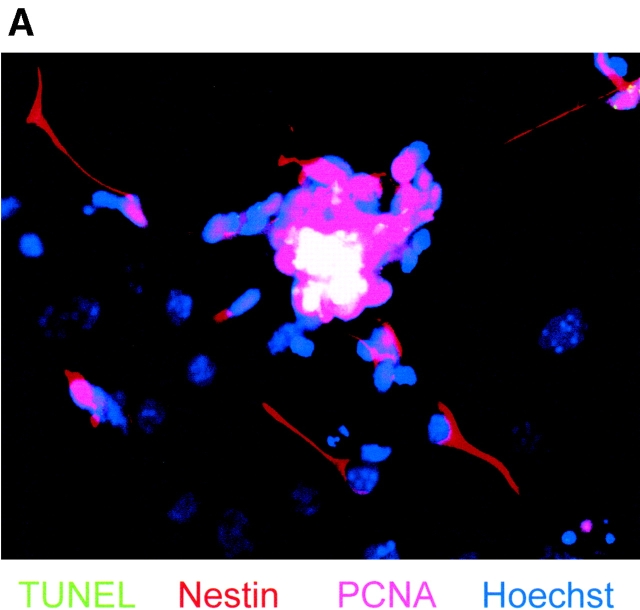
The apparent paradoxical elevation of both the proliferation marker PCNA and the pro-apoptotic, active caspase 3 at the EB8 and NP2 stages of ES cell differentiation prompted us to examine the patterns of mitosis and apoptosis in individual cells by immunofluorescence microscopy for mitosis/apoptosis markers and BrdU labeling. We also analyzed whether mitosis or apoptosis is predominant in NP cells by immunofluorescence staining for nestin. As shown in Table I and Fig. 7 A, simultaneous staining by TUNEL assay (green) and antibodies against nestin (red) and PCNA (far-red, pseudo-colored in pink) revealed that the major portion (92%) of TUNEL-positive cells were nestin negative (see also Fig. 4). Most of the TUNEL-positive cells (75%) expressed PCNA as well (overlay yields white-colored cells in Fig. 7 A), indicating that apoptosis followed immediately after mitosis or during the attempt to enter the next mitotic cycle. However, no TUNEL signal was detected if cells coexpressed PCNA and nestin. These observations prompted us to look specifically for the distribution of pro-apoptotic signals in proliferating cells, in particular for the expression of PAR-4 and ceramide. In double-staining experiments for TUNEL and one additional marker, ceramide or PAR-4 is expressed in TUNEL-positive as well as TUNEL-negative cells (Table I). The majority of the TUNEL-positive cells expressed PAR-4 (94%), ceramide (98%), or PCNA (75%), whereas TUNEL-negative cells showed a lower frequency for PAR-4 (27%), ceramide (34%), or PCNA (45%) expression (Table I). In double-staining experiments for two markers, PAR-4 and ceramide are independently distributed (31% observed vs. 24% expected frequency for the expression of both ceramide and PAR-4) within the total cell population. However, in triple-staining experiments, 97% of the TUNEL-positive cells show PAR-4 and ceramide expression, whereas less than 2% of the TUNEL-negative cells are stained for PAR-4 as well as ceramide. Together, these results indicate that the expression of both PAR-4 and ceramide is required to induce apoptosis in proliferating (PCNA positive) stem cells or NP cells. This assumption was also supported by immunostaining for BrdU incorporation in apoptotic cells. Fig. 7 B shows that in differentiating ES cells at the NP2 stage, apoptosis is observed in 70% of cells within 5 h after BrdU labeling. Hence, in differentiating ES cells at the NP stage, apoptosis (activation of caspase 3) rapidly follows mitosis (BrdU incorporation).
Table I. Correlation of apoptosis and ceramide or marker protein expression during neuroprogenitor formation (NP2 stage).
|
|
TUNEL+ 63 ± 4 |
TUNEL+
|
TUNEL− 137 ± 11 |
TUNEL−
|
Total 200 |
Total
|
|---|---|---|---|---|---|---|
| % | % | % | ||||
| PAR-4 | 59 ± 6 | 94 | 31 ± 3 | 27 | 90 ± 9 | 45 |
| Nestin | 5 ± 2 | 8 | 107 ± 6 | 78 | 112 ± 10 | 56 |
| PCNA | 47 ± 5 | 75 | 61 ± 5 | 45 | 108 ± 9 | 54 |
| Ceramide | 61 ± 6 | 98 | 46 ± 4 | 34 | 107 ± 9 | 54 |
Differentiating ES cells were grown on coverslips and fixed at the NP2 stage. TUNEL staining (green fluorescence) was followed by indirect immunofluorescence staining using secondary antibodies that were linked to Cy3/Alexa® 546 (red fluorescence) or Cy5 (far-red). For species of primary antibodies, see Materials and methods. Hoechst staining was used for the identification of individual cells. The number of cells (total cell count of 200 in five independent areas) that were TUNEL positive (average of 63 ± 4) or negative (average of 137 ± 11) and stained for another marker, as indicated, is shown.
Figure 7.
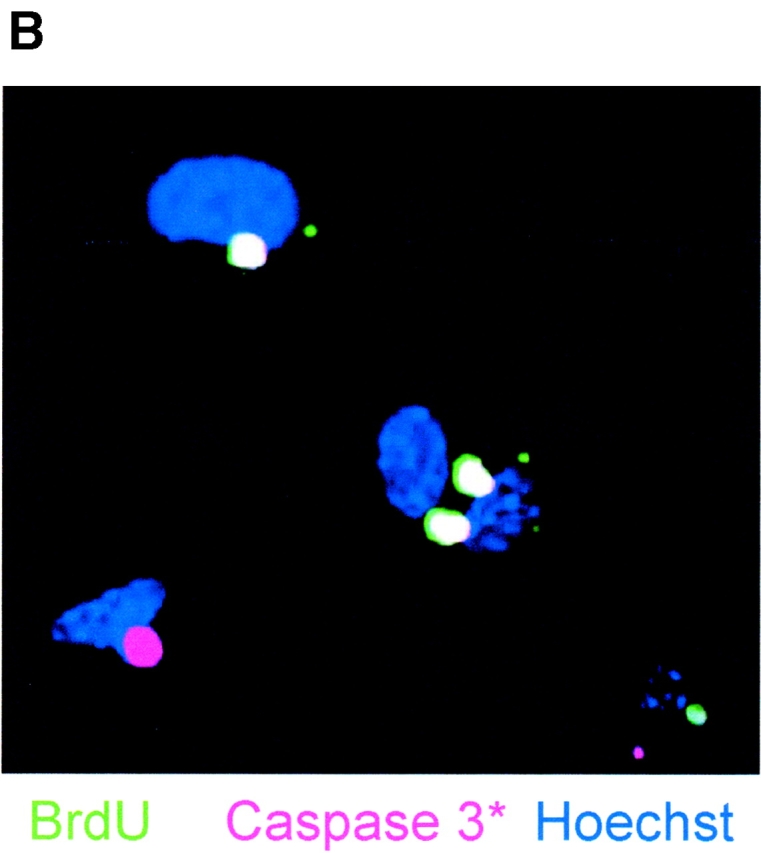
Apoptosis of differentiating ES-J1 ES cells at the NP2 stage of differentiation. Multiple, indirect immunofluorescence staining of differentiating ES-J1 cells 48 h on replating of EB8 cells (NP2 stage). (A) Nestin, (Cy3, red); PCNA, (Cy5, far-red, pseudo-colored as pink); TUNEL, FITC (green); Hoechst (blue). White color shows PCNA- and TUNEL-stained (apoptotic) cells. Pink staining shows cells that are PCNA-positive, but not apoptotic. (B) Cells at the NP2 stage were pulse labeled for 3 h with BrdU, followed by fixation and immunostaining for BrdU (green), activated caspase 3 (Cy5, pseudo-colored as pink), and Hoechst (blue) 5 h after labeling. White staining shows TUNEL- and active caspase 3–stained cells. Pink staining shows only activated caspase 3–positive cells.
The results from ceramide and PAR-4 double-immunostaining experiments suggested that either ceramide or PAR-4 was sequestered to only one daughter cell during cell division. We identified mitotic cells in anaphase (mitosis stage VII) and telophase (mitosis stage VIII) by the polarized orientation of nuclei on fixation and staining with Hoechst dye, a useful marker for the identification of different mitotic stages (Leblond and El-Alfy, 1998). 10 out of 5,000 cells were found to be in mitosis stage VII or VIII. Ceramide (Fig. 8, green) was homogenously distributed to the two daughter cells, whereas PAR-4 (Fig. 8, red) was sequestered to only one daughter cell (Fig. 8 B). The daughter cells with elevated PAR-4 appeared apoptotic, as PAR-4 colocalized with ceramide in membrane blebs that are typical for apoptosis (Fig. 8, D–D′′). Ceramide-induced apoptosis in PAR-4–positive cells was executed by the caspase 9-to-caspase 3 cascade as shown by coimmunostaining of elevated PAR-4 and cleaved caspase 3 in TUNEL–positive cells (Fig. 8, E and E′).
Figure 8.
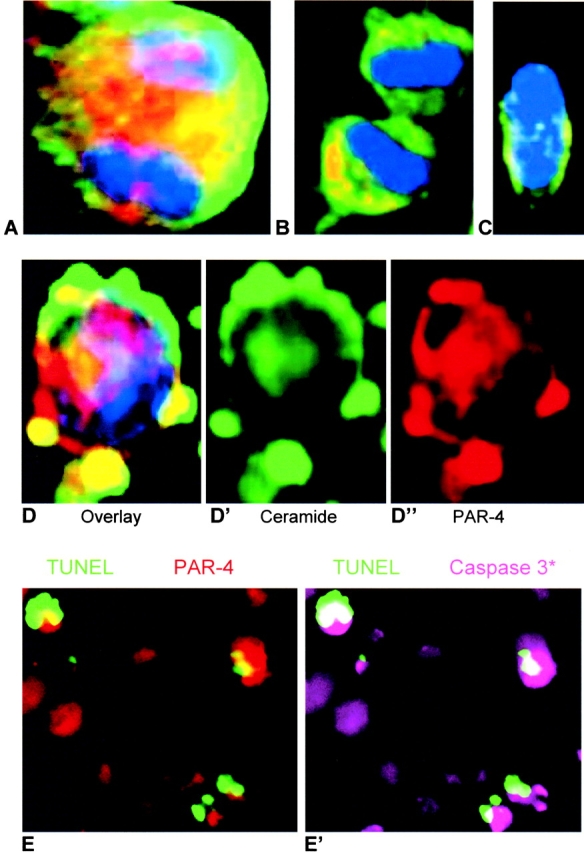
Distribution of ceramide and PAR-4 during cell division of ES-J1 ES cells at the NP2 stage of differentiation and caspase 3 activation. Multiple, indirect immunofluorescence staining of differentiating ES-J1 cells 48 h after replating of EB8 cells (NP2 stage). Ceramide, FITC (green); PAR-4, (Alexa® 546, red); Hoechst (blue). A, mitotic cell in anaphase; B, mitotic cell in telophase; C, nonapoptotic cell; D–D′′, apoptotic cell. Leftmost picture (D) shows overlay of ceramide (D′), PAR-4 (D′′), and Hoechst staining; E, overlays of TUNEL (green) and PAR-4 (red) staining or E′, TUNEL (green) and activated caspase 3 (Cy5, pseudo-colored as pink) staining.
The lack of nestin expression in PAR-4–positive cells suggested that nestin and PAR-4 were sequestered asymmetrically to the daughters of dividing NP cells. Fig. 9 shows that immunostaining for nestin (green) and PAR-4 (red) was indeed asymmetrically distributed in mitosis stage VIII cells (Fig. 9 A). The PAR-4–positive (but nestin-negative) cells underwent apoptosis (top right), whereas the nestin-positive cells were nonapoptotic and expressed either none or significantly less PAR-4 than nestin-negative cells. The absence of nestin staining in apoptotic cells (Fig. 9 B, arrows) is consistent with the results shown in Table II and Fig. 4, Fig. 5, and Fig. 7. These data are also consistent with the low number of cells (6%) that costained for PAR-4 and nestin (Table II). In cases where residual PAR-4 was present in nestin-positive daughter cells, the PAR-4 and nestin were clearly separated (Fig. 9 B). Together, these observations suggest that PAR-4 is partitioned specifically into nestin-negative daughter cells.
Figure 9.
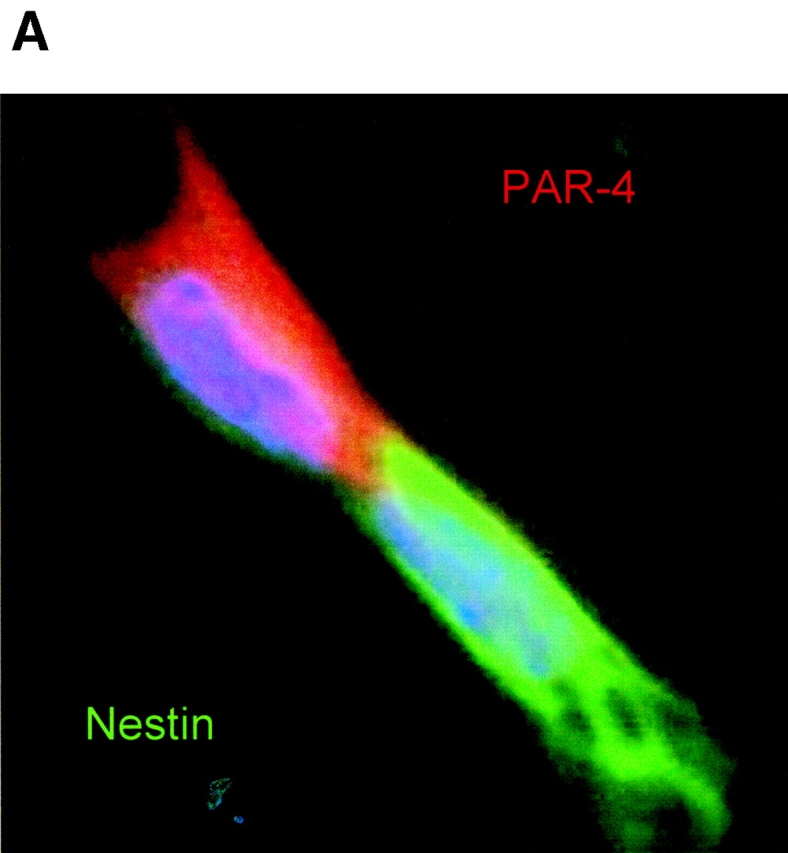
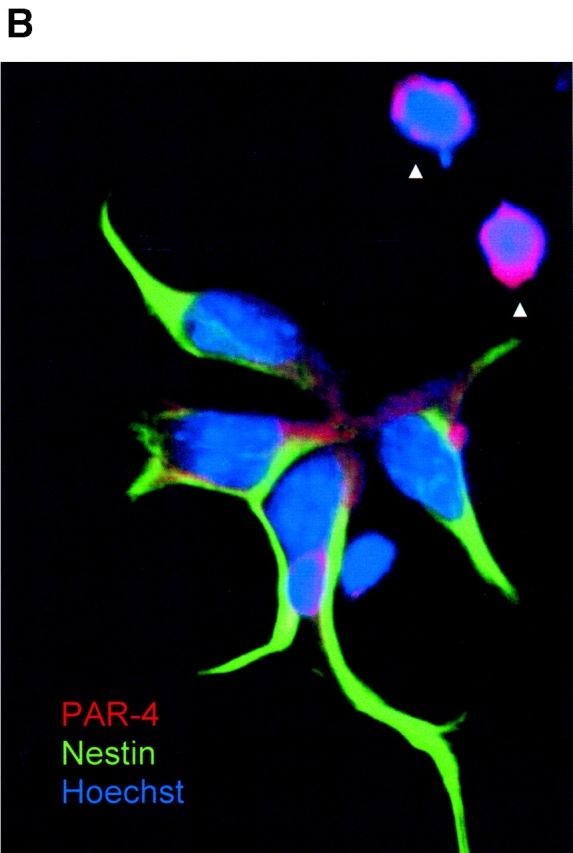
Distribution of PAR-4 and nestin during cell division of ES-J1 ES cells at NP2 stage of differentiation. Multiple, indirect immunofluorescence staining of differentiating ES-J1 cells 48 h on replating of EB8 cells (NP2 stage). PAR-4, (Alexa® 546, red); nestin, (Alexa® 488, green); Hoechst (blue). (A) Mitotic cell in anaphase/telophase, overlay of PAR-4, nestin, and Hoechst staining. Note the strict asymmetric distribution of PAR-4 and nestin. (B) Cluster of neuroprogenitor cells, overlay of PAR-4, nestin, and Hoechst staining. Arrowheads indicate two apoptotic PAR-4–positive cells that did not show any expression of nestin.
Table II. Distribution of marker proteins or ceramide during neuroprogenitor formation (NP2 stage).
| Marker | Counts | Percentage of total counts (n = 200) | Percent expected if independently distributed | ||
|---|---|---|---|---|---|
| A | B | A + B | f(A + B) = f(A) × f(B) | ||
| PAR-4 + Nestin | 12 ± 4 | 6% | 25% | ||
| PAR-4 + Ceramide | 62 ± 7 | 31% | 24% | ||
| PAR-4 + Nestin | 50 ± 7 | 25% | 30% | ||
Differentiating ES cells were grown on coverslips and treated as described in the legend for Table I. Table II shows double-staining experiments for two markers as indicated (A + B represents cells that are double-stained for A and B). The percentage of cells in the last column has been calculated from the frequency of each marker (A or B) in the total population of cells as described in the “Statistical Analysis” section of Materials and methods. Standard means and variation for five areas with 200 cells from three independent experiments is shown.
Discussion
Our results show that NP cells containing high levels of both ceramide and PAR-4 undergo apoptosis at high frequency. Several lines of evidence show that this elevation is the cause rather than the effect of apoptosis. Inhibition of ceramide biosynthesis with FB1 or myriocin reduces the degree of apoptosis, which can be restored by the addition of natural ceramide or ceramide analogs. Restoration of apoptosis is not accompanied by elevation of endogenous ceramide, ruling out a significant degree of ceramide formation by hydrolysis of ceramide derivatives in dying cells. However, elevation of endogenous ceramide, as well as the addition of natural ceramide or ceramide analogs, restores apoptosis only in cells with high expression of PAR-4. This is clearly shown with NP cells that were transfected with an anti-PAR-4-morpholino oligonucleotide or PAR-4-RFP cDNA before incubation with ceramide analogs. Antisense knock-down of PAR-4 eliminates S18-inducible apoptosis even at high concentration of the ceramide analogue, whereas overexpression results in apoptosis at low concentration of S18, but only in PAR-4-RFP–expressing cells. Thus, these experiments support the main hypothesis that both elevation of PAR-4 and ceramide are necessary to induce apoptosis.
In cultures of NP cells derived from ES cells, we found that the expression of PAR-4 and nestin is largely segregated to two separate populations of progenitors. Nestin(+)/PAR-4(−) cells are far less prone to apoptosis induced by high levels of intracellular ceramide, whereas cells undergoing apoptosis are almost always nestin(−)/PAR-4(+). The expression of high levels of PAR-4 in an apoptotic subpopulation is consistent with previous reports demonstrating that overexpression of PAR-4 reduces WT1- or nuclear factor kappa B (NFκB)–mediated Bcl-2 expression, thus suppressing the cells' self-defense mechanism against ceramide-induced apoptosis (Camandola and Mattson, 2000; Cheema et al., 2003). The critical role of NFκB for cell survival has been shown by the observation that central neuron survival relies on the constitutive activity of NFκB (Bhakar et al., 2002). It has also been shown that elevation of PAR-4 underlies neuronal cell death in several neurodegenerative diseases (Guo et al., 1998; Xie et al., 2001). To our surprise, in cells that express both PAR-4 and nestin, the two proteins are strictly sequestered to different parts of the cell. This sequestration occurs already during mitotic cell division of the parental cells, resulting in one daughter cell that is predominantly nestin-positive, while the other one contains mainly PAR-4, but no (or only low) amounts of nestin. This reveals a novel localization of a pro-apoptotic signal to one of the daughter cells resulting from stem or NP cell division. The asymmetric distribution of PAR-4 in the nestin-negative daughter cells may be a mechanism to regulate the number of differentiating cells produced from mitotically active progenitor/stem cells. At present, it cannot be decided whether the asymmetric distribution results from asymmetric inheritance of nestin and PAR-4 that have already expressed before cell division, or whether it arises from a distinct gene expression in each daughter cell during cell division.
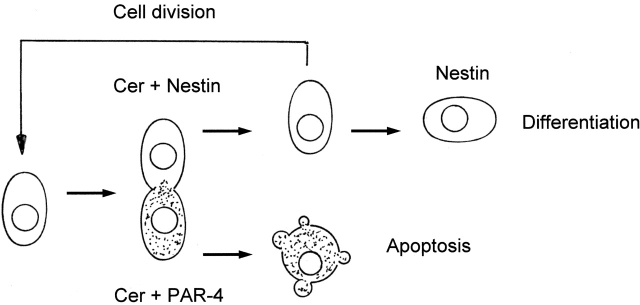
Based on these observations, we suggest a model for asymmetric cell division, apoptosis, and differentiation of neuronal stem cells, shown in Fig. 10. Differentiating stem cells up-regulate the expression of nestin, ceramide, and PAR-4 before or during cell division. Ceramide and PAR-4 elevation at these stages is most likely caused by up-regulation of gene expression for PAR-4 and SPT subunit 1 (SPT1) in EB8. This indicates regulation of de novo ceramide biosynthesis and PKCζ activity by the respective regulatory proteins, but not by basal enzyme activities. During mitosis, ceramide is evenly sequestered to the two daughter cells, whereas PAR-4 and nestin are asymmetrically distributed. The nestin(−)/PAR-4(+) daughter cell undergoes ceramide-induced apoptosis, whereas the nestin(+)/PAR-4(−) daughter cell may again divide or further differentiate into a neuronal or glial precursor cell. At this point, rapid passage of the mitotic cycle is desirable in order to sequester PAR-4 to one daughter cell and to avoid abortive mitosis before accomplishment of cell division (Liu and Greene, 2001).
Figure 10.
A model for asymmetric apoptosis of NP daughter cells due to the asymmetric distribution of nestin and PAR-4 proteins. Before mitosis or during S-phase, NP cells up-regulate the expression of nestin, PAR-4, and ceramide. During cell division, ceramide is distributed equally to the daughter cells, whereas PAR-4 and nestin are restricted to different daughter cells. The daughter cell with simultaneous presence of PAR-4 and ceramide will die due to apoptosis, whereas the one containing ceramide and nestin will again divide or differentiate. Conversion of ceramide to sphingomyelin and/or glycosphingolipids due to up-regulation of sphingomyelin or glucosyl- or galactosylceramide biosynthesis protects this cell from apoptosis on further cell division or differentiation.
There is growing evidence that elevation of ceramide is a major regulatory factor for induction of apoptosis during in vitro differentiation of neuronal cells (Herget et al., 2000; Bieberich et al., 2001; Toman et al., 2002). During ongoing differentiation, ceramide may be converted into glycosphingolipids and/or sphingomyelin, thereby protecting the neuroprogenitor cells from further ceramide accumulation. Most recently, we have found that the biosynthesis of complex gangliosides from simple glycosphingolipids activates the IGF-1-to-MAPK cell survival pathway (Bieberich et al., 2001). Further, we have suggested that this biosynthesis is concurrent with migration of NP cells from the ventricular to the intermediate zone of embryonic mouse brain. Thus, it is very likely that sphingolipid-dependent apoptosis of neuronal stem cells in the ventricular zone and cell survival in the intermediate zone is regulated by a two-step mechanism. Ceramide-induced apoptosis of subventricular stem cells relies on the simultaneous expression of ceramide and PAR-4 and its asymmetric distribution during mitotic cell division. Only the PAR-4(+) daughter cells will undergo ceramide-induced apoptosis and make room for nestin(+)/PAR-4(−) NP cells. In the second step, ceramide is converted to ceramide-1-phosphate, glycosphingolipids, and/or sphingomyelin, thus protecting progenitor cells from further ceramide accumulation. The simultaneous elevation of ceramide and PAR-4, and subsequent apoptosis in nestin(−) cells may thus be a mechanism to select for nestin(+) neuronal progenitors, or may be a mechanism to eliminate young post-mitotic neurons via expression of high levels of PAR-4 and ceramide. In future experiments, we will determine which endogenous and exogenous signals orchestrate sphingolipid biosynthesis and the expression/asymmetric distribution of PAR-4 and nestin during neural differentiation of stem cells in vitro and embryonic mouse brain in vivo.
Materials and methods
Materials
ES-J1 and feeder fibroblasts were obtained from the ES core facility, Medical College of Georgia. Knockout DME, neurobasal, knockout serum replacement, ES-qualified FBS, N2 supplement, and FGF-2 were from Invitrogen. DME/Ham's F-12 50/50 mix was purchased from Cellgro, and ESGRO leukemia inhibitory factor (LIF) was from CHEMICON International. Nonenzymatic cell dissociation solution, diacylglycerol kinase from Escherichia coli, FB1, myriocin, BrdU, ceramide standard, Hoechst 33258, polyclonal anti-PKCζ rabbit IgG, polyclonal anti-GFAP rabbit IgG, polyclonal anti-vimentin goat IgG, monoclonal anti-MAP2a/b mouse IgG, and goat anti–rabbit IgG HRP conjugate were obtained from Sigma-Aldrich. Polyclonal anti-Oct4 rabbit IgG, polyclonal anti-PAR-4 rabbit IgG, polyclonal anti-PAR-4 goat IgG, monoclonal anti-PAR-4 mouse IgG, polyclonal anti-caspase 3 rabbit IgG, polyclonal anti-synaptophysin rabbit IgG, polyclonal anti-BrdU sheep IgG, and polyclonal anti-PCNA rabbit IgG were from Santa Cruz Biotechnology, Inc. Polyclonal anti-cleaved caspase 3 rabbit IgG, monoclonal anti-Bcl-2 mouse IgG, and monoclonal anti-phospho Bcl-2 antagonist of death mouse IgG were purchased from Cell Signaling. Anti-nestin mouse monoclonal IgG (clone Rat 401) was from BD Biosciences, and monoclonal anti-ceramide mouse IgM (clone 15B4) was from Alexis. Goat anti–rabbit IgG Alexa® 488 conjugate and goat anti–mouse IgG Alexa® 546 conjugate were obtained from Molecular Probes, Inc. Goat anti–rabbit IgG Cy5 conjugate, donkey anti–rabbit IgG Cy3 conjugate, donkey anti–mouse IgM Cy3 conjugate, donkey anti–sheep IgG Cy2 conjugate, and goat anti–mouse IgG HRP conjugate were purchased from Jackson ImmunoResearch Laboratories. Goat anti–mouse IgM FITC conjugate was from ICN Biomedicals. The cell-permeable caspase 9 inhibitor peptide LEHD-CHO was from Calbiochem. HPTLC plates were purchased from Merck. All reagents were of analytical grade or higher, and solvents were freshly redistilled before use.
In vitro neuronal differentiation of ES cells
In vitro neuronal differentiation of mouse ES cells (ES-J1, ES-D3) followed a serum deprivation protocol (Okabe et al., 1996; Hancock et al., 2000). In brief, ES cells were grown on γ-irradiated feeder fibroblasts for 4 d in knockout DME/15% knockout serum replacement, supplemented with ESGRO (LIF). ES cells were then passaged onto gelatin-coated tissue culture dishes without feeder fibroblasts and incubated for 4 d in knockout DME/15% heat-inactivated ES-qualified FBS, supplemented with 1,000 U/ml ESGRO (LIF). On trypsinization, ES cells were transferred to bacterial culture dishes without gelatin in order to allow EB formation. EBs were incubated for 4 d in knockout DME/10% heat-inactivated ES-qualified FBS. We refer to this stage as EB4. On the fifth day, floating and loosely attached EBs were rinsed off, transferred to tissue culture dishes, and incubated overnight in knockout DME, 10% heat-inactivated ES-qualified FBS to the allow the EBs to attach to the dish. Neuronal differentiation due to serum deprivation was induced by cultivation for 3 d in DME/Ham's F12 (50/50), 1× N2 supplement. We refer to this stage as EB8. Serum-deprived EBs were then trypsinized or treated with a nonenzymatic cell dissociation solution, plated on poly-l-ornithine/laminin–coated tissue culture dishes and grown for 4 d in DME/Ham's F12 (50/50), supplemented with 1× N2 and 10 ng/ml FGF-2. We refer to this incubation period as the neuroprogenitor (NP) stage due to the selective expansion of NP cells in the FGF-2 containing serum-free medium. We refer to NP cells grown for 48 h after replating of trypsinized EBs as the NP2 stage. On the fifth day of NP formation, the medium is changed to neurobasal, 5% heat-inactivated FBS, and cells are incubated for another 7 d. During this time, NP cells become fully differentiated to glial cells and neurons. We refer to 24 or 96 h of differentiation as the D1 or D4 stages, respectively (see Fig. 1 for diagram of differentiation protocol).
Ceramide analysis and preparation of ceramide-containing medium
The extraction and quantitative determination of ceramide by HPTLC followed a standard protocol as described previously (Bieberich et al., 2001). Lipids were stained with 3% cupric acetate in 8% phosphoric acid for quantification by comparison with various amounts of standard lipids. For quantitative determination of ceramide using the DAG kinase assay according to Signorelli and Hannun (2002). For incubation of FB1- or myriocin-treated (ceramide-depleted) differentiating ES cells with natural ceramide, 50 mg EBs or NP cells were resuspended in 500 μl of water, and after phase separation with 500 μl of CHCl3/CH3OH (1:1, vol/vol), the neutral lipids recovered from the lower phase. The neutral lipids were evaporated to dryness with a gentle stream of nitrogen and were redissolved in 1 ml CHCl3. The solution was applied to a 0.5-g silicic acid gel column, and fatty acids and cholesterol were washed out with another 15 ml CHCl3 (Dasgupta and Hogan, 2001). The ceramide fraction was then eluted with 20 ml of CHCl3/acetone (9:1, vol/vol), evaporated to dryness, and the residue (∼6 nmol of ceramide) dissolved in 20 μl ethanol containing 2% dodecane (vol/vol). 5-μl aliquots were mixed with 1 ml medium yielding a final concentration of 1.5 μM natural ceramide for induction of apoptosis (Ji et al., 1995).
BrdU labeling, immunofluorescence microscopy, and TUNEL assay
Differentiating ES cells at the EB8 stage were dissociated and grown for 24 h on laminin/ornithin-coated coverslips (NP1 stage) in DME/Ham's F12 (50/50), supplemented with 1× N2 and 20 ng/ml FGF-2. Cells were incubated for 3 h with 10 μM BrdU, and the TUNEL assay or immunostainings were performed after 5 h of incubation. For immunostaining, cells were fixed with 4% PFA in PBS. Fixed cells were permeabilized with 0.2% Triton X-100 in PBS for 5 min at RT, and immunostaining was performed as described previously (Bieberich et al., 2001). The nuclei were stained by treatment with 2 μg/ml Hoechst 33258 in PBS for 30 min at RT. Apoptotic nuclei were stained using the fluorescein FragEL™ TUNEL assay according to instructions of the manufacturer (Oncogene Research Products).
Statistical analysis
Antigen-specific immunostaining was quantified by counting cells that showed signals twofold or more above background fluorescence. Cell counts were performed in five areas of ∼200 cells that were obtained from three independent immunostaining reactions. A Chi-square test with one degree of freedom was applied for the statistical analysis of the distribution of two immunostained antigens. The first null hypothesis (H0 1) to be refuted was that the two antigens were independently distributed within the total cell population (mean of 200 cells in five counts). The expected frequency for double staining was the frequency product for immunostaining of A or B in the total population, f(A and B) = f(A) × f(B). The second null hypothesis (H0 2) to be refuted was that the frequency of antigen B in the subpopulation A was identical to its frequency in the total population, f(B in A) = f(B in A + B).
RNA preparation and RT-PCR
Total RNA was prepared from differentiating stem cells using the TRIzol® method according to the manufacturer's protocol (Life Technologies). An aliquot (0.6–1.0 μg RNA) was used for RT-PCR with the ThermoScriptTM RT-PCR system following the supplier's instructions (Invitrogen). PCR was performed by applying 35 cycles with various amounts of first-strand cDNA template (equivalent to 0.05–0.2 μg of RNA) and 20 pmol of sense and antisense oligonucleotide primer. The following oligonucleotide primer sequences and annealing temperatures were used: PAR-4 (sense, 5′-ccagcgccaggaaaggcaaag-3′; antisense, 5′-ctaccttgtcagctgcccaacaac-3′; 61°C), PKCζ (sense, 5′-agccacgccgtttggaaagg-3′; antisense, 5′-acactttattcctcagggcattacacg-3′; 58°C), SPT1 (sense, 5′-gctaacatggagaatgcactc-3′; antisense, 5′-cttcctccgtctgctccac-3′; 53°C), and GAPDH (sense, 5′-gaaggtgaaggtcggagtcaacg-3′; antisense, 5′-ggtgatgggatttccattgatgacaagc-3′; 58°C). The amount of template from each sample was adjusted until PCR yielded equal intensities of amplification for GAPDH.
Construction of PAR-4-RFP cDNA and transfection of EB-derived cells
For construction of PAR-4-RFP cDNA, RT-PCR was performed with the oligonucleotide primer pair sense 5′-atggcgaccggcggctatcg-3′ and antisense 5′-ctaccttgtcagctgcccaacaac-3′ using the first-strand cDNA generated from EBs (EB8 stage) as template for the amplification reaction. The primers were endowed with the restriction enzyme cleaving sites Eco47III (sense) and SalI (antisense) for ligation of the PAR-4–specific amplification product into the multiple cloning site of HcRFP, a vector that encodes a far-red–shifted variant of red fluorescent protein (CLONTECH Laboratories, Inc.). Differentiating ES cells at the NP1 stage were transfected with the PAR-4-RFP construct using the LipofectAMINE™ 2000 procedure according to the manufacturer's instructions (Invitrogen). The transfected cells were incubated in DME/Ham's F12 (50/50), supplemented with 1× N2 and 20 ng/ml FGF-2, and the TUNEL assay or immunostainings were performed after 48 h of incubation and NP formation. For depletion of ceramide, differentiating ES cell were incubated with 25 μM FB1 or 50 nM myriocin 48 h before transfection with the PAR-4-RFP vector, and the inhibitor was maintained in the medium throughout the post-transfection period. For induction of apoptosis, the novel ceramide analogue S18 (40–100 μM), N-acetyl sphingosine (C2-ceramide; 10–30 μM), or natural ceramide isolated from EBs (0.5–1.5 μM, for preparation see section on ceramide analysis) was added 48 h after transfection with the PAR-4-RFP cDNA, and the degree of apoptosis was quantified after 15–20 h using TUNEL assays with PFA-fixed cells as described in the section on BrdU labeling.
Morpholino antisense knockdown of endogenous PAR-4
Endogenous expression of PAR-4 was suppressed by transfection of differentiating ES cells at the NP1 stage with 2 nmol (per well in 24-well plates) of the morpholino-based antisense oligonucleotide 5′-cgatagccgccggtcgccatgttcc-3′ (for sequence see Guo et al., 1998, 2001) following the instructions of the manufacturer (GeneTools) in 0.5 ml serum-free DME/Ham's F-12 and 1× N2 supplemented with 20 ng/ml FGF-2. For induction of apoptosis, the novel ceramide analogue S18 (40–100 μM), N-acetyl sphingosine (C2-ceramide; 10–30 μM), or natural ceramide isolated from EBs (0.5–1.5 μM, for preparation see section on ceramide analysis) was added 48 h after transfection with the anti-PAR-4 morpholino, and the degree of apoptosis was quantified after 15–20 h using TUNEL assays with PFA-fixed cells as described in the section on BrdU labeling.
Protein isolation and immunoblotting
The amount of protein was determined after a modified Folin phenol reagent (Lowry) assay as described previously (Wang and Smith, 1975). Protein extracted with detergent was precipitated according to the Wessel and Fluegge method (Wessel and Flugge, 1984). SDS-PAGE was performed using the Laemmli method followed by immunoblotting as described previously (Laemmli, 1970).
Acknowledgments
We wish to thank Dr. Nancy Manley for critically reading the manuscript, and Dr. Somsankar Dasgupta for his assistance with the preparation and analysis of ceramide. The authors are also grateful to Dr. Robert K. Yu for his ongoing institutional support. The authors thank the staff of the ES cell and imaging core facility at the Medical College of Georgia for technical support.
This work was supported by National Institutes of Health grants MH064794 (to B.G. Condie) and MH61934-04 (to E. Bieberich).
Abbreviations used in this paper: Bcl-2, b-cell lymphoma 2; EB, embryoid body; ES, embryonic stem; FB1, fumonisin B1; FGF-2, fibroblast growth factor 2; HPTLC, high performance thin layer chromatography; NP, neural progenitor; PAR-4, prostate apoptosis response 4; PCNA, proliferating cell nuclear antigen; SPT, serine palmitoyltransferase.
References
- Bhakar, A.L., L.-L. Tannis, C. Zeindler, M.P. Russo, C. Jobin, D.S. Park, S. MacPherson, and P.A. Barker. 2002. Constitutive nuclear factor-κB activity is required for central neuron survival. J. Neurosci. 22:8466–8475. [DOI] [PMC free article] [PubMed] [Google Scholar]
- Bieberich, E., S. MacKinnon, J. Silva, and R.K. Yu. 2001. Regulation of apoptosis during neuronal differentiation by ceramide and b-series complex gangliosides. J. Biol. Chem. 276:44396–44404. [DOI] [PubMed] [Google Scholar]
- Blaschke, A.J., K. Staley, and J. Chun. 1996. Widespread programmed cell death in proliferative and post-mitotic regions of fetal cerebral cortex. Development. 122:1165–1174. [DOI] [PubMed] [Google Scholar]
- Camandola, S., and M.P. Mattson. 2000. Pro-apoptotic action of Par-4 involves inhibition of NF-κB activity and suppression of bcl-2 expression. J. Neurosci. Res. 61:134–139. [DOI] [PubMed] [Google Scholar]
- Cecconi, F., G. Alvarez-Bolado, B.I. Meyer, K.A. Roth, and P. Gruss. 1998. Apaf1 (CED-4 homolog) regulates programmed cell death in mammalian development. Cell. 94:727–737. [DOI] [PubMed] [Google Scholar]
- Chan, W.Y., D.E. Lorke, S.C. Tiu, and D.T. Yew. 2002. Proliferation and apoptosis in the developing human neocortex. Anat. Rec. 267:261–276. [DOI] [PubMed] [Google Scholar]
- Cheema, S.K., S.K. Mishra, V.M. Rangnekar, A.M. Tari, R. Kumar, and G. Lopez-Berestein. 2003. PAR-4 transcriptionally regulates Bcl-2 through a WT1-binding site on the bcl-2 promoter. J. Biol. Chem. 278:19995–20005. First published on March 17, 2003; 10.1074/jbc.M205865200. [DOI] [PubMed]
- Dasgupta, S., and E.L. Hogan. 2001. Chromatographic resolution and quantitative assay of CNS tissue sphingoids and sphingolipids. J. Lipid Res. 42:301–308. [PubMed] [Google Scholar]
- Diaz-Meco, M.T., M.M. Municio, S. Frutos, P. Sanchez, J. Lozano, L. Sanz, and J. Moscat. 1996. The product of par-4, a gene induced during apoptosis, interacts selectively with the atypical isoforms of protein kinase C. Cell. 86:777–786. [DOI] [PubMed] [Google Scholar]
- Fraichard, A., O. Chassande, G. Bilbaut, C. Dehay, P. Savatier, and J. Samarut. 1995. In vitro differentiation of embryonic stem cells into glial cells and functional neurons. J. Cell Sci. 108:3181–3188. [DOI] [PubMed] [Google Scholar]
- Grassme, H., A. Jekle, A. Riehle, H. Schwarz, J. Berger, K. Sandhoff, R. Kolesnick, and E. Gulbins. 2001. CD95 signaling via ceramide-rich membrane rafts. J. Biol. Chem. 276:20589–20596. [DOI] [PubMed] [Google Scholar]
- Guo, Q., W. Fu, J. Xie, H. Luo, S.F. Sells, J.W. Geddes, V. Bondada, V. Rangnekar, and M.P. Mattson. 1998. Par-4 is a mediator of neuronal degeneration associated with the pathogenesis of Alzheimer disease. Nat. Med. 4:957–962. [DOI] [PubMed] [Google Scholar]
- Guo, Q., J. Xie, X. Chang, X. Zhang, and H. Du. 2001. Par-4 is a synaptic protein that regulates neurite outgrowth by altering calcium homeostasis and transcription factor AP-1 activation. Brain Res. 903:13–25. [DOI] [PubMed] [Google Scholar]
- Hakem, R., A. Hakem, G.S. Duncan, J.T. Henderson, M. Woo, M.S. Soengas, A. Elia, J.L. de la Pompa, D. Kagi, W. Khoo, et al. 1998. Differential requirement for caspase 9 in apoptotic pathways in vivo. Cell. 94:339–352. [DOI] [PubMed] [Google Scholar]
- Hanada, K., T. Hara, M. Fukasawa, A. Yamaji, M. Umeda, and M. Nishijima. 1998. Mammalian cell mutants resistant to a sphingomyelin-directed cytolysin. Genetic and biochemical evidence for complex formation of the LCB1 protein with the LCB2 protein for serine palmitoyltransferase. J. Biol. Chem. 273:33787–33794. [DOI] [PubMed] [Google Scholar]
- Hancock, C.R., J.P. Wetherington, N.A. Lambert, and B. Condie. 2000. Neuronal differentiation of cryopreserved neural progenitor cell derived form mouse embryonic stem cells. Biochem. Biophys. Res. Commun. 271:418–421. [DOI] [PubMed] [Google Scholar]
- Hatten, M.E. 1999. Central nervous system neuronal migration. Annu. Rev. Neurosci. 22:511–539. [DOI] [PubMed] [Google Scholar]
- Herget, T., C. Esdar, S.A. Oehrlein, M. Heinrich, S. Schutze, A. Maelicke, and G. van Echten-Deckert. 2000. Production of ceramides causes apoptosis during early neural differentiation in vitro. J. Biol. Chem. 275:30344–30354. [DOI] [PubMed] [Google Scholar]
- Ji, L., G. Zhang, S. Uematsu, Y. Akahori, and Y. Hirabayashi. 1995. Induction of apoptotic DNA fragmentation and cell death by natural ceramide. FEBS Lett. 358:211–214. [DOI] [PubMed] [Google Scholar]
- Kuan, C.-Y., K.A. Roth, R.A. Flavell, and P. Rakic. 2000. Mechanisms of programmed cell death in the developing brain. Trends Neurosci. 23:291–297. [DOI] [PubMed] [Google Scholar]
- Kuida, K., T.F. Haydar, C.Y. Kuan, Y. Gu, C. Taya, H. Karasuyama, M.S.S. Su, P. Rakic, and R.A. Flavell. 1998. Reduced apoptosis and cytochrome c-mediated caspase activation in mice lacking caspase 9. Cell. 94:325–337. [DOI] [PubMed] [Google Scholar]
- Laemmli, U.K. 1970. Cleavage of structural proteins during the assembly of the head of bacteriophage 4. Nature. 227:680–685. [DOI] [PubMed] [Google Scholar]
- Leblond, C.P., and M. El-Alfy. 1998. The eleven stages of the cell cycle, with emphasis on the changes in chromosomes and nucleoli during interphase and mitosis. Anat. Rec. 252:426–443. [DOI] [PubMed] [Google Scholar]
- Liu, D.X., and L.A. Greene. 2001. Neuronal apoptosis at the G1/S cell cycle checkpoint. Cell Tissue Res. 305:217–228. [DOI] [PubMed] [Google Scholar]
- Mattson, M.P. 2000. Apoptotic and anti-apoptotic synaptic signaling mechanisms. Brain Pathol. 10:300–312. [DOI] [PMC free article] [PubMed] [Google Scholar]
- Mayer-Proschel, M., A.J. Kalyani, T. Mujitaba, and M.S. Rao. 1997. Isolation of lineage-restricted neuronal precursors from multipotent neuroepithelial stem cells. Neuron. 19:773–785. [DOI] [PubMed] [Google Scholar]
- Morcos, P.A. 2001. Achieving efficient delivery of morpholino oligos in cultured cells. Genesis. 30:94–102. [DOI] [PubMed] [Google Scholar]
- Movsesyan, V.A., A.G. Yakovlev, E.A. Dabaghyan, B.A. Stoica, and A.I. Faden. 2002. Ceramide induces neuronal apoptosis through the caspase-9/caspase-3 pathway. Biochem. Biophys. Res. Commun. 299:201–207. [DOI] [PubMed] [Google Scholar]
- Okabe, S., K. Forsberg-Nilsson, A.C. Spiro, M. Segal, and R.D. McKay. 1996. Development of neuronal precursor cells and functional postmitotic neurons from embryonic stem cells in vitro. Mech. Dev. 59:89–102. [DOI] [PubMed] [Google Scholar]
- Orgogozo, V., F. Schweisguth, and Y. Bellaiche. 2002. Binary cell death decision regulated by unequal partitioning of Numb at mitosis. Development. 129:4677–4684. [DOI] [PubMed] [Google Scholar]
- Pesce, M., and H.R. Scholer. 2001. Oct-4: gatekeeper in the beginnings of mammalian development. Stem Cells. 19:271–278. [DOI] [PubMed] [Google Scholar]
- Shen, Q., W. Zhong, Y.N. Jan, and S. Temple. 2002. Asymmetric Numb distribution is critical for asymmetric cell division of mouse cerebral cortical stem cells and neuroblasts. Development. 129:4843–4853. [DOI] [PubMed] [Google Scholar]
- Signorelli, P., and Y.A. Hannun. 2002. Analysis and quantitation of ceramide. Methods Enzymol. 345:275–294. [DOI] [PubMed] [Google Scholar]
- Sommer, L., and M. Rao. 2002. Neural stem cells and regulation of cell number. Prog. Neurobiol. 66:1–18. [DOI] [PubMed] [Google Scholar]
- Toman, R.E., V. Movsesyan, S.K. Murthy, S. Milstien, S. Spiegel, and A.I. Faden. 2002. Ceramide induced cell death in primary neuronal cultures: upregulation of ceramide levels during neuronal apoptosis. J. Neurosci. Res. 68:323–330. [DOI] [PubMed] [Google Scholar]
- Wang, C.-S., and R.L. Smith. 1975. Lowry determination of protein in the presence of Triton X-100. Anal. Biochem. 63:414–417. [DOI] [PubMed] [Google Scholar]
- Wessel, D., and U.I. Flugge. 1984. A method for the quantitative recovery of protein in dilute solution in the presence of detergents and lipids. Anal. Biochem. 138:141–143. [DOI] [PubMed] [Google Scholar]
- Wu, Y.Y., T. Mujtaba, S.S.W. Han, I. Fischer, and M.S. Rao. 2002. Isolation of a glial-restricted tripotential cell line from embryonal spinal cord cultures. Glia. 38:65–79. [DOI] [PubMed] [Google Scholar]
- Xie, J., X. Chang, X. Zhang, and Q. Guo. 2001. Aberrant induction of Par-4 is involved in apoptosis of hippocampal neurons in presenilin-1 M146V mutant knock-in mice. Brain Res. 915:1–10. [DOI] [PubMed] [Google Scholar]


