

Abstract
Interactions between microtubules (MTs) and filamentous actin (f-actin) are involved in directed cell locomotion, but are poorly understood. To test the hypothesis that MTs and f-actin associate with one another and affect each other's organization and dynamics, we performed time-lapse dual-wavelength spinning-disk confocal fluorescent speckle microscopy (FSM) of MTs and f-actin in migrating newt lung epithelial cells. F-actin exhibited four zones of dynamic behavior: rapid retrograde flow in the lamellipodium, slow retrograde flow in the lamellum, anterograde flow in the cell body, and no movement in the convergence zone between the lamellum and cell body. Speckle analysis showed that MTs moved at the same trajectory and velocity as f-actin in the cell body and lamellum, but not in the lamellipodium or convergence zone. MTs grew along f-actin bundles, and quiescent MT ends moved in association with f-actin bundles. These results show that the movement and organization of f-actin has a profound effect on the dynamic organization of MTs in migrating cells, and suggest that MTs and f-actin bind to one another in vivo.
Keywords: live cell microscopy; cytoskeleton; cell motility; dynamic instability; retrograde flow
Introduction
The directed movement of cells is thought to result from complex and dynamic interactions between the microtubule (MT)* and filamentous actin (f-actin) cytoskeletal systems (Wittmann and Waterman-Storer, 2001). Migrating cells have a polarized morphology, with a ruffling lamellipodium at the leading edge facing the direction of migration, followed by a flat lamellum, a tapering cell body, and a trailing tail. This polarity results from highly polarized organization and assembly/disassembly dynamics of f-actin. The lamellipodium contains a dense meshwork of actin filaments whose barbed ends continuously grow near the leading edge. F-actin in both the lamellipodium and lamellum undergoes retrograde movement towards the cell center, which may mediate cellular traction (Mitchison and Cramer, 1996; Cramer and Mitchison, 1998; Small et al., 1998). In the cell body and tail, f-actin at the ventral cell surface forms bundles that may be contractile and mediate retraction of the cell rear (Cramer et al., 1997). MTs, like f-actin, exhibit polarized organization and dynamics in migrating cells (Wittmann and Waterman-Storer, 2001). MT plus ends grow out from the cell center primarily towards the leading edge where they undergo dynamic instability, i.e., stochastic switching between growth and shortening. There is evidence that MT movements may mimic those of f-actin, undergoing retrograde flow in the lamellum and forward motion in the cell body and tail (Waterman-Storer and Salmon, 1997; Yvon and Wadsworth, 2000; Yvon et al., 2001).
How MTs and actin interact to produce directed cell motility is unclear. MTs may provide spatial cues to localize f-actin–based protrusion and contraction (Wittmann and Waterman-Storer, 2001). One way this could be achieved is by physical interaction between the two filament systems. In this study, we tested the hypothesis that MTs and f-actin interact with one another in living, migrating cells to affect each other's dynamic organization by using time-lapse dual-wavelength spinning-disk confocal fluorescent speckle microscopy (FSM) (Waterman-Storer et al., 1998; Waterman-Storer, 2002) to near simultaneously visualize f-actin and MT dynamic behaviors in migrating newt lung epithelial cells. This analysis reveals for the first time that MTs exhibit interactions with f-actin bundles and meshworks that guide the movement and organization of MTs during cell motility.
Results and discussion
F-actin exhibits four distinct zones of dynamic behavior
We concentrated our analysis of migrating newt lung epithelial cells on the cytoskeleton at the ventral cell surface because the f-actin in this region likely mediates the traction forces of motility. To support this notion, we generated deconvolved three-dimensional reconstructions of fixed cells labeled with fluorescent phalloidin (Fig. 1 a). In X–Z views, f-actin in the lamellipodium and distal lamella fills an area the same thickness or thinner than our confocal optical section thickness of 530 nm (Fig. 1 b). In the proximal lamella and cell body, f-actin is concentrated solely in cortical regions of similar thickness, with little detectable actin in the central cell body. This indicates that our confocal images contain the full population of ventral f-actin, and that in the cell center there is likely little interaction between dorsal and ventral f-actin.
Figure 1.
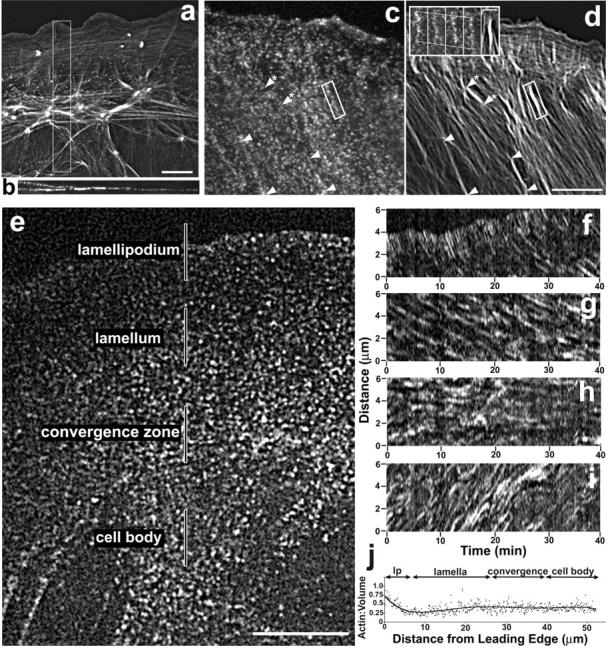
Organization and dynamics of F-actin in migrating newt lung epithelial cells. (a and b) Z-series of deconvolved optical sections of an Alexa-488 phalloidin-stained cell were used to generate views along the z axis (a, maximum projection) or y axis (b, three-dimensional reconstruction of the boxed area in panel a). Bar, 10 μm. (c and d) Confocal FSM image, taken from a time-lapse series, of a living cell injected with X-rhodamine actin (c) and after fixation and staining with Alexa 488 phalloidin (d). See Video 1 (available at http://www.jcb.org/cgi/content/full/jcb.200203022/DC1). F-actin bundles (c and d, arrowheads) prominent in the phalloidin image (c) correspond to linear arrays of speckles in the FSM image (d, boxed bundle shown at 150-s intervals in inset). A bundle in d (starred arrowheads) has no corresponding linear array of speckles in the FSM image (c). Bar, 10 μm; inset, 3 μm. (e–i) Four zones of f-actin dynamics. (e) Single f-actin FSM image from Video 2 (available at http://www.jcb.org/cgi/content/full/jcb.200203022/DC1). Bar, 10 μm. (f–i) Kymographs of the four zones of f-actin movement taken along the regions highlighted in (e). F-actin speckles move retrograde in the (f) lamellipodium at 1.6 μm/min, in the (g) lamella at 0.3 μm/min. (h) In the convergence zone, there is no directional movement of f-actin. (i) F-actin moves anterograde in the cell body at 0.4 μ/min. Elapsed time in min:s. Bar, 10 μm. (j) Plot of the actin:fluorescent volume marker ratio along the axis of migration of a cell reveals a steep gradient of actin concentration across the lamellipodium (lp), and relatively constant concentration through the rest of the cell.
For confocal FSM imaging, we injected cells with 0.5 mg/ml of X-rhodamine actin. Random incorporation of a few labeled and many endogenous unlabeled monomers during filament assembly gives f-actin structures a fluorescent speckled appearance in diffraction-limited images (Fig. 1 c; Waterman-Storer et al., 1998; Watanabe and Mitchison, 2002). The speckles act as fiduciary marks on the filaments; their movement reports polymer movement, whereas their appearance/disappearance report polymer assembly/disassembly.
To relate speckle dynamics to the f-actin structures seen in phalloidin-stained cells, we collected confocal FSM images at 10-s intervals followed by perfusion of fixative and staining with Alexa-488 phalloidin (Fig. 1, c and d; Video 1, available at http://www.jcb.org/cgi/content/full/jcb.200203022/DC1). This showed that areas with somewhat even distributions of fluorescent speckles in FSM images corresponded to f-actin meshworks or fine f-actin bundles. Linear arrays of f-actin speckles that moved together coherently in time-lapse FSM corresponded to bundles of f-actin (Fig. 1 d, inset). There was a minor subset of f-actin bundles in the phalloidin image that had no correspondence in the FSM image (Fig. 1, c and d, starred arrowheads), indicating their lack of incorporation of labeled actin and thus high stability.
Analysis of time-lapse confocal actin FSM image series in 39 cells revealed a general pattern of four distinct zones of f-actin movements (Fig. 1, e–i; Video 2, available at http://www.jcb.org/cgi/content/full/jcb.200203022/DC1). At the leading edge and throughout the lamellipodium, f-actin speckles continuously appeared and moved towards the cell center at 1.62 ± 0.14 μm/min, as determined from kymograph analysis along the axis of motion (Waterman-Storer, 2002; n = 136 measurements in five cells; Fig. 1 f). As speckles approached the junction between the lamellipodium and lamellum they usually disappeared, suggesting a zone of f-actin disassembly (Watanabe and Mitchison, 2002). To confirm this apparent gradient in actin density across the lamellipodium, cells were coinjected with X-rhodamine actin and FITC dextran (6 kD) as a volume marker. Ratio imaging indicated a steep gradient in actin density from the front to the rear of the lamellipodium (Fig. 1 j). F-actin speckles underwent retrograde flow ∼5× more slowly in the lamellum at 0.34 ± 0.12 μm/min (n = 194 measurements made in 6 cells; Fig. 1 g, Video 2, available at http://www.jcb.org/cgi/content/full/jcb.200203022/DC1). Speckles also appeared and disappeared throughout the lamellum, suggesting f-actin assembly/disassembly throughout this region. F-actin in the cell body generally moved towards the leading edge at a rate of 0.44 ± 0.18 μm/min (n = 133 measurements in five cells; Fig. 1 i; Video 2, available at http://www.jcb.org/cgi/content/full/jcb.200203022/DC1). Linear arrays of f-actin speckles in filament bundles moved coherently together generally towards the leading edge, though cell body bundles often approached the cell front at oblique angles.
Between the cell body, where the f-actin moved anterograde, and the lamellum, where f-actin moved retrograde, kymograph analysis along either the axis of migration (velocity = 0.01 ± 0.12, n = 167 measurements in five cells; Fig. 1 h) or parallel to the leading edge (velocity = 0.00 ± 0.12 μm/min, n = 151 measurements in five cells, kymographs not shown) failed to detect directed movement of f-actin speckles, but local movements and speckle disappearance was noted (Video 2, available at http://www.jcb.org/cgi/content/full/jcb.200203022/DC1). Although one might expect a buildup of filaments in this novel convergence zone where f-actin movements from the lamellum and cell body meet, ratio imaging with a volume marker revealed no increase in actin density (Fig. 1 j). Thus, like the base of the lamellipodium, the convergence zone must be a region of massive f-actin disassembly. Interestingly, the direction of movement of f-actin on the ventral surface of newt lung cells correlates well with the direction of traction forces that other migrating cell types generate on the substrate (Galbraith and Sheetz, 1997; Pelham and Wang, 1999). This novel convergence zone is located where forward and rearward traction forces are likely to meet. This strongly implicates local ventral f-actin movement in generation of traction force, and suggests that actin depolymerization may be a major regulatory step in cell body traction, as has been shown for lamellipodial protrusion (Cramer 1999).
MTs are coupled to f-actin movements
To test the hypothesis that the movements of f-actin and MTs are directly correlated during cell migration, we monitored the dynamics of f-actin and MTs in 39 cells using dual-wavelength confocal FSM to capture images of X-rhodamine f-actin and Cy-2 MTs in rapid succession every 10 s. In single confocal sections, we could easily differentiate between an MT end, whose fluorescence intensity terminated abruptly, and an MT extending out of the plane of focus, whose fluorescence gradually decreased towards a terminus.
We first analyzed in detail the behavior of individual MTs that were oriented primarily parallel to the leading edge (Fig. 2; Table I). Using dual-wavelength kymographs, we determined the percentage of total MT movement rates that matched within 2.5% the movement rates of the immediately adjacent f-actin speckles (Table I). The precise coupling of f-actin and parallel MT movements occurred in all four zones of f-actin dynamic behavior: the lamellipodium, lamellum, convergence zone, and cell body (Fig. 2, b–e; Table I; Video 3, available at http://www.jcb.org/cgi/content/full/jcb.200203022/DC1).
Figure 2.
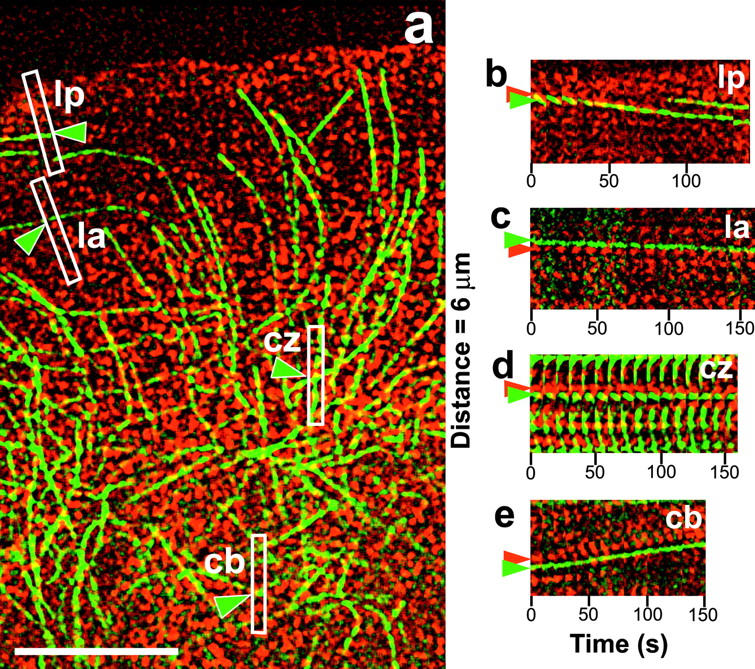
MTs parallel to the leading edge are coupled to the movement of f-actin. (a) Image from Video 3 (available at http://www.jcb.org/cgi/content/full/jcb.200203022/DC1) of Cy2 MTs (green) and X-rhodamine f-actin (red). Boxes highlight the regions in the lamellipodium (lp), lamellum (la), convergence zone (cz), and cell body (cb) that were used to construct the kymographs in (b–e). The long axis of the boxes was tilted to match the trajectory of speckles as determined by watching Video 3. Green arrowheads highlight the parallel MTs being analyzed. (b–e) Dual wavelength kymographs of the regions highlighted in panel a. Green and red arrowheads highlight speckles in parallel MTs and the actin meshwork, respectively. Bar, 10 μm.
Table I. Coupling of MT and f-actin speckle movements in various cellular regions.
| Cellular region | Parallel MTs | Perpendicular MTs | ||
|---|---|---|---|---|
| % matching velocites | n | % matching velocites | n | |
| Lamellipodium | 92 | 43 measurements, 13 cells | 7 | 14 measurements, 10 cells |
| Lamellum | 98 | 126 measurements, 6 cells | 89 | 103 measurements, 7 cells |
| Convergence zone | 86 | 88 measurements, 14 cells | 23 | 34 measurements, 9 cells |
| Cell body | 86 | 56 measurements, 12 cells | 78 | 38 measurements, 14 cells |
The % matching velocities refers to the percentage of MT speckle velocities that matched the velocity of an adjacent f-actin speckle within 2.5%, as measured from dual-wavelength kymographs.
We also analyzed individual MTs that were oriented perpendicular to the leading edge (Fig. 3; Table I; Videos 4 and 5, available at http://www.jcb.org/cgi/content/full/jcb.200203022/DC1). Kymographs showed that speckle marks on perpendicular MTs moved at the same velocity as the immediately adjacent f-actin in both the lamellum and in the cell body (Fig. 3, a and c; Table I; Videos 3 and 4, available at http://www.jcb.org/cgi/content/full/jcb.200203022/DC1). In contrast, in the lamellipodium and convergence zone, perpendicular MT movements were often uncoupled from actin movements (Table I). In the lamellipodium, f-actin speckles moved rapidly past MT speckles (Fig. 3, b and d; Video 5, available at http://www.jcb.org/cgi/content/full/jcb.200203022/DC1), and the rearward velocity of the portion of the MT in the lamellipodium matched the slower rate of f-actin rearward flow ∼7 μm from the leading edge in the lamellum (Fig. 3, d and b). MTs that were perpendicular to the leading edge and extended from the cell body across the convergence zone and into the lamellum were often uncoupled from the stationary actin in the convergence zone (Table I). Sections of MT spanning this region buckled and bent extensively and moved at odd angles relative to the stationary f-actin speckles as portions of MT length moved into the convergence zone from adjacent cellular regions (Table I; Video 3, available at http://www.jcb.org/cgi/content/full/jcb.200203022/DC1).
Figure 3.
MTs perpendicular to the leading edge move at the same rate as the f-actin in the lamellum, but not in the lamellipodium. (a) Single image from the time-lapse series in Video 4 (available at http://www.jcb.org/cgi/content/full/jcb.200203022/DC1) shows an MT (green) oriented perpendicular to the leading edge within the lamellum. (c) Kymograph of the boxed region in (a). Speckles along the MT appear as parallel green streaks in the kymograph as the MT moves retrograde at the exact same rate as the immediately adjacent f-actin speckles (red streaks). (b) Single image from the time-lapse series seen in Video 5 (available at http://www.jcb.org/cgi/content/full/jcb.200203022/DC1) of a perpendicular MT in the lamellipodium. (d) Kymograph of the boxed region in (b). The slope of the green MT streaks in the lamellipodium (lp, green line) are much shallower than the slopes of the red f-actin streaks (red line), indicating f-actin moves faster than the MT at the lamellipodium. In the lamellum (la), the slopes of the red and green streaks match (yellow line), indicating coordinated movement of the MT and f-actin at this region. Bar, 3 μm.
These results directly show that the acto-myosin–dependent movements of MTs reported previously (Waterman-Storer and Salmon, 1997; Yvon and Wadsworth, 2000, 2001) occur at the exact same rate as the f-actin in the immediate vicinity of the moving MT. We suggest that the coordinated movement of f-actin and MTs is mediated by a specific crosslinking interaction between f-actin and MTs, as opposed to nonspecific trapping of MTs in the moving f-actin meshwork. First, the coupling of MT and f-actin movements is regionally regulated, being least robust in the lamellipodium (Table I), where the f-actin density is the highest (Fig. 1 j). This strongly argues against the notion of nonspecific trapping of MTs by a dense f-actin meshwork. Second, both MTs oriented parallel to the leading edge, which have a large cross-sectional area exposed to the force of f-actin flow, and MTs that are oriented perpendicular to the leading edge and which have a very small cross-sectional area exposed to the force of f-actin flow, move at the exact same rate as the immediately adjacent f-actin in the lamella and cell body. However, our analysis suggests that nonspecific trapping could occur for parallel MTs, which continue to move at f-actin flow rates in areas of the cell where perpendicular MTs are uncoupled from flow. Alternatively, MTs and actin could both be riding on the same as yet unidentified conveyor belt, although we consider this unlikely, as we have documented MT/f-actin crosslinking interactions in Xenopus egg extracts (Waterman-Storer et al., 2000).
MTs interact with f-actin bundles
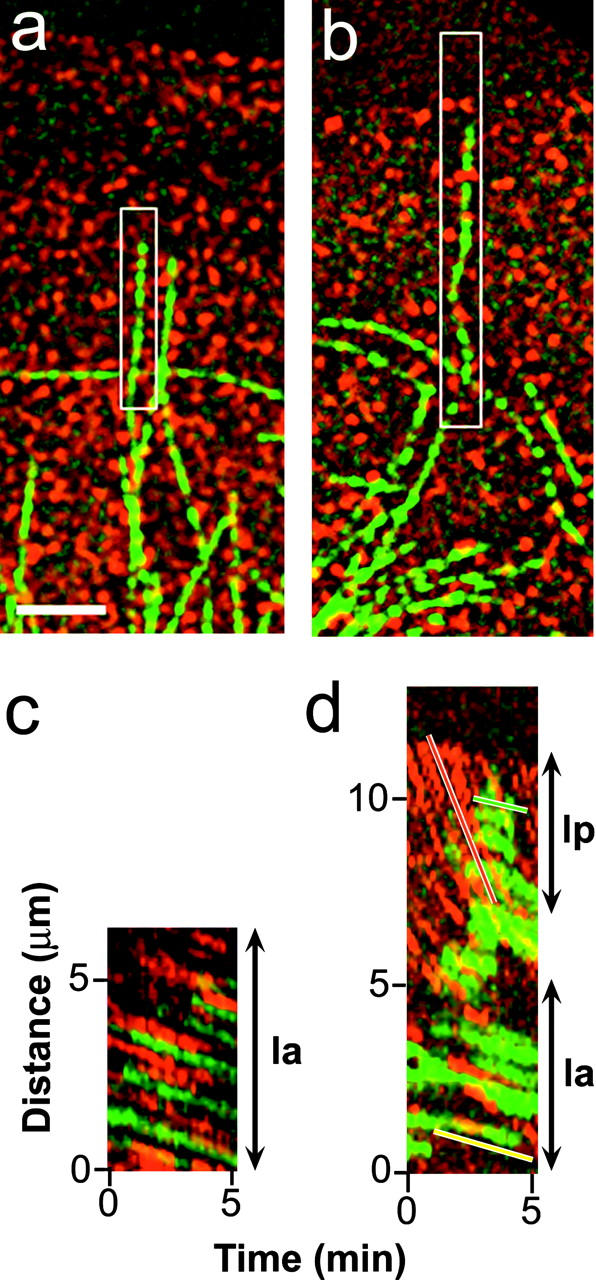
In the cell body and convergence zone, dual-wavelength movies revealed that dynamic MTs often aligned along f-actin bundles and moved with them along their anterograde/oblique paths (Video 3, available at http://www.jcb.org/cgi/content/full/jcb.200203022/DC1). In addition, dynamically unstable MTs associated with f-actin bundles that terminated in dense f-actin plaques (Fig. 4, a and b; Video 6, available at http://www.jcb.org/cgi/content/full/jcb.200203022/DC1). Analysis of speckle fiduciary marks indicated that the f-actin bundle and associated MT were stationary with respect to one another, demonstrating that MTs grew and shortened, as opposed to translocated, along f-actin bundles towards the plaques. (Fig. 4, a and b; Video 6, available at http://www.jcb.org/cgi/content/full/jcb.200203022/DC1). We also observed a second type of interaction between MTs and f-actin bundles in the cell body. Individual MT ends terminated on linear arrays of f-actin speckles, often joining the f-actin bundle at oblique angles (Fig. 4 c; Video 7, available at http://www.jcb.org/cgi/content/full/jcb.200203022/DC1). Speckle tracking analysis showed that the MT end and speckles in the f-actin bundle moved in tandem, whereas the MT end moved past adjacent, nonbundle-associated f-actin speckles. (Fig. 4 d). Thus, the MT end and the f-actin bundle were cotranslocating, as opposed to the MT moving along the f-actin bundle. In addition, the distance between the MT end and a speckle along the MT shaft stayed constant over time (Fig. 4 e), indicating that the MT end was neither growing nor shortening, but was capped. However, we have no indication of whether these were MT plus or minus ends.
Figure 4.

MTs interact with f-actin bundles. (a and b) MTs align along f-actin bundles in the cell body and grow toward dense f-actin plaques. (a) F-actin bundles (highlighted with red lines) radiate out from an f-actin plaque. (b) Dual wavelength images taken from Video 6 (available at http://www.jcb.org/cgi/content/full/jcb.200203022/DC1). MT ends (green, arrowhead and small arrow) grow toward the f-actin plaque while remaining aligned along f-actin bundles (red). As the end of a MT (arrowhead) moves toward the plaque, a speckle along the MT shaft (large arrow) remains stationary with respect to the f-actin bundle. The figure is oriented with the leading edge toward the top of the figure. Elapsed time in min:s. Bar, 10 μm. (c–e) MTs with nondynamic ends move coordinately with f-actin bundles. (c) Time-lapse series from Video 7 (available at http://www.jcb.org/cgi/content/full/jcb.200203022/DC1) of an MT end (green; small arrowhead) moving coordinately with an f-actin bundle (red, highlighted by white line). A nearby nonbundle actin speckle stays stationary over the same time (large arrow). (d) Plot of X and Y coordinates (increasing time from left to right) of the MT end (c, small arrowhead) and two speckles in the f-actin bundle (c, arrows 1 and 2). The MT and the f-actin speckles have the same trajectories and instantaneous velocities. (e) The distance between the MT end (c, small arrowhead) and a speckle on the MT shaft (c, large arrowhead) remains constant. Absent measurements in the series were slightly out-of-focus frames. The figure is oriented with the leading edge toward the top of the figure. Elapsed time in min:s. Bar, 4 μm.
We suggest that the guidance of MTs along actin bundles and the cotransport of MTs and f-actin in the lamellipodium and cell body may be mediated by the same putative MTs/f-actin crosslinking factor. This factor could be distributed along the MT or actin filament lattices and subject to regional regulation to allow local uncoupling of MTs from f-actin, i.e., in the lamellipodium or convergence zone. Further, such a crosslinker may be fundamental to cell motility. For example, MT crosslinking to focal adhesion-associated f-actin bundles is likely the mechanism of MT targeting to focal adhesions, which spatially regulates focal adhesion turnover (Kaverina et al., 1999). Similar MT/f-actin crosslinking may also mediate guidance of MTs by f-actin bundles in neurons to determine MT distribution in growth cones that is critical to axonal guidance and branching (Dent and Kalil, 2001; Kabir et al., 2001; Schaefer et al., 2002; Zhou et al., 2002).
In contrast, the interactions of capped MT ends with f-actin bundles likely is mediated by a separate molecular mechanism, in which a MT end–binding protein links to f-actin. We suggest that MT end/f-actin interactions may be critical to functions that require establishment of cellular asymmetries. For example, linking of MT ends to the f-actin–rich cortex is important for orienting mitotic spindles and the placement of the cytokinetic furrow during cell division (McCartney et al., 2001; Segal and Bloom, 2001; J.C. Canman, C.M. Waterman-Storer, and E.D. Salmon, personal communication). Similarly, MT end/f-actin interactions could orient the centrosome forward of the nucleus and thus establish the polarity of migrating cells. Indeed, recent evidence has shown that centrosome reorientation in migrating cells is dependent on the MT end–associated protein complex, cytoplasmic dynein (Etienne-Manneville and Hall, 2001; Pallazo et al., 2001). There are several interesting candidates for linking MT to f-actin (Fuchs and Karakesisoglou, 2001), and it will be interesting to test their involvement in MT-actin coupling with our dual-wavelength FSM assay.
Materials and methods
Cell manipulations
Primary cultures of newt (Taricha granulosa) lung epithelial cells were established and microinjected as previously described (Waterman-Storer and Salmon, 1997). Fluorescently labeled tubulin and actin were prepared as described in Waterman-Storer (2002). For FSM visualization of f-actin alone, cells were microinjected with 0.5 mg/ml X-rhodamine actin in G-buffer (2 mM Tris, 0.2 mM CaCl2, 0.2 mM Mg ATP, 0.5 mM β-mercaptoethanol, pH 7.0). For dual-wavelength FSM, cells were microinjected with 0.5 mg/ml X-rhodamine actin and 0.2 mg/ml Cy2 tubulin in coinjection buffer (2.2 mM Pipes, 1.8 mM, Tris, 1.5 mM K glutamate, 0.46 mM β-mercaptoethanol, 0.18 mM CaCl2, 0.18 mM Mg ATP, 0.02 mM KCl). Coverslips of injected cells were mounted for microscopy as described (Waterman-Storer and Salmon, 1997).
Microscopy
Dual-wavelength time-lapse FSM was performed on a spinning disk confocal microscope system. Light from a 50-mW Krypton-Argon ion laser (Melles Griot, OmniChrome) was delivered by a single-mode fiber optic (Point Source) to a Yokogawa spinning disk confocal scan-head (UltraView; PerkinElmer) on an inverted microscope (TE300 Quantum; Nikon). Excitation wavelength was selected by a filter-wheel apparatus (Sutter Instruments Co.) containing excitation filters for 488 and 568 nm (Chroma) and an opaque disk used as an excitation shutter. Emission was selected by multiple bandpass dichromatic mirror and emission filter (Chroma). Images were collected by a 100× 1.4NA Plan-Apo DIC objective lens (Nikon) and captured with an Orca 2 camera (Hamamatsu). Microscope functions were controlled by MetaMorph software (Universal Imaging). One set of sequential images of the specimen using 488 nm light for Cy2 tubulin and 568 nm light for X-rhodamine f-actin was collected in the ventral focal plane at 10-s intervals for 30–60 min.
The thickness of the confocal optical section was measured using FocalChek beads (Molecular Probes). Deconvolution of z-series (100-nm steps) of fixed cells was performed with DeltaVision software using the Agard/Sedat inverse matrix algorithm from images collected on a DeltaVision Optical Sectioning system (Applied Precision) with a 100× 1.4 NA Plan Apo objective on an Olympus IX-70 microscope at the Scripps Core Microscopy Facility.
For comparison of f-actin FSM to phalloidin staining, live cells were imaged in a custom-built perfusion chamber. Cells were perfused with 4% paraformaldehyde in PBS (140 mM NaCl, 15 mM Na-phosphate, 2.5 mM KCl, 1.6 mM K-phosphate, pH 7.2), lysed in PBS containing 0.5% TX-100, and stained with Alexa 488 phalloidin (Molecular Probes), and imaged again. To compare the concentration of f-actin with that of a volume marker, cells were microinjected with 0.5 mg/ml X-rhodamine actin and 0.6 mg/ml 6 kD FITC-dextran in G-buffer.
Image processing and data analysis
All image processing, position, and intensity measurements were performed with MetaMorph and Excel (Microsoft Corp.) software. Images were processed as follows: (1) background subtraction; (2) 3 × 3 low pass filter; (3) unsharp mask filter; (4) color coding MT images green and f-actin images red; and (5) color combining into 24-bit RGB images. Kymograph analysis was performed as described (Waterman-Storer, 2002).
To calculate the actin:volume ratio, line scans were taken from across the leading edge to the cell body in both the actin and dextran images and the intensity values were imported to Excel. The values were scaled to set maximal intensities equal, and the actin values were divided by the dextran values at each pixel position.
Online supplemental material
Quick-Time movies of image series from which figures were made are available at http://www.jcb.org/cgi/content/full/jcb.200203022/DC1. (Video 1) Correlation of time-lapse actin FSM to fixed phalloidin staining. (Video 2) Time-lapse FSM reveals four distinct zones of polymerization and movement behavior of f-actin. (Video 3) Dual-wavelength FSM of microtubules (green) and f-actin (red). (Video 4) Retrograde flow of microtubules oriented perpendicular to the leading edge in the lamellipodium is coupled to the movement of immediately adjacent lamellum speckles. (Video 5) Retrograde flow of microtubules oriented perpendicular to the leading edge in the lamellipodium is not coupled to the movements of immediately adjacent lamellipodium f-actin. (Video 6) Microtubules grow along f-actin bundles toward dense f-actin plaques. (Video 7) A microtubule with a quiescent-end move in association with a moving f-actin bundle seen as a linear array of f-actin.
Supplemental Material
Acknowledgments
We thank Velia Fowler (The Scripps Research Institute, La Jolla, CA) for acetone powder; Brian Smith for help with deconvolution; Torsten Wittmann, Natalie Prighozhina, Stephanie Gupton, Chris Cohan, Paul Forscher, and Gaudenz Danuser for helpful discussions; and Velda Comstock for expert administrative assistance.
This work was supported by grant GM61804-01 from the National Institutes of Health.
The online version of this article contains supplemental material.
Footnotes
Abbreviations used in this paper: f-actin, filamentous actin; FSM, fluorescent speckle microscopy; MT, microtubule.
References
- Cramer, L.P. 1999. Role of actin-filament disassembly in lamellipodium protrusion in motile cells revealed using the drug jasplakinolide. Curr. Biol. 9:1095–1105. [DOI] [PubMed] [Google Scholar]
- Cramer, L.P., M. Siebert, and T.J. Mitchison. 1997. Identification of novel graded polarity actin filament bundles in locomoting heart fibroblasts: implications for the generation of motile force. J. Cell Biol. 136:1287–1305. [DOI] [PMC free article] [PubMed] [Google Scholar]
- Dent, E.W., and K. Kalil. 2001. Axon branching requires interactions between dynamic microtubules and actin filaments. J. Neurosci. 21:9757–9769. [DOI] [PMC free article] [PubMed] [Google Scholar]
- Etienne-Manneville, S., and A. Hall. 2001. Integrin-mediated activation of Cdc42 controls cell polarity in migtating astrocytes through PKCξ. Cell. 106:489–498. [DOI] [PubMed] [Google Scholar]
- Fuchs, E., and I. Karakesisoglou. 2001. Bridging cytoskeletal intersections. Gene Dev. 15:1–14. [DOI] [PubMed] [Google Scholar]
- Galbraith, C.G., and M.P. Sheetz. 1997. A micromachined device provides a new bend on fibroblast traction forces. Proc. Natl. Acad. Sci. USA. 94:9114–9118. [DOI] [PMC free article] [PubMed] [Google Scholar]
- Kabir, N., A.W. Schaefer, A. Nakhost, W.S. Sossin, and P. Forscher. 2001. Protein kinase C activation promotes microtubule advance in neuronal growth cones by increasing average microtubule growth lifetimes. J. Cell Biol. 152:1033–1044. [DOI] [PMC free article] [PubMed] [Google Scholar]
- Kaverina, I., O. Krylyshkina, and J.V. Small. 1999. Microtubule targeting of substrate contacts promotes their relaxation and dissociation. J. Cell Biol. 146:1033–1044. [DOI] [PMC free article] [PubMed] [Google Scholar]
- McCartney, B.M., D.G. McEwen, E. Grevengoed, P. Maddox, A. Bejsovec, and M. Peifer. 2001. Drosophila APC2 and armadillo participate in tethering mitotic spindles to cortical actin. Nat. Cell Biol. 3:933–938. [DOI] [PubMed] [Google Scholar]
- Mitchison, T.J., and L.P. Cramer. 1996. Actin-based cell motility and cell locomotion. Cell. 84:371–379. [DOI] [PubMed] [Google Scholar]
- Pallazo, A.F., H.L. Joseph, Y.J. Chen, D.L. Dujardin, A.S. Alberts, K.K. Pfister, R.B. Vallee, and G.G. Gundersen. 2001. Cdc42, dynein and dynactin regulate MTOC reorientation independent of Rho-regulated microtubule stabilization. Curr. Biol. 11:1536–1541. [DOI] [PubMed] [Google Scholar]
- Pelham, R.J., Jr., and Y. Wang. 1999. High resolution detection of mechanical forces exerted by locomoting fibroblasts on the substrate. Mol. Biol. Cell. 10:935–945. [DOI] [PMC free article] [PubMed] [Google Scholar]
- Segal, M., and K. Bloom. 2001. Control of spindle polarity and orientation in Saccharomyces cerevisiae Trends Cell Biol. 4:160–166. [DOI] [PubMed] [Google Scholar]
- Schaefer, A.W., N. Kabir, and P. Forscher. 2002. Filopodia and actin arcs guide the assembly and transport of two populations of microtubules with unique dynamic parameters in neuronal growth cones. J. Cell Biol. 158:139–152. [DOI] [PMC free article] [PubMed] [Google Scholar]
- Small, J.V., K. Rottner, I. Kaverina, and K.I. Anderson. 1998. Assembling an actin cytoskeleton for cell attachment and movement. Biochim. Biophys. Acta. 1404:271–281. [DOI] [PubMed] [Google Scholar]
- Watanabe, N., and T.J. Mitchison. 2002. Single-molecule speckle analysis of actin filament turnover in lamellipodia. Science. 295:1083–1086. [DOI] [PubMed] [Google Scholar]
- Waterman-Storer, C.M. 2002. Fluorescent speckle microscopy (FSM) of microtubules and actin in living cells. Current Protocols in Cell Biology. J.S. Bonifacino, M. Dasso, J.B. Harford, J. Lippincott-Schwartz, and K.M. Yamada, editors. John Wiley & Sons, Inc., NY. 4.10. [DOI] [PubMed]
- Waterman-Storer, C.M., and E.D. Salmon. 1997. Actomyosin-based retrograde flow of microtubules in the lamella of migrating epithelial cells influences microtubule dynamic instability and turnover and is associated with microtubule breakage and treadmilling. J. Cell Biol. 139:417–434. [DOI] [PMC free article] [PubMed] [Google Scholar]
- Waterman-Storer, C.M., A. Desai, J.C. Bulinski, and E.D. Salmon. 1998. Fluorescent speckle microscopy, a method to visualize the dynamics of protein assemblies in living cells. Curr. Biol. 8:1227–1230. [DOI] [PubMed] [Google Scholar]
- Waterman-Storer, C.M., D.Y. Duey, K.L. Weber, J. Keech, R.E. Cheney, E.D. Salmon, and W.M Bement. 2000. Microtubules remodel actomyosin networks in Xenopus egg extracts via two mechanisms of F-actin transport. J. Cell Biol. 150:361–376. [DOI] [PMC free article] [PubMed] [Google Scholar]
- Wittmann, T., and C.M. Waterman-Storer. 2001. Cell motility: can Rho GTPases and microtubules point the way? J. Cell Sci. 114:3795–3803. [DOI] [PubMed] [Google Scholar]
- Yvon, A.M., and P. Wadsworth. 2000. Region-specific microtubule transport in motile cells. J. Cell Biol. 151:1003–1012. [DOI] [PMC free article] [PubMed] [Google Scholar]
- Yvon, A.M., D.J. Gross, and P. Wadsworth. 2001. Antagonistic forces generated by myosin II and cytoplasmic dynein regulate microtubule turnover, movement, and organization in interphase cells. Proc. Natl. Acad. Sci. USA. 98:8656–8661. [DOI] [PMC free article] [PubMed] [Google Scholar]
- Zhou, F.-Q., C.M. Waterman-Storer, and C.S. Cohan. 2002. Focal loss of actin bundles causes microtubule redistribution and growth cone turning. J. Cell Biol. 157:839–849. [DOI] [PMC free article] [PubMed] [Google Scholar]
Associated Data
This section collects any data citations, data availability statements, or supplementary materials included in this article.