

Abstract
Chromosomal translocations involving the genes encoding the alpha and beta subunits of the Pebp2/Cbf transcription factor have been associated with human acute myeloid leukemia and the preleukemic condition, myelodysplasia. Inv(16)(p13;q22) fuses the gene encoding the beta subunit of Pebp2 to the MYH11 gene encoding a smooth muscle myosin heavy chain (Smmhc). To examine the effect of the inv(16)(p13;q22) on myelopoiesis, we used the hMRP8 promoter element to generate transgenic mice expressing the Pebp2βSmmhc chimeric fusion protein in myeloid cells. Neutrophil maturation was impaired in PEBP2βMYH11 transgenic mice. Although the transgenic mice had normal numbers of circulating neutrophils, their bone marrow contained increased numbers of immature neutrophilic cells, which exhibited abnormal characteristics. In addition, PEBP2βMYH11 inhibited neutrophilic differentiation in colonies derived from hematopoietic progenitors. Coexpression of both PEBP2βMYH11 and activated NRAS induced a more severe phenotype characterized by abnormal nuclear morphology indicative of granulocytic dysplasia. These results show that PEBP2βMYH11 can impair neutrophil development and provide evidence that alterations of Pebp2 can contribute to the genesis of myelodysplasia.
Chromosomal aberrations play critical roles in the pathogenesis of leukemias. A recurrent inversion of chromosome 16, inv(16)(p13;q22), is among the common chromosomal aberrations associated with acute nonlymphocytic leukemia (1). This inversion fuses the gene encoding the beta subunit of the transcription factor Pebp2 (also known as Cbf) with the MYH11 gene encoding a smooth muscle myosin heavy chain (Smmhc) (2). The resulting PEBP2βMYH11 mRNA transcript encodes the bulk of the Pebp2β protein fused to the α-helical tail of Smmhc (2). Inv(16)(p13;q22) is closely associated with acute myelomonocytic leukemia with eosinophilia (FAB subtype M4eo) (3). PEBP2βMYH11 transcripts can be detected at diagnosis in 10% of all patients with acute nonlymphocytic leukemia, and half of those patients have a diagnosis of M4eo (4).
Pebp2/Cbf is a heterodimeric transcription factor composed of alpha and beta subunits (5, 6). The alpha subunit binds to DNA in a sequence-specific fashion, whereas the beta subunit increases the affinity of this binding. In mammals, a single gene encoding Pebp2β has been identified, while three genes encoding alpha subunits are present. One of the three alpha genes, PEBP2αB/AML1/CBFA2, is located at 21q22. This gene, like PEBP2β, is a common site of chromosomal translocations including t(8;21)(q22;q22) in acute myeloid leukemia (7), t(3;21)(q26;q22) in myelodysplasia and blast crisis of chronic myelogenous leukemia (8, 9), and t(12;21)(p13;q22) in pre-B cell acute lymphocytic leukemia (10, 11).
The Pebp2 transcription factor is believed to play an important role in the regulation of hematopoiesis. Pebp2 binding sites have been identified in a large number of genes that function in blood cell development (5, 6). Pebp2 appears to regulate these genes in concert with other transcription factors, including proteins of the Myb, Ets, and C/EBP families (12). Evidence supporting a central role for Pebp2 in hematopoietic development was provided by gene knockout experiments. Homozygous disruption of either the Pebp2αB/Cbfa or the Pebp2β/Cbfb gene blocks the development of definitive hematopoiesis, and mice lacking either of these genes die between days 11.5 and 13.5 of gestation (13–16). The effect of the Pebp2βSmmhc fusion protein on hematopoiesis was investigated by inserting the 3′ part of the human MYH11 cDNA into the mouse Pebp2β gene in mouse embryonic stem cells (17). The authors demonstrated that expression of Pebp2βMYH11 during embryonic development can, like the loss of Pebp2αB or Pebp2β, abrogate definitive hematopoiesis. These results suggested that Pebp2βSmmhc can exhibit dominant negative activity. However, because embryonic stem cells carrying the Pebp2βMYH11 allele did not contribute to mature hematopoietic tissues, the effects of the fusion gene on myeloid differentiation could not be assessed.
To examine the effects of Pebp2βSmmhc on myelopoiesis we generated transgenic mice in which expression of Pebp2βSmmhc was targeted to myeloid cells. Our results demonstrate that Pebp2βSmmhc impairs neutrophilic maturation and can cooperate with activated Ras to promote markedly aberrant neutrophilic differentiation.
MATERIALS AND METHODS
Generation of Transgenic Mice.
A human PEBP2βMYH11 cDNA (18) was cloned into the hMRP8 expression cassette (19). The XbaI fragment containing the PEBP2βMYH11 cDNA was recloned into pBluescript II KS+ (Stratagene) so that a BamHI fragment containing the cDNA then could be transferred into the BglII site of the hMRP8 cassette. hMRP8-NRASG12D was similarly prepared by using a BamHI fragment containing the NRASG12D cDNA. Transgenic animals were prepared following standard procedures (20) from inbred FVB/N mice (21).
Western Blotting.
Control cell lines were generated by cloning lacZ and PEBP2βMYH11 cDNAs into the MSCV v2.1 retroviral vector (22), transfecting the cDNAs into BOSC23 cells to generate retroviral stocks (23), followed by infection and selection of pools of NIH 3T3 cells (24). Western blotting was performed as described (25) with rabbit polyclonal antiserum raised against Pebp2β (18). Whole-cell lysates of tissue culture fibroblasts and of tissues from control and transgenic mice were subjected to denaturing PAGE on an 8% SDS-polyacrylamide gel and then transferred to nitrocellulose.
Isolation of Cells from Tissues.
Blood was obtained from anesthetized animals by venipuncture of the retro-orbital venous plexus. Bone marrow was obtained by flushing Hank’s balanced salt solution through mouse long bones, followed by filtering through nylon mesh. When necessary, red cells were lysed with ammonium chloride potassium lysing buffer (26). Blood smears, bone marrow smears, and cytospins were prepared according to standard hematological techniques.
Immunofluorescence.
Cytospins of bone marrow cells were fixed for 20 min in 3.7% paraformaldehyde in PBS and permeabilized for 10 min with 0.1% Nonidet P-40 in PBS. Samples were blocked for 15 min in PBS with 10% normal goat serum (NGS) and incubated for 1 hr with the rabbit polyclonal antiserum raised against Pebp2β diluted 1:200 in PBS/NGS. Washing with PBS/NGS was followed by 30 min of incubation with Texas Red-labeled goat anti-rabbit IgG (Southern Biotechnology Associates) at 1:800 in PBS/NGS. The slides were washed with PBS/NGS and mounted in Prolong medium (Molecular Probes) plus 0.1 μg/ml of Hoechst33258.
Cell Staining and Statistical Analyses.
Slides were stained with Wright-Giemsa and Azure B dyes (Curtin Matheson Scientific, Houston) according to the manufacturer’s directions. Differential cell counts were performed without knowledge of specimen identifications. Statistical comparisons were done by using the Student’s t test. Results are shown as arithmetic means ± SD. Morphologic dysplasia of bone marrow neutrophlilic cells was quantitatively assessed by performing differential cell counts (total of 400 cells each) on bone marrow smears. Percentages of total mature neutrophilic cells (normal mature ring forms, aberrant band forms, and polymorphonuclear forms) with dysplastic features (band forms and forms with bi-lobed or multi-lobed nuclei) were determined.
Peripheral Blood Counts.
Blood collected from 7-to-9-week-old mice was analyzed on a Technicon H-3 automated hematology analyzer to assess white blood cell counts, hemoglobin, and platelet counts by using the standard software for clinical analysis. The Technicon H-3 uses a cytochemical assay to measure leukocyte myeloperoxidase (27). Differential white blood cell counts (total of 200 cells each) were performed on peripheral blood smears. The proportions of cells morphologically identified as lymphocytic, neutrophilic, monocytic, and eosinophilic were multiplied by total white blood cell counts to obtain absolute numbers.
Density Fractionation.
Bone marrow cells were separated by density gradient fractionation by using a modification of a previously published method (28). Percoll (Pharmacia Biotech) solutions (45%, 62%, and 81%) were prepared as previously described. After red blood cell lysis, 1 × 10⁷ nucleated bone marrow cells were resuspended in 1 ml of 45% Percoll solution and layered onto a step-gradient composed of 1 ml of 62% Percoll solution and 1 ml of 81% Percoll solution in 12 × 75 mm polystyrene tubes. The samples were centrifuged at approximately 1,600 g for 30 min at 10°C. Cells were harvested from the two interfaces and counted, and cytospins were prepared. Total cell counts and differential counts were used to calculate the mean percentages of neutrophilic cells present in the high density fractions.
Methylcellulose Cultures of Bone Marrow.
Bone marrow cells were cultured in duplicate in 35-mm Petri dishes in Methocult M3230 methylcellulose medium (StemCell Technologies, Vancouver, BC) supplemented with either 2% pokeweed mitogen spleen conditioned media (PWM-SCM) (StemCell Technologies), 50 units/ml of granulocyte colony-stimulating factor (G-CSF) (Boehringer Mannheim), or 20 ng/ml of granulocyte/macrophage (GM)-CSF (StemCell Technologies). One-milliliter cultures contained either 5 × 10⁴ (PWM-SCM, G-CSF, GM-CSF) or 2.5 × 10⁵ (G-CSF) viable bone marrow cells. Cultures were examined at 7 days. Colonies were counted on an inverted light microscope. Duplicate plates were averaged. Cells were harvested, pelleted, washed once in Hank’s balanced salt solution, and counted before the preparation of cytospins. Differential cell counts (total of 400 cells each) were performed to assess percentages and absolute numbers of neutrophilic cells.
Transplantation of Bone Marrow.
Bone marrow isolated from donors was transplanted into irradiated FVB/N mice as previously described (29).
RESULTS
Expression of PEBP2βMYH11 in Transgenic Mice.
The small calcium-binding protein Mrp8 is expressed in myeloid cells of the neutrophil and monocyte lineages (30). To examine the effects of the PEBP2βMYH11 fusion gene on myelopoiesis, we created mice that expressed a human PEBP2βMYH11 cDNA (18) from the hMRP8 promoter cassette (Fig. 1A). Injections into FVB/N embryos yielded four transgenic lines.
Figure 1.

(A) Map of the transgene. The PEBP2βMYH11 cDNA inserted into the BglII site of the human MRP8 promoter cassette corresponded to the most common inv(16) breakpoint. The nucleotide locations of the breakpoint within the coding sequences of PEBP2β and MYH11 are shown. White boxes represent noncoding portions of MRP8 exons. Solid lines represent 5′ and 3′ flanking sequences and intron 1 of MRP8. (B) Expression of the transgene. Whole-cell lysates were subjected to denaturing PAGE and Western blotting using a rabbit polyclonal anti-Pebp2β antiserum. The signal at 70 kDa corresponds to the Pebp2βSmmhc protein. The first two lanes are lysates of NIH 3T3 cells that contained retroviral vectors expressing either a lacZ or a PEBP2βMYH11 cDNA. The remaining lanes are lysates of tissues from control FVB/N mice or transgenic mice of lines Tg259 or Tg237. (C–F) Immunofluorescence of bone marrow neutrophilic cells. (C and D) Control. (E and F) Tg237. (C and E) Anti-Pebp2β antiserum. (D and F) Hoechst 33258. (Original magnification, ×250.)
As assessed by Western blot analysis with a polyclonal anti-Pebp2β antiserum (18), the transgene was highly expressed in bone marrow cells of lines Tg259 and Tg237. Only trace amounts of the chimeric protein were detected in spleen cells consistent with a lack of expression in lymphocytes. No expression of the transgene was found in thymus or liver (Fig. 1B). These results corresponded to the described myeloid expression pattern for the hMRP8 promoter cassette. By Western blot analysis, line Tg237 expressed higher levels of the Pebp2βSmmhc fusion protein than did line Tg259. Only low levels of expression were observed in cells derived from our other two transgenic lines, and those lines were not further analyzed.
Immunofluorescent study of bone marrow cells derived from control and Tg237 transgenic mice revealed expression in transgenic neutrophilic cells with characteristic ring-shaped nuclei (Fig. 1 C–F). Pebp2βSmmhc has been reported to be localized to the cytoplasm and to the nucleus (18, 31–33). A speckled and rod-like nuclear staining, similar to a pattern previously observed in some but not all cell types (32), was observed in neutrophilic cells from transgenic (Fig. 1E) but not control (Fig. 1C) bone marrow.
PEBP2βMYH11 Transgenic Mice Are Healthy and Maintain Normal Numbers of Peripheral Blood Neutrophils.
Expression of PEBP2βMYH11 from native PEBP2β control elements has been reported to abrogate definitive hematopoiesis and result in embryonic lethality (17). However, by driving expression of PEBP2βMYH11 from the hMRP8 promoter element that is not expressed in hematopoietic stem cells (E.L., unpublished data) we were able to derive healthy mice that expressed high levels of the Pebp2βSmmhc protein in their bone marrow. The peripheral blood cell counts of these mice were normal, including normal numbers of circulating mature neutrophils (data not shown). The morphology of these transgenic neutrophils differed from that of control neutrophils (Fig. 2 A and B). Most normal mature murine neutrophils exhibit ring-form nuclei with nuclear appendages and condensed chromatin (34). The chromatin of the transgenic neutrophils was smoother than that of control cells and nuclear appendages were less frequent.
Figure 2.
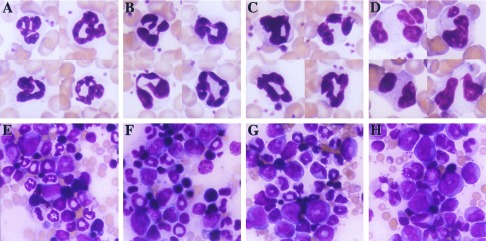
Aberrant neutrophilic maturation in PEBP2βMYH11 transgenic mice. (A and E) Samples from control mice. (B and F) Samples from PEBP2βMYH11 transgenic mice (line Tg237). (C and G) Samples from NRASG12D transgenic mice (line Tg7). (D and H) Samples from PEBP2βMYH11/NRASG12D double transgenic mice. (A–D) Peripheral blood neutrophils. (E–H) Bone marrow. (Original magnification, ×250.)
More than 100 transgenic mice were observed for more than 15 months. During this time a few sporadic malignancies arose. Because these malignancies were rare and only one was myeloid, they could not be attributed to the presence of the transgene.
PEBP2βMYH11 Transgenic Mice Exhibit Alterations in Neutrophilic Differentiation in Vivo.
Morphologic examination of the bone marrows of control and transgenic mice revealed a relative increase in immature neutrophilic cells in transgenic samples (Fig. 2 E and F and Fig. 3A). This shift resulted in a significant difference in the ratios of mature to immature neutrophilic cells in transgenic as compared with control mice (Fig. 3A, Inset).
Figure 3.

(A) Bone marrow differential cell counts. Differential cell counts (total of 400 cells each) were performed on bone marrow smears. Data are shown as arithmetic means ± SD. Pro, promyelocytes; Immature Neut, neutrophilic myelocytes and metamyelocytes; Mature Neut, neutrophilic band, mature ring, and polymorphonuclear forms; Eryth, nucleated erythroid cells; Lymph, lymphocytes; Eosin, eosinophilic cells. Control, n = 6; Tg259, n = 6; Tg237, n = 6. (Inset) Ratios of mature to immature neutrophilic cells. ∗ indicates a significant shift toward immature cells is present in the bone marrow of the transgenic mice, P = 0.004. (B) Density of bone marrow neutrophilic cells. Bone marrow cells were separated into low and high density fractions on a Percoll step gradient. Total numbers of cells present in each fraction were determined. Differential cell counts (total of 100 cells each) were performed on cytospins of each fraction, with cells morphologically identified as neutrophilic (neutrophilic myelocytes, metamyelocytes, ring, band, and polymorphonuclear forms) or nonneutrophilic. Total cell counts and differential counts were used to calculate the mean percentages of neutrophilic cells present in the high density fractions. Data are shown as arithmetic means ± SD. Control, n = 7; Tg259, n = 5; Tg237, n = 6. †, Control vs. Tg259, P = 0.0006. ‡, Control vs. Tg237, P = 0.00002; Tg259 vs. Tg237, P = 0.002.
The morphology of the transgenic neutrophilic cells was different from that of control cells, and we speculated that the PEBP2βMYH11 transgene might be affecting neutrophilic maturation in additional ways that were not visually apparent. Because the buoyant density of normal neutrophils increases as they accumulate secondary granules and mature, we compared the density of bone marrow neutrophilic cells of control and transgenic mice. Bone marrows were analyzed by using a two-step Percoll density gradient. In this assay, erythroid, lymphoid, and early myeloid cells of normal bone marrow sediment in a lower density fraction, whereas most maturing neutrophilic cells sediment in a higher density fraction. In the PEBP2βMYH11 transgenics there was a conspicuous decrease in the density of maturing neutrophilic cells (Fig. 3B). The decrease in density was more pronounced in transgenic line Tg237 than in line Tg259, corresponding with the relative levels of transgene expression.
Pebp2 has been reported to regulate transcription of the neutrophil myeloperoxidase gene (35). Although we have not rigorously quantified levels of myeloperoxidase in neutrophils of transgenic mice, the results obtained with a Technicon H-3 automated cell counter showed that myeloperoxidase was present in peripheral blood neutrophils of the transgenic mice and that the level of expression was similar to that of control neutrophils (data not shown).
The PEBP2βMYH11 Transgene Inhibits Neutrophilic Differentiation in Vitro.
Although the PEBP2βMYH11 transgenic animals were able to maintain normal peripheral blood neutrophil numbers, we examined whether the transgene could exert more severe effects in vitro. Bone marrow cells were cultured in semi-solid methylcellulose medium supplemented with growth factors. Initially, cells were grown in a mix of cytokines provided by pokeweed mitogen spleen conditioned media. The numbers of colonies present in transgenic cultures did not differ from those of control cultures (control 89 ± 10, n = 3; Tg237 90 ± 8, n = 3) but when cells harvested from the semi-solid cultures were analyzed there was a decrease in the generation of neutrophilic cells. By morphologic examination fewer neutrophils were present in cultures of line Tg237 bone marrow than cultures of control bone marrow (control 11% ± 3%, Tg237 3% ± 0.2%, P = 0.04).
To further examine the effect of PEBP2βMYH11 on neutrophil differentiation in vitro, bone marrow of control and transgenic mice was cultured in the presence of G-CSF or GM-CSF; these conditions relatively enhanced the generation of neutrophils. Although numerous macrophages were present in all cultures, fewer neutrophils were observed in cultures of transgenic bone marrow than in cultures of control bone marrow (Table 1, Fig. 4). The differences in relative and absolute neutrophil numbers were statistically significant and the magnitude of inhibition corresponded with the level of transgene expression. Of note, neutrophils decreased despite a trend toward larger numbers of colony-forming units in the transgenic animals. In addition to a quantitative effect on neutrophil generation, qualitative differences were observed: neutrophilic cells that did appear in the transgenic cultures were more likely to display immature or atypical nuclear morphology and to have cytoplasmic vacuoles (Fig. 4, Insets).
Table 1.
Methylcellulose cultures
| Colonies | Neutrophils, % | Neutrophils, × 104/ml | |
|---|---|---|---|
| G-CSFa | |||
| Control | ND | 36 ± 9.0 | 8.0 ± 6.4 |
| Tg259 | ND | 17 ± 1.5, P = 0.07 | 5.2 ± 1.4, P = 0.48 |
| Tg237 | ND | 6 ± 2.0, P = 0.03 | 1.5 ± 0.5, P = 0.19 |
| G-CSFb | |||
| Control | 32.7 ± 8.0 | 39.5 ± 6.1 | 0.8 ± 0.1 |
| Tg259 | 45.7 ± 2.1, P = 0.10 | 25.5 ± 0.5, P = 0.06 | 0.5 ± 0.1, P = 0.05 |
| Tg237 | 44.3 ± 7.0, P = 0.13 | 6.3 ± 1.7, P = 0.008 | 0.1 ± 0.04, P = 0.008 |
| GM-CSFb | |||
| Control | 87 ± 8.9 | 37.7 ± 5.1 | 9.0 ± 0.9 |
| Tg259 | 119 ± 11.6, P = 0.02 | 21.3 ± 5.0, P = 0.02 | 5.0 ± 0.8, P = 0.005 |
| Tg237 | 114 ± 19.7, P = 0.13 | 9.8 ± 2.0, P = 0.005 | 2.2 ± 0.8, P = 0.0006 |
Data were derived from independent experiments a and b. Data were derived from results with three mice in each group in each experiment. P values, transgenic mice compared to control mice. ND, not determined.
Cells were plated at 2.5 × 10⁵/ml.
Cells were plated at 5.0 × 10⁴/ml.
Figure 4.

Morphology of bone marrow cells cultured in vitro. Bone marrow cells were grown in semisolid methylcellulose medium in the presence of G-CSF at 2.5 × 10⁵ cells/ml for 7 days, and cytospins of harvested cells were prepared. Numerous macrophages (arrow) and neutrophilic cells (arrowhead) were observed in the control samples. Neutrophilic cells were decreased in the samples from transgenic mice. (Insets) Neutrophil morphology. Neutrophils derived in vitro from the bone marrows of transgenic mice exhibited atypical morphology. (Original magnification, ×250.)
PEBP2βMYH11 Cooperates with Activated NRAS to Foster Aberrant Neutrophilic Maturation.
Activating mutations of the RAS protooncogenes are common in myelodysplasia and acute myeloid leukemia (36). This observation and a previous report showing that the bone marrow of some patients with inv(16) contained RAS mutations (37) suggested that these molecular alterations might cooperate in leukemogenesis. To test this hypothesis, we crossed the PEBP2βMYH11 transgenic mice with FVB/N transgenic mice generated in our laboratory that expressed activated NRAS (NRASG12D) under the control of the hMRP8 promoter.
Our hMRP8-NRASG12D transgenic mice overexpressed NRas in their bone marrow as assessed by Western blot analysis with an anti-NRas antiserum (data not shown). There was a relative increase in immature neutrophilic cells in the bone marrow of these transgenics, and the morphology of these cells was slightly atypical (Fig. 2 C and G), but the mice did not develop acute myeloid leukemia. In addition, presumably because of transgene expression in the epidermis, the NRASG12D transgenic mice developed abnormal hyperkeratotic skin lesions. Hyperkeratotic skin often became secondarily infected with fecal flora and thereby promoted an intense reactive proliferation of myeloid cells, especially in the line of NRASG12D transgenic mice that expressed the highest level of activated Ras protein, line Tg7 (data not shown).
When the Tg7 NRASG12D transgene was combined with the Tg237 PEBP2βMYH11 transgene, neutrophilic cells of the doubly transgenic mice exhibited markedly aberrant morphology (Fig. 2 D and H). In normal murine bone marrow, most immature neutrophils have ring-shaped nuclei (34) and the nuclei of mature neutrophils display condensed chromatin with complex twisted shapes. Band-form, bi-lobed, and multi-lobed nuclei are unusual. In doubly transgenic bone marrow, numerous immature neutrophils had band-form nuclei and mature nuclei displayed abnormally smooth chromatin. Bi-lobed neutrophils were common, and nuclei with multiple segments were seen. The abnormalities observed were reminiscent of those seen in the human myelodysplastic syndromes and may represent a murine version of dysgranulopoiesis.
PEBP2βMYH11 transgenic mice did not themselves exhibit skin abnormalities. However, the skin lesions that developed in the doubly transgenic animals interfered with analysis of the combined effects of the transgenes on the hematopoietic system by stimulating myeloid hyperplasia and by limiting the lifespans of the mice. To assess the impact of the combination of PEBP2βMYH11 and NRASG12D transgenes in the absence of skin lesions, we transplanted doubly transgenic bone marrow into lethally irradiated nontransgenic FVB/N mice. None of the 28 recipients of doubly transgenic bone marrow developed acute leukemia over the course of 15 months. The bone marrow of 11 mice reconstituted with doubly transgenic cells was examined morphologically. Similar to what we observed in nontransplanted doubly transgenic animals, these bone marrow displayed a relative increase in immature neutrophilic cells and aberrant neutrophilic differentiation. The percentage of total mature neutrophils with dysplastic morphology (see Materials and Methods for definitions) was increased significantly in the recipients of doubly transgenic bone marrow when compared with recipients of control bone marrow (control 4.0 ± 1.4%, n = 4; doubly trangenic mice 79 ± 15%, n = 11; P < 0.00001). Neutrophil dysplasia was also more prominent when the doubly transgenic mice were compared with mice carrying single transgenes (Tg237 11 ± 2.7%, n = 4, P < 0.00001; Tg7 16.5 ± 8.4%, P < 0.00001).
DISCUSSION
Pebp2βSmmhc Impairs but Does Not Block Neutrophilic Differentiation.
By expressing Pebp2βSmmhc in myeloid cells of transgenic mice we have demonstrated that this leukemia-associated chimeric protein impairs but does not block neutrophil development. The PEBP2βMYH11 transgenic mice maintained normal numbers of circulating neutrophils. Immature neutrophilic cells were increased in the bone marrow of transgenic animals, and those cells exhibited qualitative abnormalities. In vitro, a decrease in the generation of neutrophils from transgenic bone marrow was observed in methylcellulose cultures.
The effects of the transgene on neutrophil differentiation depended on conditions. Although moderate effects of Pebp2βSmmhc were seen under baseline conditions in transgenic mice, marked effects were observed in colony assays, and the in vivo effects of the chimeric protein were enhanced by the presence of activated Ras. Another demonstration that the effects of Pebp2βSmmhc on neutrophil differentiation are context dependent is provided by comparing our results with those obtained by expressing Pebp2βSmmhc in the 32Dcl3 myeloid cell line. Pebp2βSmmhc slowed the growth of 32Dcl3 cells but did not impair their ability to differentiate to neutrophils in G-CSF (32).
Our results complement those obtained by targeting expression of Pebp2βMYH11 to the Pebp2β locus (17). By choosing a promoter that is not active in hematopoietic stem cells we have avoided the embryonic lethality seen in the previous study. Perhaps expression of Pebp2βSmmhc during the earliest stages of definitive hematopoiesis impairs a transcriptional program for which appropriate Pebp2 activity is absolutely required. Such impairment may prevent the development of cells normally destined to form the definitive hematopoietic system. Additional data derived from the Pebp2βMYH11 “knock-in” mice indicated that Pebp2βSmmhc impaired but did not block the differentiation of primitive erythroid cells. Our results extend these data by demonstrating that Pebp2βSmmhc impairs the differentiation of myeloid cells, leukemias of which are associated with Pebp2βSmmhc expression.
Pebp2βSmmhc has been reported to interfere with normal Pebp2 activity and this is presumably the mechanism by which the chimeric protein exerts its effects (38). Although Pebp2βSmmhc may exhibit dominant negative activity (17), the effect of this chimeric protein on expression of Pebp2 targets in primary cells has not been reported. We have observed that the peripheral blood neutrophils of MRP8-PEBP2βMYH11 transgenic mice contain normal levels of myeloperoxidase activity, the gene for which is regulated by Pebp2. Thus, Pebp2βSmmhc does not in this setting appear to dominantly inhibit Mpo transcription. The effects of the protein on mRNA expression are likely to be complex and dependent on promoter, cell type, and the presence of alterations in other regulators of transcription. Of note, expression of myeloperoxidase in the 32Dcl3 cell line was also unimpaired by Pebp2βSmmhc (32).
We did not observe an increase in eosinophils either in vitro or in vivo. The significance of this result is unclear. Not all leukemias expressing PEBP2βMYH11 exhibit prominent eosinophilia (4). However, our result may reflect the fact that the hMRP8 promoter is not active in normal eosinophils (E.L., unpublished data).
The fact that the transgenic mice maintained normal neutrophil numbers points to the presence of homeostatic mechanisms that can compensate for the antidifferentiative effects of Pebp2βSmmhc. These results are similar to what has been observed in a number of studies of transgenic mice including Eμ-c-MYC and MRP8-PMLRARα transgenics. The abnormal expression of a protein associated with a malignancy of a particular cell type can impair maturation of cells of that lineage, but additional changes are required to create the severe impairment of differentiation that is characteristic of acute leukemia (29, 39).
PEBP2βMYH11 Can Contribute to Myelodysplasia.
Alterations of the PEBP2αB and PEBP2β genes have been associated with myelodysplasia (8, 40–43). Neutrophils generated in vitro from PEBP2βMYH11 transgenic bone marrow displayed unusual morphology. In vivo, nuclear and cytoplasmic maturation of neutrophils was impaired, indicative of dysplastic differentiation. Furthermore, mice that expressed both PEBP2βMYH11 and activated RAS transgenes had neutrophilic cells that were morphologically aberrant. The unusual nuclear morphologies present in these mice were reminiscent of the dysplastic morphologies seen in human myelodysplasia. Although we have not observed trilineage dysplasia in these mice, our findings provide direct evidence that Pebp2βSmmhc may contribute to dysplasia by disturbing neutrophil maturation. We speculate that myelodysplasia is the result of genetic changes that impair differentiation in combination with additional changes that limit the ability of the bone marrow to compensate for such impairment.
Our results contribute to an understanding of the abnormal morphologies observed in human leukemia. The acute leukemias associated with inv(16) can exhibit dysplastic neutrophilic cells in association with the leukemic blasts. Our results indicate that Pebp2βSmmhc expression contributes to this accompanying dysplasia. A recent report showed that Pebp2αB-Eto/Aml1-Eto also can contribute to dysplastic differentiation of hematopoietic progenitors (44).
Although we expressed the Pebp2βSmmhc protein in the myeloid cells of transgenic mice and observed a large number of these mice for longer than 1 year, the mice did not develop acute myeloid leukemia. One potential explanation for the lack of malignancies is that we have not expressed the protein at high enough levels in the appropriate early myelomonocytic progenitor cells. This possibility cannot be excluded, despite the fact that the transgene appeared to influence the differentiation of these progenitors in vitro. It is possible, however, that there is a biological reason for the absence of leukemias. For example, the inversion of chromosome 16 might not be the first event in leukemogenesis but may instead arise in cells that already contain other genetic abnormalities. Reversing the order of these events might preclude leukemogenesis.
Our results provide direct evidence that genetic alterations of the Pebp2/Cbf transcription factor can contribute to dysplastic changes in myeloid cells and thereby might play a role in both the pathogenesis of myelodysplasia and in the dysplastic morphologies that can accompany acute nonlymphocytic leukemias. Our results also suggest that one mechanism by which inv(16)(p13;q22) contributes to leukemogenesis is by inhibiting differentiation.
Acknowledgments
We thank Daphne Haas-Kogan for suggestions and support, Lois Koren and Nadya Milshteyn for technical assistance, Robert Hawley for the MSCV retroviral vector, Kevin Shannon and Clifford Lowell for critical reading of the manuscript, Diane Brown for discussions and assistance, and members of the Bishop laboratory for ongoing counsel. This work was supported by Grant CA 4338 from the National Institutes of Health and by funds from the G. W. Hooper Research Foundation (to J.M.B.). S.C.K. was supported by a physician fellowship from the Howard Hughes Medical Institute.
ABBREVIATIONS
- Smmhc
smooth muscle myosin heavy chain
- G
granulocyte
- GM
granulocyte/macrophage
- CSF
colony-stimulating factor
References
- 1. Pedersen-Bjergaard J, Rowley J D. Blood. 1994;83:2780–2786. [PubMed] [Google Scholar]
- 2.Liu P, Tarle S A, Hajra A, Claxton D F, Marlton P, Freedman M, Siciliano M J, Collins F S. Science. 1993;261:1041–1044. doi: 10.1126/science.8351518. [DOI] [PubMed] [Google Scholar]
- 3.Le Beau M M, Larson R A, Bitter M A, Vardiman J W, Golomb H M, Rowley J D. N Engl J Med. 1983;309:630–636. doi: 10.1056/NEJM198309153091103. [DOI] [PubMed] [Google Scholar]
- 4.Langabeer S E, Walker H, Gale R E, Wheatley K, Burnett A K, Goldstone A H, Linch D C. Br J Haematol. 1997;96:736–739. doi: 10.1046/j.1365-2141.1997.d01-2096.x. [DOI] [PubMed] [Google Scholar]
- 5.Speck N A, Stacy T. In: Critical Reviews in Eukaryotic Gene Expression. Stein G S, Stein J L, Lian J B, editors. New York: Begell House; 1995. pp. 337–364. [Google Scholar]
- 6.Ito Y, Bae S C. In: Oncogenes as Transcriptional Regulators. Yaniv M, Ghysdael J, editors. Vol. 2. Basel: Birkhauser Verlag; 1997. pp. 107–132. [Google Scholar]
- 7.Miyoshi H, Shimizu K, Kozu T, Maseki N, Kaneko Y, Ohki M. Proc Natl Acad Sci USA. 1991;88:10431–10434. doi: 10.1073/pnas.88.23.10431. [DOI] [PMC free article] [PubMed] [Google Scholar]
- 8.Nucifora G, Begy C R, Erickson P, Drabkin H A, Rowley J D. Proc Natl Acad Sci USA. 1993;90:7784–7788. doi: 10.1073/pnas.90.16.7784. [DOI] [PMC free article] [PubMed] [Google Scholar]
- 9.Mitani K, Ogawa S, Tanaka T, Miyoshi H, Kurokawa M, Mano H, Yazaki Y, Ohki M, Hirai H. EMBO J. 1994;13:504–510. doi: 10.1002/j.1460-2075.1994.tb06288.x. [DOI] [PMC free article] [PubMed] [Google Scholar]
- 10.Romana S P, Poirel H, Leconiat M, Flexor M A, Mauchauffe M, Jonveaux P, Macintyre E A, Berger R, Bernard O A. Blood. 1995;86:4263–4269. [PubMed] [Google Scholar]
- 11.Golub T R, Barker G F, Bohlander S K, Hiebert S W, Ward D C, Bray-Ward P, Morgan E, Raimondi S C, Rowley J D, Gilliland D G. Proc Natl Acad Sci USA. 1995;92:4917–4921. doi: 10.1073/pnas.92.11.4917. [DOI] [PMC free article] [PubMed] [Google Scholar]
- 12.Friedman A D. Curr Top Microbiol Immunol. 1996;211:149–157. doi: 10.1007/978-3-642-85232-9_15. [DOI] [PubMed] [Google Scholar]
- 13.Okuda T, van Deursen J, Hiebert S W, Grosveld G, Downing J R. Cell. 1996;84:321–330. doi: 10.1016/s0092-8674(00)80986-1. [DOI] [PubMed] [Google Scholar]
- 14.Wang Q, Stacy T, Binder M, Marin-Padilla M, Sharpe A H, Speck N A. Proc Natl Acad Sci USA. 1996;93:3444–3449. doi: 10.1073/pnas.93.8.3444. [DOI] [PMC free article] [PubMed] [Google Scholar]
- 15.Wang Q, Stacy T, Miller J D, Lewis A F, Gu T L, Huang X, Bushweller J H, Bories J C, Alt F W, Ryan G, et al. Cell. 1996;87:697–708. doi: 10.1016/s0092-8674(00)81389-6. [DOI] [PubMed] [Google Scholar]
- 16.Niki M, Okada H, Takano H, Kuno J, Tani K, Hibino H, Asano S, Ito Y, Satake M, Noda T. Proc Natl Acad Sci USA. 1997;94:5697–5702. doi: 10.1073/pnas.94.11.5697. [DOI] [PMC free article] [PubMed] [Google Scholar]
- 17.Castilla L H, Wijmenga C, Wang Q, Stacy T, Speck N A, Eckhaus M, Marin-Padilla M, Collins F S, Wynshaw-Boris A, Liu P P. Cell. 1996;87:687–696. doi: 10.1016/s0092-8674(00)81388-4. [DOI] [PubMed] [Google Scholar]
- 18.Lu J, Maruyama M, Satake M, Bae S C, Ogawa E, Kagoshima H, Shigesada K, Ito Y. Mol Cell Biol. 1995;15:1651–1661. doi: 10.1128/mcb.15.3.1651. [DOI] [PMC free article] [PubMed] [Google Scholar]
- 19.Lagasse E, Weissman I L. J Exp Med. 1994;179:1047–1052. doi: 10.1084/jem.179.3.1047. [DOI] [PMC free article] [PubMed] [Google Scholar]
- 20.Hogan B, Constantini F, Lacy E. Manipulating the Mouse Embryo: A Laboratory Manual. Plainview, NY: Cold Spring Harbor Lab. Press; 1994. [Google Scholar]
- 21.Taketo M, Schroeder A C, Mobraaten L E, Gunning K B, Hanten G, Fox R R, Roderick T H, Stewart C L, Lilly F, Hansen C T, Overbeek P A. Proc Natl Acad Sci USA. 1991;88:2065–2069. doi: 10.1073/pnas.88.6.2065. [DOI] [PMC free article] [PubMed] [Google Scholar]
- 22.Hawley R G, Fong A Z, Burns B F, Hawley T S. J Exp Med. 1992;176:1149–1163. doi: 10.1084/jem.176.4.1149. [DOI] [PMC free article] [PubMed] [Google Scholar]
- 23.Pear W S, Nolan G P, Scott M L, Baltimore D. Proc Natl Acad Sci USA. 1993;90:8392–8396. doi: 10.1073/pnas.90.18.8392. [DOI] [PMC free article] [PubMed] [Google Scholar]
- 24.Cepko C. In: Current Protocols in Molecular Biology. Ausubel F M, Brent R, Kingston R E, Moore D D, Seidman J G, Smith J A, Struhl K, editors. New York: Greene/Wiley Interscience; 1992. pp. 9.11.5–9.11.6. [Google Scholar]
- 25.Robbins S M, Quintrell N A, Bishop J M. Mol Cell Biol. 1995;15:3507–3515. doi: 10.1128/mcb.15.7.3507. [DOI] [PMC free article] [PubMed] [Google Scholar]
- 26.Kruisbeek A M. In: Current Protocols in Immunology. Coligan J E, Kruisbeek A M, Margulies D H, Shevach E M, Strober W, editors. New York: Greene/Wiley Interscience; 1993. p. 3.1.3. [Google Scholar]
- 27.Groner W. In: New Developments in Flow Cytochemistry Technology. Simson E, editor. Tarrytown, NY: Technicon Instruments; 1985. pp. 1–8. [Google Scholar]
- 28.Hart P H, Spencer L K, Nulsen M F, McDonald P J, Finlay-Jones J J. Infect Immun. 1986;51:936–941. doi: 10.1128/iai.51.3.936-941.1986. [DOI] [PMC free article] [PubMed] [Google Scholar]
- 29.Brown D, Kogan S, Lagasse E, Weissman I, Alcalay M, Pelicci P G, Atwater S, Bishop J M. Proc Natl Acad Sci USA. 1997;94:2551–2556. doi: 10.1073/pnas.94.6.2551. [DOI] [PMC free article] [PubMed] [Google Scholar]
- 30.Lagasse E, Weissman I L. Blood. 1992;79:1907–1915. [PubMed] [Google Scholar]
- 31.Liu P P, Wijmenga C, Hajra A, Blake T B, Kelley C A, Adelstein R S, Bagg A, Rector J, Cotelingam J, Willman C L, Collins F S. Genes Chromosomes Cancer. 1996;16:77–87. doi: 10.1002/(SICI)1098-2264(199606)16:2<77::AID-GCC1>3.0.CO;2-#. [DOI] [PubMed] [Google Scholar]
- 32.Cao W, Britos-Bray M, Claxton D F, Kelley C A, Speck N A, Liu P P, Friedman A D. Oncogene. 1997;15:1315–1327. doi: 10.1038/sj.onc.1201305. [DOI] [PubMed] [Google Scholar]
- 33.Kanno Y, Kanno T, Sakakura C, Bae S C, Ito Y. Mol Cell Biol. 1998;18:4252–4261. doi: 10.1128/mcb.18.7.4252. [DOI] [PMC free article] [PubMed] [Google Scholar]
- 34.Sanderson J H, Phillips C E. An Atlas of Laboratory Animal Haematology. Oxford: Clarendon; 1981. [Google Scholar]
- 35.Nuchprayoon I, Meyers S, Scott L M, Suzow J, Hiebert S, Friedman A D. Mol Cell Biol. 1994;14:5558–5568. doi: 10.1128/mcb.14.8.5558. [DOI] [PMC free article] [PubMed] [Google Scholar]
- 36.Liu E T. Clin Lab Med. 1990;10:797–807. [PubMed] [Google Scholar]
- 37.Tien H F, Wang C H, Lin M T, Lee F Y, Liu M C, Chuang S M, Chen Y C, Shen M C, Lin K H, Lin D T. Cancer Genet Cytogenet. 1995;84:60–68. doi: 10.1016/0165-4608(95)00084-4. [DOI] [PubMed] [Google Scholar]
- 38.Liu P, Seidel N, Bodine D, Speck N, Tarle S, Collins F S. Cold Spring Harbor Symp Quant Biol. 1994;59:547–553. doi: 10.1101/sqb.1994.059.01.061. [DOI] [PubMed] [Google Scholar]
- 39.Langdon W Y, Harris A W, Cory S, Adams J M. Cell. 1986;47:11–18. doi: 10.1016/0092-8674(86)90361-2. [DOI] [PubMed] [Google Scholar]
- 40.Abbondanzo S L, Gray R G, Whang-Peng J, Jacobson R J. Arch Pathol Lab Med. 1987;111:330–332. [PubMed] [Google Scholar]
- 41.Horiike S, Misawa S, Nishida K, Nishigaki H, Tsuda S, Taniwaki M, Takino T, Abe T. Acta Haematol. 1989;82:161–164. doi: 10.1159/000205368. [DOI] [PubMed] [Google Scholar]
- 42.Estey E, Trujillo J M, Cork A, O’Brien S, Beran M, Kantarjian H, Keating M, Freireich E J, Stass S. Hematol Pathol. 1992;6:43–48. [PubMed] [Google Scholar]
- 43.Taj A S, Ross F M, Vickers M, Choudhury D N, Harvey J F, Barber J C, Barton C, Smith A G. Br J Haematol. 1995;89:890–892. doi: 10.1111/j.1365-2141.1995.tb08429.x. [DOI] [PubMed] [Google Scholar]
- 44.Okuda T, Cai Z, Yang S, Lenny N, Lyu C J, van Deursen J M, Harada H, Downing J R. Blood. 1998;91:3134–3143. [PubMed] [Google Scholar]