Abstract
The endoplasmic reticulum (ER) can transform from a network of branching tubules into stacked membrane arrays (termed organized smooth ER [OSER]) in response to elevated levels of specific resident proteins, such as cytochrome b(5). Here, we have tagged OSER-inducing proteins with green fluorescent protein (GFP) to study OSER biogenesis and dynamics in living cells. Overexpression of these proteins induced formation of karmellae, whorls, and crystalloid OSER structures. Photobleaching experiments revealed that OSER-inducing proteins were highly mobile within OSER structures and could exchange between OSER structures and surrounding reticular ER. This indicated that binding interactions between proteins on apposing stacked membranes of OSER structures were not of high affinity. Addition of GFP, which undergoes low affinity, antiparallel dimerization, to the cytoplasmic domains of non–OSER-inducing resident ER proteins was sufficient to induce OSER structures when overexpressed, but addition of a nondimerizing GFP variant was not. These results point to a molecular mechanism for OSER biogenesis that involves weak homotypic interactions between cytoplasmic domains of proteins. This mechanism may underlie the formation of other stacked membrane structures within cells.
Keywords: endoplasmic reticulum; photobleaching; cytochrome b5; GFP; FRAP
Introduction
Eukaryotic cells are capable of adjusting the size, molecular composition, and architecture of their membranous organelles to adapt to changes in the environment. A classic example of organelle plasticity is the highly dynamic and interconnected network that constitutes the ER (Lee and Chen, 1988; Baumann and Walz, 2001). The size and structure of this compartment varies enormously in different cells. In cultured cells, the ER typically exists as a network of branching trijunctional tubules organized as polygons in which rough (ribosome covered) and smooth (ribosome free) domains are spatially interconnected. In certain tissues, the ER differentiates into smooth and rough domains that display different architectures. Professional protein secretors, such as plasma or exocrine pancreatic cells, are filled with tightly packed, ribosome-covered ER cisternae (rough ER), whereas in cells specialized for lipid metabolism (e.g., adrenocortical cells), the ER is developed as an abundant smooth-surface tubular network (anastomosing smooth ER; Fawcett, 1981; Baumann and Walz, 2001). Changes in the organization of the ER can occur quickly in response to external cues. For example, the smooth ER domains can expand rapidly and dramatically in response to the expression of xenobiotic metabolizing enzymes residing in the ER (Orrenius and Ericsson, 1966).
A striking example of ER differentiation is the conversion of reticular ER into sheets of smooth ER that become tightly stacked into arrays. These can be arranged as stacked cisternae on the outer nuclear envelope (NE; called karmellae; Smith and Blobel, 1994; Parrish et al., 1995; Koning et al., 1996) or be distributed elsewhere in the cell (called lamellae; Porter and Yamada, 1960; Abran and Dickson, 1992; Koning et al., 1996). Alternatively, they can take the form of compressed bodies of packed sinusoidal ER (Anderson et al., 1983), concentric membrane whorls (also called z-membranes in plants; Gong et al., 1996; Koning et al., 1996) or ordered arrays of membrane tubules/sheets with hexagonal or cubic symmetry (called crystalloid ER; Chin et al., 1982; Yamamoto et al., 1996). In all cases, the tripartite junctions of branching ER are scanty or lacking, and the cytoplasmic faces of the proliferated membranes are tightly apposed. EM studies have established that these structures connect to the rest of the ER (Chin et al., 1982; Gong et al., 1996; Yamamoto et al., 1996). Because the structures often appear adjacent to and segueing into each other in the same cell, the structures may represent different stages of smooth ER differentiation (Pathak et al., 1986; Takei et al., 1994). Given that all of these ER structures contain highly ordered smooth ER membranes we refer to them as organized smooth ER (OSER).
OSER structures have been reported in a variety of cells, tissues, and organisms including plants, fungi, and animals under physiological conditions (Porter and Yamada, 1960; Tabor and Fisher, 1983; Yorke and Dickson, 1985; Bassot and Nicola, 1987; Abran and Dickson, 1992; Wolf and Motzko, 1995; Gong et al., 1996), during drug treatments (Chin et al., 1982; Singer et al., 1988; Berciano et al., 2000), or by overexpression of resident ER transmembrane proteins (Wright et al., 1990; Vergeres et al., 1993; Smith and Blobel, 1994; Takei et al., 1994; Ohkuma et al., 1995; Gong et al., 1996; Yamamoto et al., 1996; Sandig et al., 1999). The basis for OSER formation under these conditions is not clear. Protein mutagenesis studies of OSER-inducing proteins, such as HMG CoA reductase, have suggested that the cytoplasmic domain of the protein is important for OSER formation (Profant et al., 1999). Furthermore, the OSER-inducing protein must be anchored to the ER via a transmembrane domain (TMD; Vergeres et al., 1993; Takei et al., 1994; Gong et al., 1996; Yamamoto et al., 1996; Fukuda et al., 2001). Therefore, one model for OSER biogenesis is that the cytoplasmic domains of OSER-inducing proteins on apposing membranes bind tightly to each other and “zipper” the apposing membranes together (Takei et al., 1994; Gong et al., 1996; Yamamoto et al., 1996; Fukuda et al., 2001). This model predicts that OSER-inducing proteins residing within OSER structures are tightly bound to each other and do not readily diffuse in and out of these structures.
Here, we have used OSER-inducing proteins, including cytochrome b(5) [b(5)], tagged with GFP to investigate aspects of OSER formation and dynamics in living cells. Our results reveal, contrary to predictions of existing models, that OSER-inducing proteins are not tightly bound to each other within OSER structures and they can readily diffuse in and out of these structures into surrounding reticular ER. Furthermore, time-lapse imaging of OSER biogenesis revealed that these structures formed relatively quickly once a threshold level of OSER-inducing proteins was present within cells and such formation involved gross remodeling of surrounding reticular ER. Finally, attachment of a protein capable of low affinity, head to tail dimerization (i.e., GFP) to the cytoplasmic domain of different resident ER membrane proteins was sufficient to induce OSER formation upon overexpression of the modified proteins in living cells. This suggested that homotypic low affinity interactions between cytoplasmic domains of proteins can differentiate reticular ER into stacked lamellae or crystalloid structures. Such a mechanism may underlie the reorganization of other organelles into stacked structures.
Results
Overexpressed b(5) or GFP-b(5) induces OSER formation
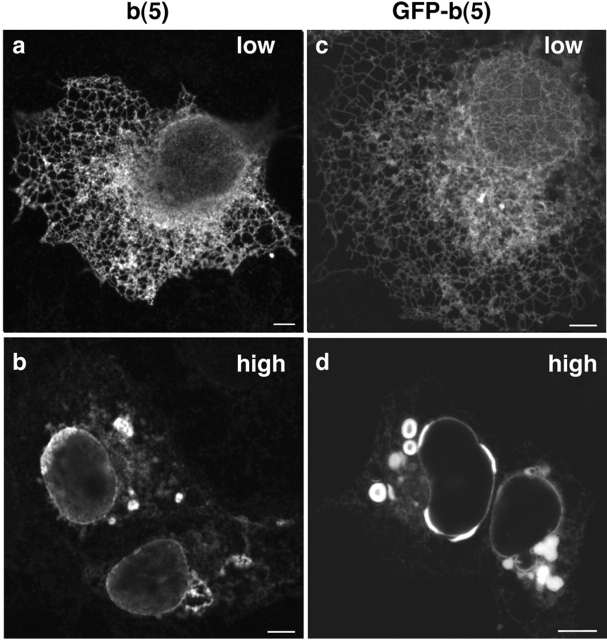
When the resident ER enzyme b(5) is overexpressed in yeast or mammalian cells, OSER structures comprised of whorls of membrane and NE associated “karmellae” are formed (Vergeres et al., 1993; Koning et al., 1996; Pedrazzini et al., 2000). To establish a system for studying OSER formation and dynamics in vivo we tested whether such structures formed in COS-7 cells expressing either b(5) or GFP-b(5) (Fig. 1). At low expression levels of either protein, the ER appeared as a network of branching tubules, typical of ER in tissue culture cells, with b(5) and GFP-b(5) distributed uniformly throughout this system (Fig. 1, a and c). This labeling pattern changed dramatically for cells expressing at least three times more protein (as judged by mean fluorescence intensity). Now, embedded within the reticular ER were bright oval or elongated objects distributed adjacent to the NE or out in the cell periphery (Fig. 1, b and d). Similar structures were observed in other cell types in which GFP-b(5) was overexpressed, including CV-1, MDCK, and 3T3 cells (unpublished data).
Figure 1.
Cells expressing b(5) or GFP-b(5) contain similar membrane structures. COS-7 cells transiently transfected with (a and b) b(5) or (c and d) GFP-b(5) overnight were imaged by (a–d) confocal microscopy. Fixed cells were labeled with (a and c) anti-b(5) and anti–rabbit Alexa 546 or observed (c and d) alive. At low levels of expression, b(5) and GFP-b(5) localize to a branching network of tubules (a and c). In cells expressing higher levels of protein, a number of intensely fluorescent nonbranching structures including whorls, open loops, accumulations on the NE, and nonbranching membrane accumulations are observed (b and d). Bars, 5 μm.
Transmission EM demonstrated that these bright structures corresponded to different forms of OSER (Fig. 2). They included stacks of cisternae apposed to the NE (short karmellae; Fig. 2 b), whorls, loops (partially open noncircularized whorls), lamellar arrays of stacked cisternae in peripheral locations (Fig. 2 a), and accumulations of undulating sinusoidal membranes (Fig. 2, a–d). The stacked cisternae were in continuity with sinusoidal ER (Fig. 2 a) and in some regions the membranes were organized into a lattice with square symmetry called crystalloid ER (Fig. 2 d; Chin et al., 1982; Pathak et al., 1986; Yamamoto et al., 1996). Frequently, mitochondria clustered around these OSER structures (Fig. 2 a). Adjacent cisternae were separated by a characteristic narrow cytoplasmic space (∼8 nm for b(5) and ∼11 nm for GFP-b(5)) that extended throughout the three-dimensional configuration of an OSER, similar to that reported in previous OSER studies (Vergeres et al., 1993; Takei et al., 1994). Based on these results, we concluded that overexpression of b(5) or GFP-b(5) was sufficient to induce the formation of OSER structures.
Figure 2.
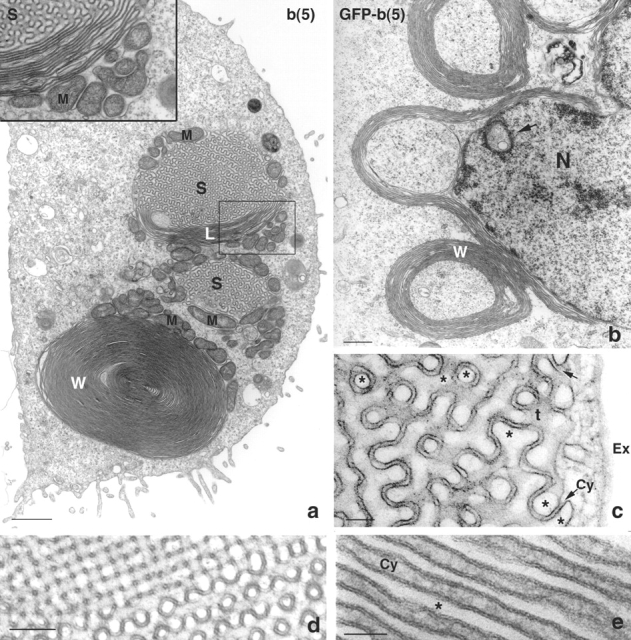
High resolution images of OSER. CV-1 cells transiently transfected with b(5) (a and d) or with GFP-b(5) (b, c, and e) were imaged by transmission EM. In panel a, a low power view of a transfected cells shows a whorl (W), and two areas of sinusoidal ER (S), of which one is in continuity with lamellar ER (L). Continuity between lamellar and sinusoidal ER is clearly visible in the inset, which shows an enlargement of the boxed area. Clusters of mitochondria (M) surround the whorl, the sinusoidal and the lamellar ER. In panel b, stacks of packed cisternae surround part of the nucleus (karmellae). Whorls appear to be peeling away from the juxtanuclear cisternae. N, nucleus. The arrow indicates an intranuclear whorl. Panel c shows a higher magnification of sinusoidal ER. An electron-dense cytoplasm of constant width (∼11 nm in the case of GFP-b(5)) separates pairs of apposed membranes. The arrows indicate points where the continuity between the electron-dense space and the cytoplasm (Cy) are apparent. The asterisks indicate the lumenal space. Ex, extracellular space; t, tangential view of membranes. In some areas of the cell, sinusoidal ER assumes a highly ordered arrangement with square symmetry (panel d). (e) A high magnification of lamellar ER, illustrating the regular succession of lumena (asterisk) and electron-dense cytoplasm of constant (∼11 nm) width (Cy). Bars: (a) 1 μm; (b) 0.5 μm; (c) 0.1 μm; (d) 0.2 μm; (e) 0.05 μm.
Immunofluorescent staining of the cells overexpressing GFP-b(5) revealed that the proteins residing within OSER structures were not restricted to GFP-b(5) but included typical resident ER proteins, including the lumenal chaperone proteins, calreticulin and protein disulfide isomerase, and the transmembrane chaperone protein, calnexin (Fig. 3). The relative staining intensity patterns of these proteins in OSER structures and in the surrounding reticular ER was similar to that observed for GFP-b(5). This suggested that GFP-b(5) was not significantly enriched in OSER structures compared with other resident ER proteins even though GFP-b(5) was responsible for inducing the formation of these structures. Consistent with their being of ER origin and function, OSER structures did not contain the Golgi marker βCOP (Fig. 3).
Figure 3.
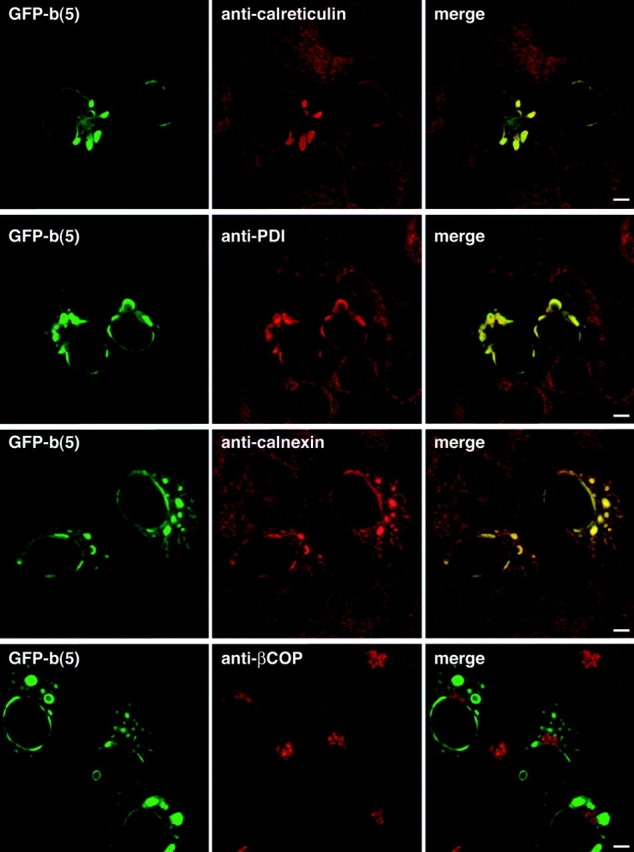
OSER structures do not exclude other resident ER proteins. COS-7 cells were transfected with GFP-b(5), fixed, and labeled with anticalreticulin, antiprotein disulfide isomerase, anticalnexin antibodies, and anti–rabbit Alexa 546. Untransfected cells or cells lacking OSER structures contain branching reticular ER tubules, which were readily labeled with the antibodies (not depicted). The merged images show strong colocalization (yellow) of the resident ER proteins and GFP-b(5). In contrast, cells labeled with anti-βCOP, a Golgi marker protein, contain no colocalized structures. Bars, 5 μm.
GFP-b(5) is highly mobile within OSER structures and diffuses rapidly in and out of these structures
Previous models of OSER biogenesis have suggested that tight binding of the cytoplasmic domains of OSER-inducing proteins on apposing membranes leads to the zippering of these membranes into stacked structures (Takei et al., 1994; Gong et al., 1996; Yamamoto et al., 1996; Fukuda et al., 2001; Fig. 4 a). A prediction of this model is that bound OSER-inducing proteins should experience significantly restricted mobility. To test this prediction in GFP-b(5) expressing cells, we photobleached half of the area of a typical OSER structure (∼0.5–3-μm diam) using intense laser light (Fig. 4 c). Fluorescence recovery by exchange of bleached for nonbleached protein was monitored using an attenuated laser beam. Notably, fluorescence recovered extremely rapidly into the bleached area at the expense of fluorescence in the nonbleached area of the OSER, as shown in the fluorescent images (Fig. 4 c) or as quantified in a plot of fluorescence recovery (Fig. 4, f and g). Because the prebleach ratio of fluorescence between bleached and nonbleached OSER sectors was reestablished, all GFP-b(5) molecules were highly mobile in OSER structures. These results indicated that GFP-b(5) molecules were not immobilized within OSER structures by tight cross-linking between proteins on adjacent membranes.
Figure 4.
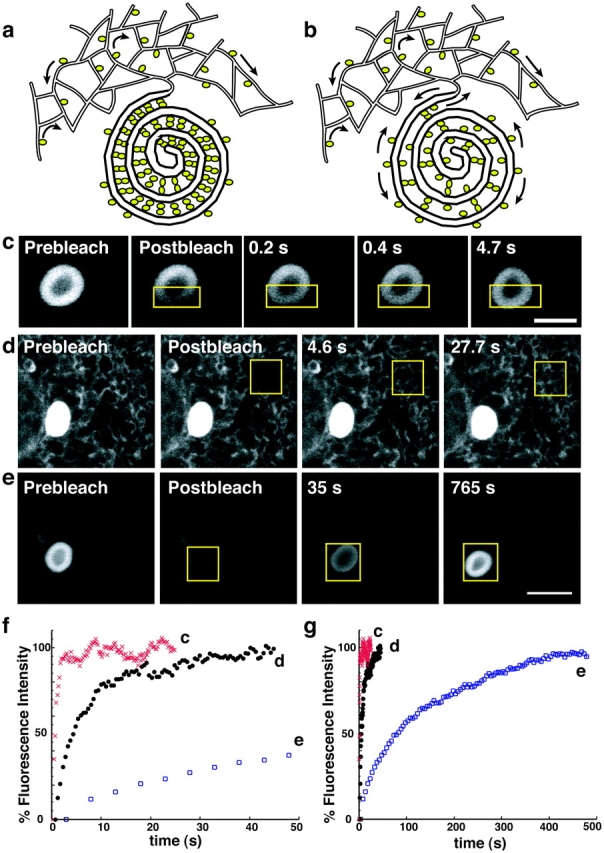
GFP-b(5) is mobile within and between OSER and branching reticular ER. Two different models are proposed to describe OSER formation. (a) OSER-inducing proteins zipper together apposing membranes by tight interactions between their cytoplasmic domains. In a related model, OSER- inducing proteins are restricted to and accumulate in discrete regions of the ER. In both cases, the OSER-inducing proteins would be predicted to be either immobile (as indicated by an absence of mobility arrows) or incapable of exchanging between OSER and branching reticular ER. (b) In an alternative model, OSER-inducing proteins partition dynamically. The OSER-inducing proteins would remain mobile (as indicated by mobility arrows in the branching ER and within OSER) and be capable of exchanging between OSER and branching reticular ER. To distinguish between the two models, cells expressing GFP-b(5) were photobleached in discrete regions of interest (yellow outline boxes), which were then monitored for fluorescence recovery. (c) GFP-b(5) is highly mobile within a whorl structure and recovers at a rate comparable to GFP-b(5) in branching ER. (d) GFP-b(5) is highly mobile within branching reticular ER and recovers rapidly. (e) When a whole whorl is photobleached, fluorescence recovery is observed, but much more slowly than within a whorl. (f and g) Fluorescence intensity recovery rates are plotted for (f) short and (g) longer times. Branching reticular ER (closed black circles), whole whorl (open blue squares), and strip within the whorl (red Xs). Bars: (c) 3 μm; (d and e) 5 μm.
Next, we examined whether OSER-inducing proteins like GFP-b(5) were capable of moving into and out of OSER structures. First, we established that GFP-b(5) could diffuse freely in the ER adjacent to an OSER. A 4-μm-wide box was photobleached in an area of ER outside of an OSER in GFP-b(5) expressing cells. Analysis of the recovery kinetics revealed GFP-b(5) diffused with an effective diffusion coefficient (D eff) of 0.47 ± 0.09 μm2/s (n = 8) and that 93.5 ± 1.9% of the molecules were mobile, similar to that reported for other highly mobile ER resident proteins (Lippincott-Schwartz et al., 2001). Next, we tested if GFP-b(5) could freely diffuse into and out of OSER structures. Upon photobleaching an entire OSER, fluorescence recovered within ∼6 min (Fig. 4 e), indicating that GFP-b(5) readily diffuses into OSER structures from surrounding ER membranes. When all cellular fluorescence outside an OSER was photobleached, subsequent imaging with nonbleaching irradiation revealed the fluorescence within nonbleached OSER structures redistributed into surrounding branching ER over time (unpublished data), which is consistent with free diffusion of GFP-b(5) in and out of OSER structures. Comparable results were observed upon photobleaching other types of OSER structures expressing GFP-b(5), including short karmellae, open loops, and intensely fluorescent clustered nonpolygonal branching ER structures corresponding to sinusoidal or crystalloid ER (unpublished data).
We found that the rate of fluorescence recovery into photobleached OSER structures was slower than for photobleached reticular ER of similar size (Fig. 4, f and g, compare curves d and e). This can be explained by the fact that there are substantially fewer branching connections between OSER membranes compared with reticular ER membranes (Fig. 2). Thus, once a protein enters an OSER, it dwells as a freely mobile protein within this structure for significantly longer periods than within other areas of surrounding reticular ER.
The role of protein interactions in OSER formation
These findings prompted us to explore models for OSER biogenesis that did not involve tight cross-linking and zippering of membrane proteins. The first clue favoring an alternative model (Fig. 4 b) was our finding that OSER structures could be generated in cells expressing elevated levels of GFP fused to b(5)'s TMD via a short linker region (GFP-truncated cytochrome b(5) containing amino acids 94–134 [b(5) tail]). In this chimera, b(5)'s cytoplasmic, enzymatic domain was removed (Fig. 5 a, GFP-b(5) tail) and GFP and the linker constituted the cytoplasmic domain. Overexpression of the construct in COS-7 cells resulted in the appearance of numerous brightly labeled circular and elongated masses that by EM appeared as membrane whorls and short karmellae, consistent with their being OSER structures (Fig. 5, b–d). In addition, another form of smooth ER, anastomosing smooth ER, was sometimes observed in continuity with lamellar ER stacks (Fig. 5 d, inset). These results indicated that the GFP-b(5) tail chimera could function as an OSER-inducing protein.
Figure 5.
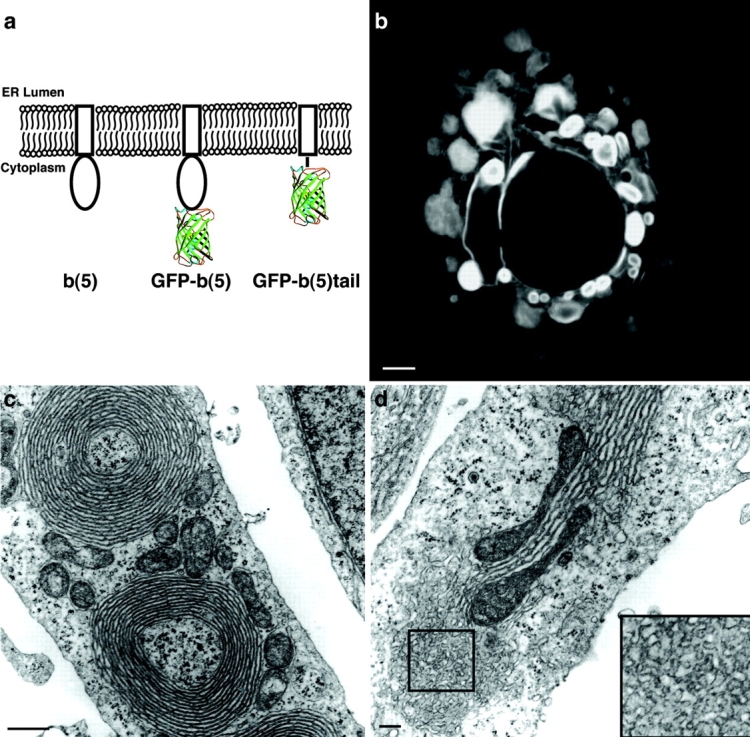
The b(5) catalytic domain of GFP-b(5) is not required to induce OSER formation. (a) The different domains of each b(5) derived construct are illustrated. The rectangle represents the tail domain of the rat ER isoform of b(5) (residues Pro94–Asp134), which includes the TMD. The oval represents the catalytic domain of b(5) (residues 1–93). In the GFP-b(5) construct, GFP is linked to the catalytic domain of b(5) via a synthetic linker comprising the myc epitope followed by a repeated Gly-Ser sequence. In the GFP-b(5) tail construct, GFP is connected via the same synthetic linker to the tail domain of b(5). The barrel structure represents GFP. Cells expressing high levels of GFP-b(5) tail contain OSER structures, which can be observed by confocal microscopy (b) and EM (c and d). (d) Several cells were observed to contain anastomosing smooth ER (shown at higher magnification in the inset) in continuity with stacked cisternae. Note, too, the tight apposition of the mitochondria with the stacked cisternae. Bars: (b) 5; (c) 0.5; (d) 0.2 μm.
GFP fused to the cytoplasmic domain of resident ER membrane proteins is sufficient to induce OSER formation
Given that the complete replacement of the cytoplasmic domain of b(5) with GFP was sufficient to induce OSER structures upon overexpression of the modified protein within cells, we asked whether overexpression of other ER resident proteins with GFP attached to their cytoplasmic domains could do likewise. To test this, we fused GFP or YFP to the cytoplasmic domains of three resident ER membrane proteins with minimal cytoplasmic domains: two rough ER components of the translocon, Sec61β and Sec61γ, and a truncated cytochrome P450 containing amino acids 1–29 (C1(1-29)P450; Szczesna-Skorupa et al., 1998; Fig. 6 a). The two Sec61 components are, like b(5), “tail-anchored” proteins that are posttranslationally inserted into the ER membrane with the COOH terminus in the ER lumen. Note that when overexpressed in cells, neither chimera was found to incorporate into translocons (unpublished data). The C1(1-29)P450 is co-translationally inserted with the NH2 terminus inserted into the ER lumen. Its signal sequence is not cleaved and serves as a TMD (Szczesna-Skorupa et al., 1998).
Figure 6.
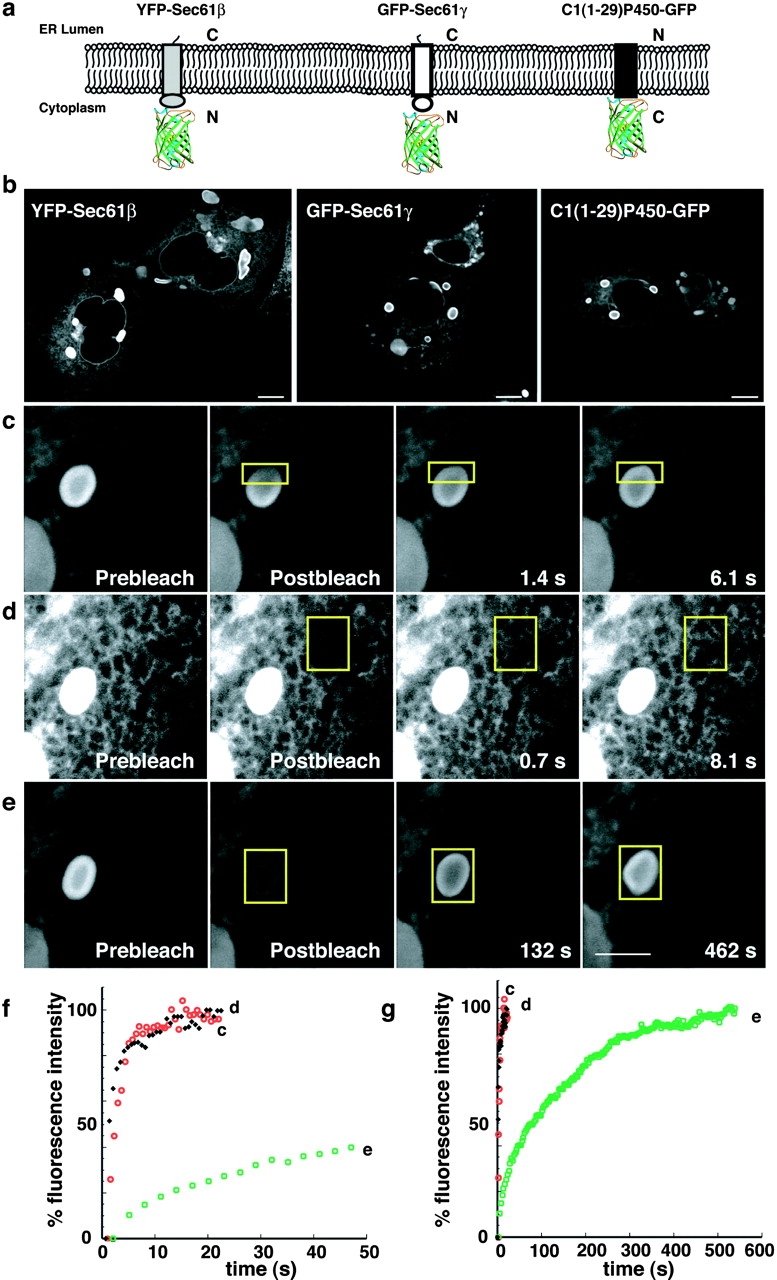
Resident ER membrane proteins tagged with GFP on their cytoplasmic domains can induce OSER formation. (a) Illustration of constructs and their orientations. The differently shaded rectangles represent the distinct single TMD resident ER proteins and the barrel structure represents GFP. (b) Representative confocal micrographs of cells expressing the GFP chimeras. (c) To visualize the mobility of the GFP chimeras within whorls a small region of interest (yellow outlined square) was photobleached and monitored for recovery (c). To compare the mobility of GFP chimeras between branching reticular ER (d) and exchange into and out of whorls (e), regions of interest (yellow outlined squares) of identical size were photobleached and monitored for recovery in cells expressing GFP-Sec61γ. Bars, 5 μm. (f and g) Fluorescence intensity recovery plots compare the rates of recovery of GFP-Sec61γ within the whorl (black diamonds), branching reticular ER (open red circle), and into the whole whorl (open green squares) for the image series in c, d, and e, respectively.
Confocal microscopy of transiently transfected living cells expressing these fusion proteins revealed two distribution patterns. One pattern, observed at low expression levels, was that characteristic of branching reticular ER (unpublished data). The second pattern, observed at high expression levels, was that of reticular ER in combination with different types of OSER structures (Fig. 6 b). EM revealed that these structures were stacked lamellar cisternae exhibiting a narrow cytoplasmic space (8 nm; Fig. 7). They included sinusoidal and crystalloid ER (with square symmetry) and short karmellae, loops, and whorls. The different types of OSER structures were present regardless of the type of OSER-inducing protein being expressed (Table I). Importantly, no OSER-like structures were observed when cytoplasmic GFP alone was overexpressed in cells or when GFP was attached to Sec61β in the lumenal position (unpublished data). These findings indicated that fusion of GFP to the cytoplasmic domain of different ER resident proteins could lead to OSER formation in cells overexpressing the chimera.
Figure 7.
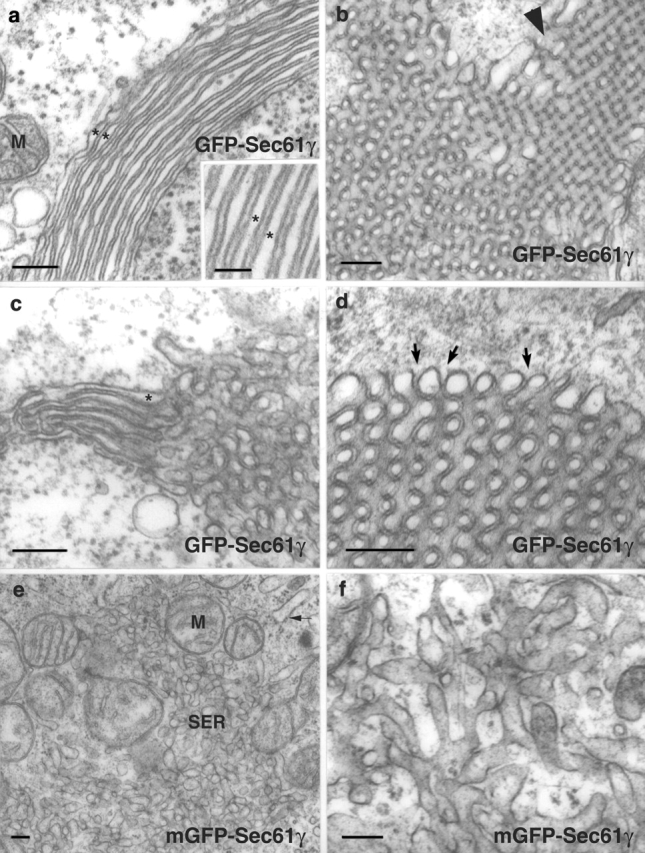
Unmutated GFP and mGFP-fusion proteins induce the formation of distinct forms of smooth ER. Ultrastructure of ER in COS-7 cells expressing unmutated or mGFP-Sec61γ. (a–d) GFP-Sec61γ; (e and f) mGFP-Sec61γ. (a) An image of the lamellar organization. The uniform width (∼8 nm) of the cytoplasmic layer separating the lamellae is apparent. (b) An image of the organization of sinusoidal ER. The arrowhead indicates an area in which the square symmetry of sinusoidal ER is apparent. (c) An image showing that both lamellar and sinusoidal structures coexist in the same cells and are often contiguous. It also illustrates how the spacing between membranes is the same in the two types of organization. (d) The 8-nm, electron-dense space between membranes is continuous with the cytoplasm (arrows). (e) Transfection with mGFP-Sec61γ results in the appearance of large areas of typical anastomosing tubules of smooth ER, segregated from rough cisternae (arrow). Stacked cisternal membranes were never observed. (f) A higher magnification of the tubular smooth ER is shown. M, mitochondrion; SER, anastomosing smooth ER. Asterisks ( in a and c) indicate the lumenal space. Bars: (a–f) 160 nm; (inset in a) 56 nm.
Table I.
Quantitative analysis of different ER structures in unmutated GFP-Sec61γ– and mGFP-Sec61γ–expressing cells
| Structure | GFP-Sec61γ | mGFP-Sec61γ |
|---|---|---|
| % | % | |
| Whorl or loop | 7.8 | 0 |
| Short karmellae | 14.6 | 0 |
| Whorl, loop, or short karmellae |
17.5a | 0 |
| Nonpolygonal branching ER membrane cluster |
54.8b | 80.1b |
| No clustered ER structures | 27.7 | 19.9 |
| Total | 100 | 100 |
For each construct, 100 fields of live cells, 143.4 μm × 143.4 μm were counted. A total of 206 cells transfected with unmutated GFP-Sec61γ and 196 cells transfected with mGFP-Sec61γ were counted. Cells were imaged at a standard gain setting and, when necessary, at one of two reduced gain settings to resolve structure identity.
A total of 3.9% of unmutated GFP-Sec61γ–expressing cells contained at least one whorl or loop and at least one short karmellae.
Nonpolygonal branching ER clusters were defined as structures ranging from puncta to 4 μm in diameter of varying fluorescence intensities that were consistently more intense than surrounding ER.
To test if OSER-inducing, GFP-tagged ER proteins were highly mobile within OSER structures, as found for GFP-b(5), we performed photobleaching experiments in cells overexpressing GFP-Sec61γ. GFP-Sec61γ was found to be highly mobile within an OSER (Fig. 6 c), as well as within surrounding reticular ER (Fig. 6 d). Moreover, the chimera could readily diffuse into and out of OSER structures (Fig. 6, e–g). Thus, after OSER induction, neither GFP-b(5) nor GFP-Sec61γ exhibits restricted mobility within membranes comprising OSER structures. Similar results were observed for YFP-Sec61β and C1(1-29)P450-GFP (unpublished data).
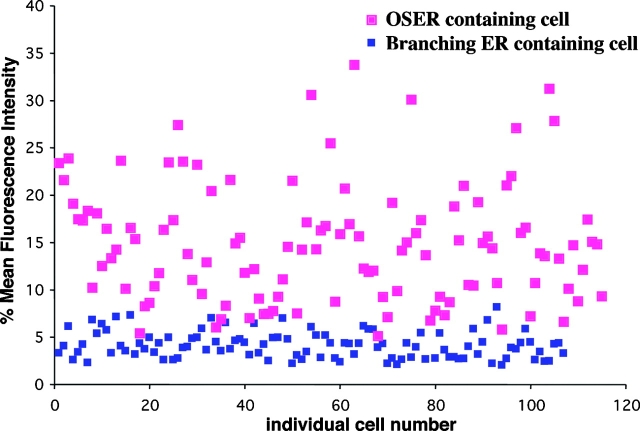
To address what levels of GFP-Sec61γ overexpression were necessary for OSER structures to be generated, we quantified the mean fluorescence intensities of expressing cells in which OSER structures were or were not present (100 cells each; Fig. 8). OSER formation occurred in cells with mean fluorescence intensities between three- and ninefold higher than the dimmest visibly expressing cells. Therefore, OSER-inducing proteins must be present at relatively high levels within ER membranes before OSER structures will form within a cell.
Figure 8.
OSER formation correlates with a threshold level of protein expression. A comparison of relative fluorescence intensities of cells lacking (blue squares) or containing (pink squares) OSER structures is plotted. Over 200 COS-7 cells expressing dimerizing GFP-Sec61γ were imaged using the same settings for all cells. The mean fluorescence intensity of each cell was quantified and converted from a 0–255% gray scale to 0–100%. The results are plotted and each square represents the mean fluorescence intensity of one cell. Similar results were observed for other ER resident proteins with GFP attached to their cytoplasmic domains.
Fusion proteins containing monomeric GFP (mGFP) do not induce OSER formation
Next, we considered how GFP attached to the cytoplasmic domain of an ER membrane protein could act to induce OSER structures. One possible mechanism was through GFP's ability to form low affinity dimers. The crystallographic structure of GFP has revealed that GFP can dimerize into an antiparallel orientation (Yang et al., 1996). Furthermore, GFP and its variants can undergo weak dimerization both in solution (K d = 0.11 mM) and within cells (Zacharias et al., 2002). Importantly, GFP dimerization can be disrupted with any one of three point mutations of amino acids on the dimerizing face of GFP without significantly altering the fluorescent properties of GFP (Zacharias et al., 2002). To investigate whether OSER induction by the GFP-tagged resident ER proteins resulted from low affinity dimerization of GFP, we mutated leucine 221 to a lysine to create GFP mutants (called mGFP) of Sec61β (mGFP-Sec61β) Sec61γ (mGFP-Sec61γ) and C1(1-29)P450 (C1(1-29)P450–mGFP) that could not dimerize.
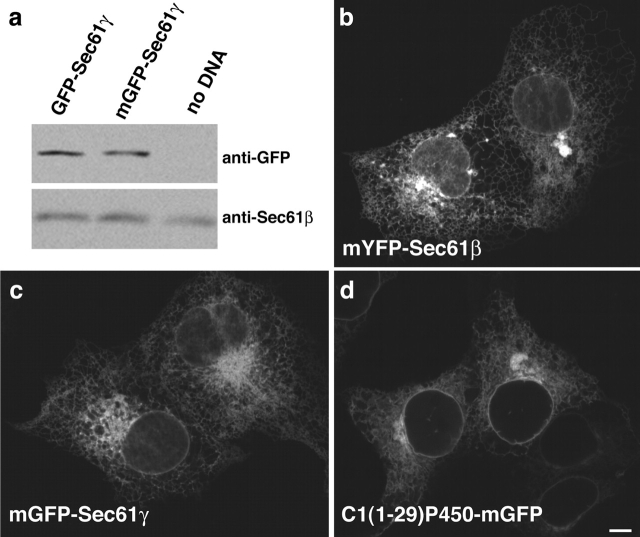
First, we checked whether expression levels of the unmutated, dimerizing GFP and mGFP constructs were comparable. Results from immuno-blotting with anti-GFP antibodies confirmed that the mGFP and GFP fusion proteins were indeed expressed at comparable levels in transiently transfected cells (Fig. 9 a). Similar results were obtained for the C1(1-29)P450-GFP and YFP-Sec61β fusion proteins (unpublished data).
Figure 9.
A point mutation that converts GFP to mGFP inhibits formation of OSER structures. (a) Immunoblot analysis of cells expressing unmutated or mGFP-Sec61γ lysates of equal amounts of cells untransfected (no DNA) or expressing either construct were loaded on the same gel and probed with anti-GFP or an antibody against native Sec61β as a control for equal loading. (b–d) Representative confocal micrographs of transiently transfected COS-7 cells expressing (b) mYFP-Sec61β, (c) mGFP-Sec61γ, and (d) C1(1-29)P450-mGFP reveal the absence of whorls, short karmellae, and loop structures. Other amorphous, often perinuclear, structures that are generally of much lower fluorescence intensity than cells expressing the unmutated GFP counterparts are visible. Bar, 5 μm.
Next, we examined by confocal microscopy the distribution of mGFP-Sec61γ, mGFP-Sec61β, and C1(1-29) P450-mGFP upon expression of the proteins in cells (Fig. 9, b-d, and Table I). At both high and low expression levels, no OSER-like structures were observed. Instead, these proteins were distributed primarily in a normal reticular ER pattern. Often, clustered ER structures of variable fluorescence intensity and size were observed in the highly overexpressing cells (Fig. 9 b, and Table I), but these structures were never organized into stacks or polygonal arrays of tubules. Rather, as shown by EM, these structures consisted of disorganized ribosome-free membrane clusters (Fig. 7, e and f), similar to the anastomosing smooth ER of hepatocytes and steroid-secreting cells (Fawcett, 1981). In addition, the absence of OSER structures in cells expressing mGFP attached to ER resident proteins was not due to a difference in the mobility of the unmutated GFP and mGFP chimeras because the D eff (0.53 ± 0.13 μm2/s, n = 8) of mGFP-Sec61γ was not significantly different from that of GFP-Sec61γ (D eff = 0.6 ± 0.08 μm2/s, n = 8). These combined results suggested that dimerizing interactions between GFPs attached to the cytoplasmic domains of ER resident proteins are responsible for OSER biogenesis in cells overexpressing these proteins.
OSER formation and dynamics in living cells
To clarify the morphological pathway by which OSER structures are formed, we studied individual COS-7 cells expressing GFP-b(5) tail by time-lapse confocal microscopy from the time the cells had no OSER structures to when they had produced these structures (Fig. 10 a). Before OSER formation, only a fine reticular ER pattern containing GFP-b(5) tail was observed. During the time course of the experiment, the levels of GFP-b(5) tail fluorescence within cells continually increased due to new protein synthesis. When the concentration of GFP-b(5) tail in the cell reached high enough levels, distinct OSER structures emerged overtime periods as short as 1 h (Fig. 10 a). Once their formation was initiated, OSER structures grew brighter and larger with time. This increase in OSER fluorescence intensity was not solely due to new protein synthesis. Concomitant with OSER proliferation, the surface area of branching ER decreased (Fig. 10 a). Similar results were observed for cells expressing other OSER-inducing proteins (unpublished data). These results suggested that the process of OSER formation involves incorporation of preexisting branching ER into stacked structures.
Figure 10.
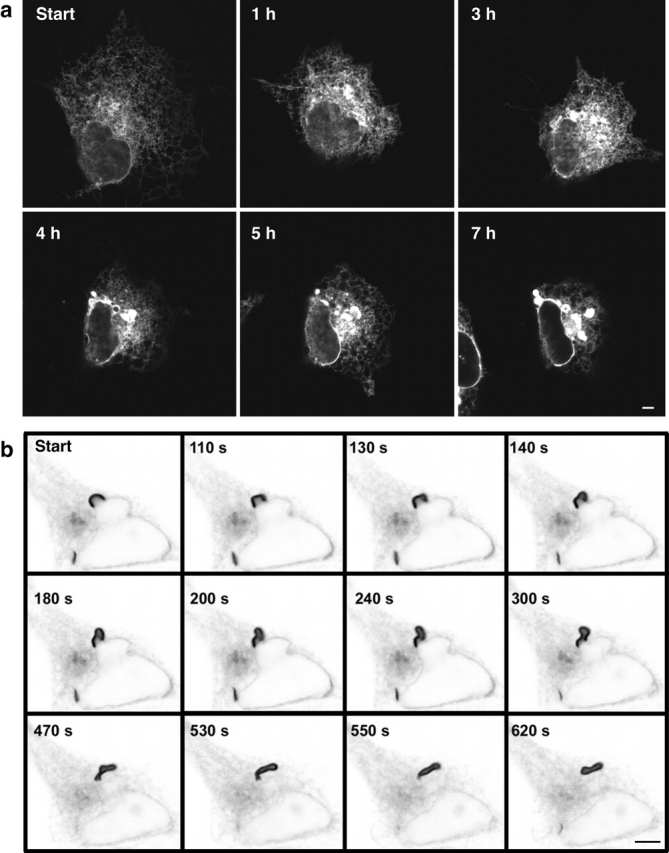
OSER formation in living cells. (a) A COS-7 cell transiently transfected with GFP-b(5) tail was imaged hourly by confocal microscopy, 12 h after transfection. Initially, the ER appears spread out as a branching reticulum. After 1 h, the area of ER distribution has decreased, whereas the overall fluorescence intensity has increased. Between 1 and 3 h, OSER structures begin to appear. Between 3 and 7 h, the structures became brighter and larger, whereas the distribution of branching ER decreased substantially. (b) A short karmellae structure in a living cell expressing GFP-Sec61γ was imaged by confocal microscopy over time. From 110 to 300 s, the short karmellae becomes distorted by a combination of the left side either pushing or being pulled away from the nucleus, while the right half remains relatively stable. By 470 s, the ends of the short karmellae come together and the majority of the structure has pulled away from the nucleus. From 530 to 620 s, the structure dissociates from the nucleus entirely and circularizes into a whorl. Bars, 5 μm.
Next, we focused on whether OSER structures originated at specific sites within the cell and whether OSER structures were stable or dynamic structures. Our time-lapse observations of OSER biogenesis in single cells suggested that most OSER structures initially arose either as short karmellae next to the NE or within the dense ER membranes of the juxtanuclear area (Fig. 10, a and b). Once formed, OSER structures were not static but were capable of distorting and moving away from their site of origin. As an example, Fig. 10 b shows a short karmellae detaching from the NE and closing off into a whorl shape during a period of 5 min. In cells containing an extensive branching ER network, such whorls and loops undulated, opened and closed, or moved through the cell on a time scale of seconds (unpublished data). Therefore, OSER structures that initially arose next to the NE could dissociate and move to more peripheral regions of the cell. By contrast, in cells containing less branching reticular ER and a larger proportion of OSER, whorls and other structures were relatively immobile (unpublished data).
Discussion
There has been a long tradition of research into the molecular mechanisms underlying the architecture and dynamics of membrane-bound organelles. Roles of motor proteins, which extend membrane elements out along cytoskeletal elements; coat proteins, which help segregate and bud off membrane components; and matrix proteins, which stabilize membrane structures, have been described previously (Seemann et al., 2000; Bonifacino and Lippincott-Schwartz, 2003; Vale, 2003). Here, we provide evidence for an additional, unexpected mechanism for the regulation of organelle architecture involving weak homotypic interactions between cytoplasmic domains of membrane proteins on apposing membranes. Such interactions were found to mediate the formation of regular arrays of stacked ER membranes. Below, we discuss how such weak interactions lead to this type of organelle remodeling, the effects they have on global ER structure, their potential functions, and whether weak protein–protein interactions underlie the formation of other stacked organelles within cells.
The role of transient weak protein interactions
OSER biogenesis has been viewed up until now as involving tight binding interactions between cytoplasmic domains of ER resident proteins (Takei et al., 1994; Yamamoto et al., 1996; Fukuda et al., 2001). Through such interactions, membranes are thought to zipper up into highly compacted, stacked structures with stable, immobilized components. Evidence against this mechanism came from several findings in our paper. First, photobleaching experiments revealed that OSER-inducing proteins could readily diffuse in and out of OSER structures, so they were not tightly cross-linked to each other or to some type of scaffold. Second, OSER-inducing proteins were not noticeably more enriched than other ER proteins in OSER structures, as would be expected if they formed an immobilized array and excluded other membrane proteins. Third, and most significantly, OSER structures were induced in cells overexpressing chimeras in which GFP, known to undergo weak homodimerization (Zacharias et al., 2002), was attached to the cytoplasmic domains of different ER-retained proteins, including b(5)-tail, Sec61γ, Sec61β, and C1(1-29)P450. And, no OSER structures formed in cells expressing chimeras with an attached GFP containing a mutation abolishing GFP's homodimerizing potential or when dimer-forming GFP was attached to the lumenal domain of a chimera.
These data suggest that weak homodimeric interactions between cytoplasmic domains of ER resident proteins are sufficient for generating OSER structures. However, the OSER-inducing GFP-tagged proteins need to be abundant enough for their interactions to cause ER membranes to rearrange into OSER structures, consisting of stacks with narrow cytoplasmic spacing and few interconnections. Our measurements comparing the fluorescent intensities of cells expressing ER resident proteins with GFP attached to their cytoplasmic domains revealed that cells containing OSER structures typically had three to nine times higher levels of the chimera relative to cells that had no OSER structures. This suggested that a critical level of OSER-inducing proteins in ER membranes must be reached before OSER structures can form within a cell.
The degree of affinity between cytoplasmic domains of OSER-inducing proteins could explain the diversity of OSER structures, with higher affinities leading to the formation of different OSER structures, such as the hexagonal crystalloid ER observed in cells overexpressing HMG-CoA reductase (Chin et al., 1982). Modulation of the affinity between OSER-inducing proteins may also affect the rate of OSER formation. For example, the inositol 1,4,5-trisphosphate receptor (IP3R; Takei et al., 1994) in Purkinje neurons mediates a strikingly rapid formation of lamellar stacks of ER cisternae within minutes of induction of hypoxia. Because IP3R is normally present at high densities in these cells, hypoxia-induced OSER biogenesis may result from an increase in affinity between IP3R molecules due to modifications of IP3R or of other ER-associated proteins.
Not all ER proteins with GFP on their cytoplasmic domain may induce OSER structures, because for a given protein its adjacent protein domains or the rotational mobility of the fused GFP could interfere with dimerization. This would explain why in some studies examining overexpression of ER membrane proteins with cytoplasmically attached GFP, OSER structures were not observed (Li et al., 2003). Furthermore, the added requirement of being at high expression levels and in membranes capable of close apposition could explain why other organelles (i.e., plasma membrane and endosomes) have not been reported to change their morphology upon expression of resident proteins with cytoplasmically attached GFP.
The fact that GFP's dimerizing properties can result in low affinity interactions between proteins that normally do not interact, and such interactions (when frequent enough) can lead to stacking of ER membranes (shown here) or fluorescence energy transfer at the plasma membrane (Zacharias et al., 2002) should serve as a cautionary note for studies using GFP chimeras. To avoid these effects, the use of GFP variants that do not dimerize (Zacharias et al., 2002) is recommended. If dimerizing forms of GFP attached to a protein are used in an experiment, then the fusion protein should only be expressed at low levels. Under these conditions, there is usually no significant difference in the distribution or dynamics of proteins with dimeric GFP versus mGFP attached to their cytoplasmic tail (unpublished data).
Effects of OSER on global ER structure
Within only a few hours after OSER structures began to form in cells overexpressing ER proteins with cytoplasmically attached GFP, we observed that a significant proportion of reticular ER membranes became incorporated into highly compacted OSER membranes (Fig. 10 a). Initially, OSER structures formed at sites adjacent to the NE rather than in other areas of the reticular ER, as found when OSER structures are induced by overexpression of HMG-CoA reductase (Pathak et al., 1986). This could result from the relative stability of ER membranes adjacent to the NE compared with surrounding reticular ER membranes, which are continually remodeling through dynamic tubulation and fusion events. The stability of ER membranes next to the NE would allow surrounding ER cisternae to arrange themselves over time next to this surface due to multiple, transient protein–protein interactions between these membranes. Once lamellar ER arrays are initiated in this fashion, they could then move away from this surface and serve as their own stable template for further growth of OSER lamellar sheets. This scenario is supported by our live cell imaging of the formation and dynamics of individual OSER structures (Fig. 10 b).
The dynamic process of OSER biogenesis and differentiation, as described in the Results, would not necessarily require the induction of specialized ER stress or lipid biosynthetic pathways, as suggested in previous studies (Block-Alper et al., 2002). Rather, it would require only an abundance of proteins containing a cytoplasmic domain capable of low affinity, antiparallel binding. Consistent with this, we found that overexpressing mGFP attached to the cytoplasmic domain of a nondimerizing ER protein did not induce OSER production. Instead, it led to anastomosing smooth ER proliferation reminiscent of ER specialized for steroid synthesis (i.e., adrenocortical and Leydig cells).
Potential OSER functions
The function of OSER within cells remains to be clarified. Both OSER-forming proteins (Figs. 4 and 6) and non-OSER-forming proteins (unpublished data) dwell for relatively long periods within OSER structures compared with similar sized areas of branching ER due to the limited number of connections between OSER and branching ER. Therefore, reorganization of branching ER into OSER results in the effective compartmentalization of the ER. This could play an important role in sequestering lipophilic drugs away from other organelles or regions of the cytoplasm during detoxification. Furthermore, a potential role for OSER in pathogenesis is raised by the observation that OSER structures can form when mutant membrane proteins accumulate in the ER due to defects in their ability to be exported out of the ER. Examples of this are the pathogenic phenotype observed in a mouse model of Charcot-Marie-Tooth syndrome (Dickson et al., 2002), as well as for early onset torsion dystonia (Hewett et al., 2000).
Implications for biogenesis of other stacked organelles
Our results have implications for mechanisms underlying the stacked morphology of other organelles within cells, such as the Golgi apparatus, thylakoids in chloroplasts, or the myelin sheath formed by Schwann cells around axons. Traditionally, the stacked elements of such structures, in particular the Golgi apparatus, has been viewed as requiring a specific matrix or glue for holding them together (Cluett and Brown, 1992; Barr et al., 1997). Our finding that dynamic tubular elements of the ER can convert into stacked ER cisternae through transient low affinity interactions between the cytoplasmic domains of proteins on apposing ER membranes raises the possibility that the stacking of Golgi membranes or other organelles occurs by a similar mechanism. Consistent with this, several features of Golgi morphology resemble OSER structures. First, certain Golgi proteins (i.e., GRASP65) form transoligomers in the cytoplasm that appear to be sufficient for mediating Golgi stacking (Wang et al., 2003). Second, Golgi cisternae are separated by a uniformly narrow cytoplasmic space (Cluett and Brown, 1992) and are not connected along their surface (Ladinsky et al., 1999). Finally, Golgi resident components undergo rapid lateral diffusion (Cole et al., 1996). These similarities with OSER structures raise the possibility that weak transient interactions between proteins on apposing membranes provide a general mechanism for the formation of stacked organelle structures.
Materials and methods
Plasmid constructions
GFP-Sec61γ and YFP-Sec61β were derived from the ORF for human Sec61γ and Sec61β amplified from a human brain cDNA library (CLONTECH Laboratories, Inc.) and inserted into the pCR cloning vector (Invitrogen) and verified by automated sequencing. The Sec61γ ORF was excised from the pCR cloning vector and inserted into pEGFP-C1 (CLONTECH Laboratories, Inc.). The excised Sec61γ fragment was ligated to the vector to produce the GFP-Sec61γ fusion. Sec61β was excised from pCR and inserted into pEYFP-C1 to produce the YFP-Sec61β fusion.
The cDNA coding for rabbit b(5) in the mammalian expression vector pCB6 has been described previously (Pedrazzini et al., 1996). The GFP-b(5) tail construct is also described in previous publications (referred to as GFP-ER [Borgese et al., 2001] and as GFP-17 [Bulbarelli et al., 2002]). C1(1-29)P450 GFP has been described previously (Szczesna-Skorupa et al., 1998) and was a gift from B. Kemper (College of Medicine at Urbana-Champaign, University of Illinois, Urbana, IL).
For GFP-b(5), EGFP was fused at its COOH terminus via the same linker as above to the sequence coding for the entire ER isoform (minus the first two residues) of rabbit b(5) (GFP-b(5)). The EGFP plus linker fragment was derived from GFP-b(5) tail. The coding sequence of b(5) was obtained by digestion of pGb(5)AX (Pedrazzini et al., 2000). The GFP-linker fragment was ligated with the b(5) fragment into the modified pCB6 vector (De Silvestris et al., 1995).
mGFP forms of the fusion proteins were created by site-directed mutagenesis using reverse (GGTCACGAACTCCTTAAGGACCATGTGATC) and forward primers (GATCACATGGTCCTTAAGGAGTTCGTGACC). Mutagenesis was performed using the Quickchange kit from Stratagene as recommended by the manufacturer. The primers convert leucine 221 to lysine and introduce a new restriction site, Afl2, with a silent mutation for ease of screening mutants.
We confirmed that the constructs in this work localized to the ER by performing immunofluorescence with antibodies against several different ER marker proteins.
Cell culture and transfection
COS-7 and CV-1 cells were grown in DME (Biofluids, Inc.) supplemented with FBS, glutamate, penicillin, and streptomycin. Transient transfections were performed using FuGENE 6 transfection reagent according to the manufacturer's instructions (Roche) or by the Ca2PO4 method (Graham and van der Eb, 1973). Cells were analyzed 16–48 h after transfection.
Antibodies
The polyclonal rabbit antibody against Sec61β was prepared (Lampire Biological Laboratories) against the synthetic peptide PGPTPSGTNC (residues 2–10 plus a cysteine) of canine Sec61β conjugated to keyhole limpet hemocyanin using standard protocols. Other antibodies used include polyclonal anti–rat b(5) (Borgese et al., 2001), monoclonal anti-GFP (JL-8) (CLONTECH Laboratories, Inc.), polyclonal anticalreticulin and antiprotein disulfide isomerase (Affinity BioReagents, Inc.), polyclonal antibody anticalnexin (StressGen Biotechnologies) and anti–rabbit IgG labeled with Alexa 546 (Molecular Probes).
Immunoblotting
Separation of proteins by SDS-PAGE was on 12% Tris-tricine gels. Immunoblotting was performed after transfer to nitrocellulose. The blot was developed with SuperSignal ECL reagents from Pierce Chemical Co. Autoradiographs made on film (BioMax; Kodak) were digitized for display in the figures (prepared using Photoshop and Illustrator software from Adobe Systems Inc.).
EM
For EM, cells were fixed as a monolayer in 2% glutaraldehyde in 0.1 M cacodylate buffer, pH 7.4, for 30 min, scraped, and collected as a pellet, supplemented with fresh fixative and left overnight at 4°C. The cells were further fixed with osmium tetroxide and embedded in epon by standard procedures. Lead citrate stained thin sections were observed under a transmission electron microscope (model CM10; Philips).
Immunofluorescence and photobleaching experiments
For immunofluorescence experiments, cells were fixed with formaldehyde, permeabilized with 0.2% Triton X-100, and incubated with antibodies as described in previous publications (Cole et al., 1998). Fixed and live cells were imaged on a temperature controlled stage of a confocal microscope system (model LSM 510; Carl Zeiss MicroImaging, Inc.) using the 488-nm line of a 40-mW Ar/Kr laser for GFP or the 514-nm line of the same laser for YFP with either a 63× 1.2 NA water or a 63× 1.4 NA oil objective.
Qualitative FRAP experiments were performed by photobleaching a region of interest at full laser power and monitoring fluorescence recovery by scanning the whole cell at low laser power. No photobleaching of the cell or adjacent cells during fluorescence recovery was observed.
Fluorescence recovery plots and diffusion (D eff) measurements were obtained by photobleaching a 4-μm-wide strip as described previously (Ellenberg et al., 1997; Siggia et al., 2000). D eff was determined using an inhomogeneous diffusion simulation program written by Eric Siggia (Siggia et al., 2000). To create the fluorescence recovery curves, the fluorescence intensities were transformed into a 0–100% scale in which the first postbleach time point equals 0% recovery and the recovery plateau equals 100% recovery. The plots do not represent the mobile fraction of the GFP chimeras. The mobile fraction was calculated by comparing the photobleach corrected prebleach and postbleach recovery fluorescence intensity values in the photobleached region of interest as described previously (Ellenberg et al., 1997). Image analysis was performed using NIH Image 1.62 and LSM image examiner software. Composite figures were prepared using Photoshop 5.5 and Illustrator 9.0 software (both from Adobe). Fluorescence recovery curves were plotted using Kaleidagraph 3.5 (Synergy Software).
Acknowledgments
We would like to thank Devarati Mitra and Kelly Shaffer for generating and characterizing the Sec61β constructs containing a lumenal GFP. We are grateful to Teresa Sprocati for technical assistance.
Work in the laboratory of Nica Borgese was supported by grants from the Associazione Italiana per la Ricerca sul Cancro, the Ministero per la Università e Ricerca (COFIN 2001), and the Ministero per la Sanità (Amyotrophic Lateral Sclerosis grant 2002). Erik Snapp was a Pharmacology and Research Training Fellow during the course of these studies.
Abbreviations used in this paper: b(5), cytochrome b(5); b(5) tail, truncated cytochrome b(5) containing amino acids 94–134; C1(1-29)P450, truncated cytochrome P450 containing amino acids 1–29; D eff, effective diffusion coefficient; IP3R, inositol 1,4,5-trisphosphate receptor; mGFP, monomeric GFP; NE, nuclear envelope; OSER, organized smooth ER; TMD, transmembrane domain.
References
- Abran, D., and D.H. Dickson. 1992. Biogenesis of myeloid bodies in regenerating newt (Notophthalmus viridescens) retinal pigment epithelium. Cell Tissue Res. 268:531–538. [DOI] [PubMed] [Google Scholar]
- Anderson, R.G., L. Orci, M.S. Brown, L.M. Garcia-Segura, and J.L. Goldstein. 1983. Ultrastructural analysis of crystalloid endoplasmic reticulum in UT-1 cells and its disappearance in response to cholesterol. J. Cell Sci. 63:1–20. [DOI] [PubMed] [Google Scholar]
- Barr, F., M. Puype, J. Vandekerckhove, and G. Warren. 1997. GRASP65, a protein involved in the stacking of Golgi cisternae. Cell. 91:253–262. [DOI] [PubMed] [Google Scholar]
- Bassot, J.M., and G. Nicola. 1987. An optional dyadic junctional complex revealed by fast-freeze fixation in the bioluminescent system of the scale worm. J. Cell Biol. 105:2245–2256. [DOI] [PMC free article] [PubMed] [Google Scholar]
- Baumann, O., and B. Walz. 2001. Endoplasmic reticulum of animal cells and its organization into structural and functional domains. Int. Rev. Cytol. 205:149–214. [DOI] [PubMed] [Google Scholar]
- Berciano, M.T., R. Fenandez, E. Pena, E. Calle, N.T. Villagra, J.C. Rodriguez-Rey, and M. Lafarga. 2000. Formation of intranuclear crystalloids and proliferation of the smooth endoplasmic reticulum in Schwann cells induced by tellurium treatment: association with overexpression of HMG CoA reductase and HMG CoA synthase mRNA. Glia. 29:246–259. [DOI] [PubMed] [Google Scholar]
- Block-Alper, L., P. Webster, X. Zhou, L. Supekova, W.H. Wong, P.G. Schultz, and D.I. Meyer. 2002. INO2, a positive regulator of lipid biosynthesis, is essential for the formation of inducible membranes in yeast. Mol. Biol. Cell. 13:40–51. [DOI] [PMC free article] [PubMed] [Google Scholar]
- Bonifacino, J., and J. Lippincott-Schwartz. 2003. Coat proteins: shaping membrane transport. Nat. Rev. Mol. Cell Biol. 4:409–414. [DOI] [PubMed] [Google Scholar]
- Borgese, N., I. Gazzoni, M. Barberi, S. Colombo, and E. Pedrazzini. 2001. Targeting of a tail-anchored protein to endoplasmic reticulum and mitochondrial outer membrane by independent but competing pathways. Mol. Biol. Cell. 12:2482–2496. [DOI] [PMC free article] [PubMed] [Google Scholar]
- Bulbarelli, A., T. Sprocati, M. Barberi, E. Pedrazzini, and N. Borgese. 2002. Trafficking of tail-anchored proteins: transport from the endoplasmic reticulum to the plasma membrane and sorting between surface domains in polarised epithelial cells. J. Cell Sci. 115:1689–1702. [DOI] [PubMed] [Google Scholar]
- Chin, D.J., K.L. Luskey, R.G. Anderson, J.R. Faust, J.L. Goldstein, and M.S. Brown. 1982. Appearance of crystalloid endoplasmic reticulum in compactin-resistant Chinese hamster cells with a 500-fold increase in 3-hydroxy-3-methylglutaryl-coenzyme A reductase. Proc. Natl. Acad. Sci. USA. 79:1185–1189. [DOI] [PMC free article] [PubMed] [Google Scholar]
- Cluett, E., and W. Brown. 1992. Adhesion of Golgi cisternae by proteinaceous interactions: intercisternal bridges as putative adhesive structures. J. Cell Sci. 103:773–784. [DOI] [PubMed] [Google Scholar]
- Cole, N.B., C.L. Smith, N. Sciaky, M. Terasaki, M. Edidin, and J. Lippincott-Schwartz. 1996. Diffusional mobility of Golgi proteins in membranes of living cells. Science. 273:797–801. [DOI] [PubMed] [Google Scholar]
- Cole, N.B., J. Ellenberg, J. Song, D. DiEuliis, and J. Lippincott-Schwartz. 1998. Retrograde transport of Golgi-localized proteins to the ER. J. Cell Biol. 140:1–15. [DOI] [PMC free article] [PubMed] [Google Scholar]
- De Silvestris, M., A. D'Arrigo, and N. Borgese. 1995. The targeting information of the mitochondrial outer membrane isoform of cytochrome b5 is contained within the carboxyl-terminal region. FEBS Lett. 370:69–74. [DOI] [PubMed] [Google Scholar]
- Dickson, K.M., J.J. Bergeron, I. Shames, J. Colby, D.T. Nguyen, E. Chevet, D.Y. Thomas, and G.J. Snipes. 2002. Association of calnexin with mutant peripheral myelin protein-22 ex vivo: a basis for “gain-of-function” ER diseases. Proc. Natl. Acad. Sci. USA. 99:9852–9857. [DOI] [PMC free article] [PubMed] [Google Scholar]
- Ellenberg, J., E.D. Siggia, J.E. Moreira, C.L. Smith, J.F. Presley, H.J. Worman, and J. Lippincott-Schwartz. 1997. Nuclear membrane dynamics and reassembly in living cells: targeting of an inner nuclear membrane protein in interphase and mitosis. J. Cell Biol. 138:1193–1206. [DOI] [PMC free article] [PubMed] [Google Scholar]
- Fawcett, D.W. 1981. The Cell. W.B. Saunders Co., Philadelphia. 827 pp.
- Fukuda, M., A. Yamamoto, and K. Mikoshiba. 2001. Formation of crystalloid endoplasmic reticulum induced by expression of synaptotagmin lacking the conserved WHXL motif in the C terminus. J. Biol. Chem. 276:41112–41119. [DOI] [PubMed] [Google Scholar]
- Gong, F.C., T.H. Giddings, J.B. Meehl, and L.A. Staehelin. 1996. Z-membranes: artificial organelles for overexpressing recombinant integral membrane proteins. Proc. Natl. Acad. Sci. USA. 93:2219–2223. [DOI] [PMC free article] [PubMed] [Google Scholar]
- Graham, F.L., and A.J. van der Eb. 1973. A new technique for the assay of infectivity of human adenovirus 5 DNA. Virology. 52:456–467. [DOI] [PubMed] [Google Scholar]
- Hewett, J., C. Gonzalez-Agosti, D. Slater, P. Ziefer, S. Li, D. Bergeron, D.J. Jacoby, L.J. Ozelius, V. Ramesh, and X.O. Breakefield. 2000. Mutant torsinA, responsible for early-onset torsion dystonia, forms membrane inclusions in cultured neural cells. Hum. Mol. Genet. 9:1403–1413. [DOI] [PubMed] [Google Scholar]
- Koning, A.J., C.J. Roberts, and R.L. Wright. 1996. Different subcellular localization of Saccharomyces cerevisiae HMG-CoA reductase isozymes at elevated levels corresponds to distinct endoplasmic reticulum membrane proliferations. Mol. Biol. Cell. 7:769–789. [DOI] [PMC free article] [PubMed] [Google Scholar]
- Ladinsky, M., D. Mastronarde, J. McIntosh, K. Howell, and L.A. Staehelin. 1999. Golgi structure in three dimensions: functional insights from the normal rat kidney cell. J. Cell Biol. 144:1135–1149. [DOI] [PMC free article] [PubMed] [Google Scholar]
- Lee, C., and L.B. Chen. 1988. Dynamic behavior of endoplasmic reticulum in living cells. Cell. 54:37–46. [DOI] [PubMed] [Google Scholar]
- Li, Y., D. Dinsdale, and P. Glynn. 2003. Protein domains, catalytic activity, and subcellular distribution of neuropathy target esterase in mammalian cells. J. Biol. Chem. 278:8820–8825. [DOI] [PubMed] [Google Scholar]
- Lippincott-Schwartz, J., E.L. Snapp, and A. Kenworthy. 2001. Studying protein dynamics in living cells. Nat. Rev. Mol. Cell Biol. 2:444–456. [DOI] [PubMed] [Google Scholar]
- Ohkuma, M., S.M. Park, T. Zimmer, R. Menzel, F. Vogel, W.H. Schunck, A. Ohta, and M. Takagi. 1995. Proliferation of intranuclear membrane structures upon homologous overproduction of cytochrome P-450 in Candida maltosa. Biochim. Biophys. Acta. 1236:163–169. [DOI] [PubMed] [Google Scholar]
- Orrenius, S., and J.L. Ericsson. 1966. Enzyme-membrane relationship in phenobarbital induction of synthesis of drug-metabolizing enzyme system and proliferation of endoplasmic reticulum. J. Cell Biol. 28:181–198. [DOI] [PMC free article] [PubMed] [Google Scholar]
- Parrish, M.L., C. Sengstag, J.D. Rine, and R.L. Wright. 1995. Identification of the sequences in HMG-CoA reductase required for karmellae assembly. Mol. Biol. Cell. 6:1535–1547. [DOI] [PMC free article] [PubMed] [Google Scholar]
- Pathak, R.K., K.L. Luskey, and R.G.W. Anderson. 1986. Biogenesis of the crystalloid endoplasmic reticulum in UT-1 cells: evidence that newly formed endoplasmic reticulum emerges from the nuclear envelope. J. Cell Biol. 102:2158–2168. [DOI] [PMC free article] [PubMed] [Google Scholar]
- Pedrazzini, E., A. Villa, and N. Borgese. 1996. A mutant cytochrome b5 with a lengthened membrane anchor escapes from the endoplasmic reticulum and reaches the plasma membrane. Proc. Natl. Acad. Sci. USA. 93:4207–4212. [DOI] [PMC free article] [PubMed] [Google Scholar]
- Pedrazzini, E., A. Villa, R. Longhi, A. Bulbarelli, and N. Borgese. 2000. Mechanism of residence of cytochrome b(5), a tail-anchored protein, in the endoplasmic reticulum. J. Cell Biol. 148:899–913. [DOI] [PMC free article] [PubMed] [Google Scholar]
- Porter, K.R., and E. Yamada. 1960. Studies on the endoplasmic reticulum: V. Its form and differentiation in pigment epithelial cells of the frog retina. J. Biophys. Biochem. Cyt. 8:181–205. [DOI] [PMC free article] [PubMed] [Google Scholar]
- Profant, D.A., C.J. Roberts, A.J. Koning, and R.L. Wright. 1999. The role of the 3-hydroxy 3-methylglutaryl coenzyme A reductase cytosolic domain in karmellae biogenesis. Mol. Biol. Cell. 10:3409–3423. [DOI] [PMC free article] [PubMed] [Google Scholar]
- Sandig, G., E. Kargel, R. Menzel, F. Vogel, T. Zimmer, and W.H. Schunck. 1999. Regulation of endoplasmic reticulum biogenesis in response to cytochrome P450 overproduction. Drug Metab. Rev. 31:393–410. [DOI] [PubMed] [Google Scholar]
- Seemann, J., E. Jokitalo, M. Pypaert, and G. Warren. 2000. Matrix proteins can generate the higher order architecture of the Golgi apparatus. Nature. 407:1022–1026. [DOI] [PubMed] [Google Scholar]
- Siggia, E.D., J. Lippincott-Schwartz, and S. Bekiranov. 2000. Diffusion in a inhomogeneous media: theory and simulations applied to a whole cell photobleach recovery. Biophys. J. 79. [DOI] [PMC free article] [PubMed] [Google Scholar]
- Singer, I.I., S. Scott, D.M. Kazazis, and J.W. Huff. 1988. Lovastatin, an inhibitor of cholesterol synthesis, induces hydroxymethylglutaryl-coenzyme A reductase directly on membranes of expanded smooth endoplasmic reticulum in rat hepatocytes. Proc. Natl. Acad. Sci. USA. 85:5264–5268. [DOI] [PMC free article] [PubMed] [Google Scholar]
- Smith, S., and G. Blobel. 1994. Colocalization of vertebrate lamin B and lamin B receptor (LBR) in nuclear envelopes and in LBR-induced membrane stacks of the yeast Saccharomyces cerevisiae. Proc. Natl. Acad. Sci. USA. 91:10124–10128. [DOI] [PMC free article] [PubMed] [Google Scholar]
- Szczesna-Skorupa, E., C. Chen, S. Rogers, and B. Kemper. 1998. Mobility of cytochrome P450 in the endoplasmic reticulum membrane. Proc. Natl. Acad. Sci. USA. 95:14793–14798. [DOI] [PMC free article] [PubMed] [Google Scholar]
- Tabor, G.A., and S.K. Fisher. 1983. Myeloid bodies in the mammalian retinal pigment epithelium. Invest. Ophthalmol. Vis. Sci. 24:388–391. [PubMed] [Google Scholar]
- Takei, K., G.A. Mignery, E. Mugnaini, T.C. Sudhof, and P. De Camilli. 1994. Inositol 1,4,5-trisphosphate receptor causes formation of ER cisternal stacks in transfected fibroblasts and in cerebellar Purkinje cells. Neuron. 12:327–342. [DOI] [PubMed] [Google Scholar]
- Vale, R. 2003. The molecular motor toolbox for intracellular transport. Cell. 112:467–480. [DOI] [PubMed] [Google Scholar]
- Vergeres, G., T.S. Benedict Yen, J. Aggeler, J. Lausier, and L. Waskell. 1993. A model system for studying membrane biogenesis: overexpression of cytochrome b5 in yeast results in marked proliferation of the intracellular membrane. J. Cell Sci. 106:249–259. [DOI] [PubMed] [Google Scholar]
- Wang, Y., J. Seemann, M. Pypaert, J. Shorter, and G. Warren. 2003. A direct role for GRASP65 as a mitotically regulated Golgi stacking factor. EMBO J. 22:3279–3290. [DOI] [PMC free article] [PubMed] [Google Scholar]
- Wolf, K.W., and D. Motzko. 1995. Paracrystalline endoplasmic reticulum is typical of gametogenesis in hemiptera species. J. Struct. Biol. 114:105–114. [Google Scholar]
- Wright, R., G. Keller, S.J. Gould, S. Subramani, and J. Rine. 1990. Cell-type control of membrane biogenesis induced by HMG-CoA reductase. New Biol. 2:915–921. [PubMed] [Google Scholar]
- Yamamoto, A., R. Masaki, and Y. Tashiro. 1996. Formation of crystalloid endoplasmic reticulum in COS cells upon overexpression of microsomal aldehyde dehydrogenase by cDNA transfection. J. Cell Sci. 109:1727–1738. [DOI] [PubMed] [Google Scholar]
- Yang, F., L.G. Moss, and G.N.J. Phillips. 1996. The molecular structure of green fluorescent protein. Nat. Biotechnol. 14:1246–1251. [DOI] [PubMed] [Google Scholar]
- Yorke, M.A., and D.H. Dickson. 1985. Lamellar to tubular conformational changes in the endoplasmic reticulum of the retinal pigment epithelium of the newt, Notophthalmus viridescens. Cell Tissue Res. 241:629–637. [DOI] [PubMed] [Google Scholar]
- Zacharias, D.A., J.D. Violin, A.C. Newton, and R.Y. Tsien. 2002. Partitioning of lipid-modified monomeric GFPs into membrane microdomains of live cells. Science. 296:913–916. [DOI] [PubMed] [Google Scholar]


