Abstract
We develop a simple three-state stochastic description of individual malaria infections that relates dynamics of disease and immune status to age and previous exposure, under different intensities of transmission. We apply the resulting individual-based community models to examine the effects of drug treatment and vaccination on the frequency and severity of disease in ensembles of children. The several broad qualitative similarities between our results and field observations include potential rebound effects following intervals of drug treatment.
Keywords: Malaria, Stochastic, Infection, Disease, Immunity, Transmission
1. Introduction
Several recent studies have reported on patterns of malaria infection and disease, particularly age distribution in children, related to local transmission intensity (entomological inoculation rate; EIR) [1–4].
Here we develop an individual-based model of malaria infection and disease in an endemic region, represented as transitions between three states: not infected (N), asymptomatic (A), and symptomatic (S). Although this model is only a crude summary of the intricate intra-host processes that drive infection and disease – parasite replication and immune response – this simplicity can be instructive. The inherent ambiguity of the N, A, S description that makes it impossible to predict transitions between states with any certainty reflects many real-world circumstances. Thus, with an asymptomatic current state and fixed time-step (e.g., 2 days), a host could clear infection (shift to N-state), remain asymptomatic (A), or develop symptoms (S). Rather than prescribing specific state-dependent N-A-S transitions, we make them random with probability functions {pij: i, j = N, A, S}. The idea of using a stochastic (three-state) description of malaria infection was proposed previously [5], but that approach fixed the probabilities {pij} so that the disease was viewed as a stationary stochastic process, with no accounting for age or immune status.
Here we develop the approach of [5] further by including these important factors (age and immune status) in the dynamic evolution of the system. We represent immunity by a single effector variable J (again a gross simplification), which plays a dual (“protective” and “resolving”) role by lowering or raising transition probabilities {pij (J)}. While variable J controls the transition probabilities, the N-A-S states in turn govern production of the immune effector. Thus, the resulting stochastic model dynamically couples N-A-S transitions (natural history of disease) and the concurrent growth and decay of J. To represent age, we incorporate slow temporal changes in immune stimulation and loss parameters. Our goal is to develop a conceptually realistic but computationally efficient model with which to study the effects of EIR and drug and vaccine interventions on age-related patterns of malaria infection and disease.
The conventional approach to community transmission, based on SIR-type methodology (Ross-Macdonald) (see e.g. [6]), allows some qualitative predictions for analysis and control, but has serious drawbacks. Those include oversimplified (and uncertain) concepts of “S-I- R states” and transition processes, as well as grossly simplified “switch on/off”-type immunity. Any attempt to account for heterogeneities (such as age, susceptibility, intensity of transmission, multiple parasite strains etc.) brings yet another complication – a need for multiple ‘population strata’ and ‘levels of interaction’ (meta-population system) that could easily render it intractable, mathematically or computationally. Furthermore, ‘multi-component’ systems in general suffer from over-parameterization (which grows with the level of stratification), and the need to estimate a host of parameters based on sparse, incomplete and uncertain data. In the S-I-R-case, the uncertainty is further confounded by difficulties of accurate ‘definition’ and ‘detection’ of ‘SI-R’ strata.
An individual-based approach offers an attractive alternative. On the one hand it gives a far more realistic and accurate account of the intra-host states/processes, and on the other it allows a seamless accommodation of various communal heterogeneities without excessive ‘over-parameterization’. Indeed, one can easily produce a fully heterogeneous community (of potentially large size) by sampling a few essential ‘intra-host’ parameters within a prescribed ‘low-dimensional’ hypothetical distribution. Here the number of ‘uncertain parameters’ does not increase with the level of stratification.
Of course, individual-based models have their own limitations, in terms of population size and the level of detail (intra-host complexity). Most known examples of ‘intra-host’ dynamics (e.g. [7–14]) exploit ‘parasitemia’ coupled to ‘immune effectors’ as the key determinants of the host state. They use either a deterministic continuous setup [7–12], or discrete [13] and stochastic ones [14]. The latter two [13–14] add another element of realism - multiple strains of the parasite species - to account for variations of its surface protein (on each replication cycle), a key immune evasion strategies. As the details of such variation are still poorly understood, it is natural to represent them stochastically [14]. Many other sources of uncertainty/stochasticity are possible in the complex process of parasite growth/regulation by host immunity, depending on the level of detail one is able (or willing) to put at the intra-host level. While our coarse N-A-S description (only loosely associated with ‘parasitemia’) avoids the intricacies of intra-host dynamics, it maintains some important realistic features (e.g. immune maturation with host age).
As our prime interest lies in the effect of severe malaria on young ages (0–10 years), the ‘community level’ will be confined to a single age-cohort within the larger population, subjected to a prescribed (statistically stationary) force of infection (EIR). Several reasons (conceptual, computational and practical) motivate our choice of a simplified (stochastic 3-level) host and the ‘age-cohort’ community in this study: (i) on the practical level, the “N-A-S” prevalences seem much easier to identify and measure than “S-I-R” ones; (ii) the stochastic system allows fast and efficient computer implementation and mathematical analysis. Indeed, one can derive deterministic (mean-field) equations of the stochastic-ensemble dynamics, which couple N-A-S prevalences to the mean and variance of J. One can view such deterministic system as an alternative to the standard Ross-Macdonald S-I-R, confined to an age-cohort.
The current model can serve as the first basic step for future development of individual-based communities. There are many ways to extend and refine it, both on the individual and community transmission levels.
2. Model description
2.1. Markov transition map and immune stimulation
We outline a stochastic model of intra-host regulation of infection based on a three-level “disease state” system. Stochasticity enters our model because we use a very crude (three-level) description of the host state and such a description (indeed, even a more precise one based on parasitemia) renders impossible an accurate (deterministic) prediction of the future state of the host. Hence we resort to probabilistic prediction. A more accurate description of “infected state” would include, for instance, overall parasite(s) load and specific markers or traits of various infecting species or strains.
The disease stages in our three-level scheme are labeled N – not infected, A –asymptomatic, and S – symptomatic (Fig. 1). Such states can be loosely associated with levels of parasitemia in the blood (low, intermediate, and high), so that transitions among states would indicate the growth or decay of parasitemia past certain threshold levels. However, the real interplay between ‘parasitemia’ and ‘asymptomatic or/symptomatic’ states is much more complicated than this scheme suggests.
Figure 1.
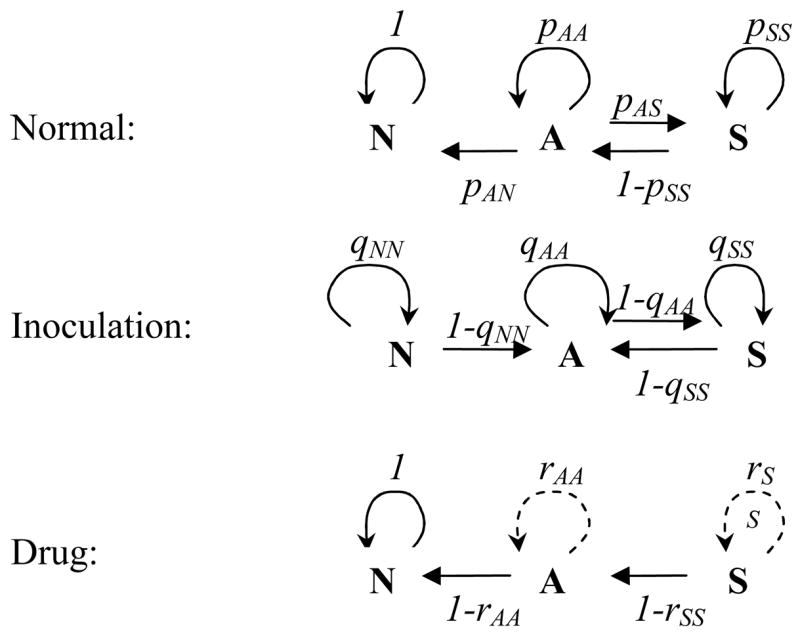
The three-state “disease space” X= {N, A, S} with transition probabilities p,q,r for the normal, inoculation, and drug-treatment steps. N = not infected; A = asymptomatic; S = symptomatic.
The transition probabilities among states are controlled by the immune effector, J, which in turn is “stimulated” by the current state and accumulates the “past history” of the disease. We also introduce three dynamic steps of the process:
Normal resolution (R-step), when N-A-S transitions are determined by the parasite-immune status, undisturbed by external factors (inoculation or drug)
Inoculation (I-step), when the host is bitten by an infectious mosquito and receives an additional inoculum of parasites
Drug treatment (D-step), when, because of parasite clearing, upward transitions (N → A and A → S) are suppressed while downward transitions are enhanced.
The different transition patterns of the three steps are illustrated in Fig. 1 and Table 1. Thus, the normal R-step would leave the N-state intact while allowing other transitions; the I-step would prevent recovery (A → N) while maintaining other possibilities. The drug step overall is downward, and, depending on the drug efficacy, would lead to either full recovery or intermediate A- or S-states.
Table 1.
Transition probabilities
| N | A | S | |
|---|---|---|---|
| R | pN = 1; pNA = 0 | pA = 1 − pAN − pAS | pS = 1 − pSA |
| I | qNA = 1−qN > 0 | qA =1 − qAS | qS = 1 − qSA |
| D | rN = 1 | rA = 1 −rAS ≥ 0 | rS = 1 −rSA ≥ 0 |
N = not infected; A = asymptomatic; S = symptomatic; R = normal resolution; I = inoculation; D = drug treatment.
We proceed as in the previous publication [5] by fixing a discrete time-step, Δt = 2 days, and considering a stochastic Markov process on the “disease space”{N, A, S}, with transition probabilities {pij;qij;rij} for the respective R, I, and D steps (Fig. 1). Unlike [5], our probabilities {pij, qij} are not fixed, but change with the development of host immunity as represented by effector variable J. There are many ways to introduce past history, the resulting buildup of immunity, and immune regulation of the disease process. Here the protective/resolving immunity lowers or raises the appropriate up/down transition probabilities {pij(J), qij(J)}. Clearly, some of the transitions (the resolving “down-arrows”) should increase with J, whereas others (the “up-arrows”) should decay, as shown in Fig. 2.
Figure 2.
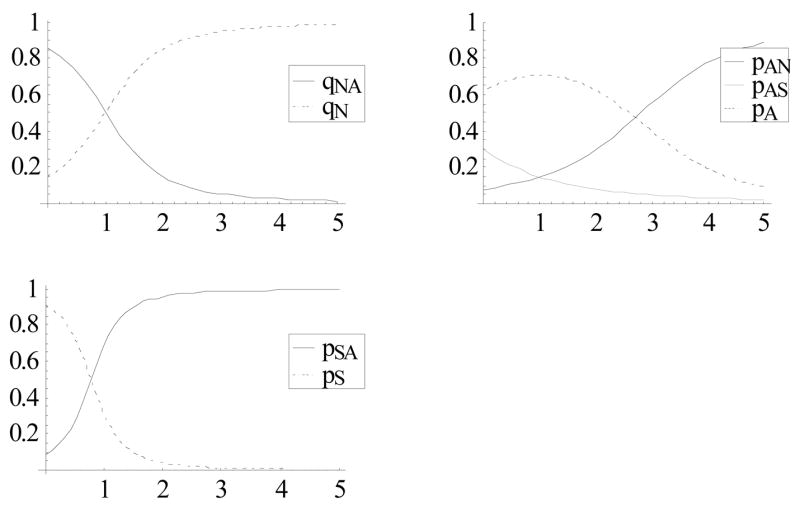
Transition probabilities as functions of J given by (3).
Variable J can change (wax or wane) at each time-step depending on the current disease state: x = {N, A, S}. We describe “waxing” by the (x-dependent) immune stimulation function σ(x, J) ≥ 0 (deterministic or stochastic) and “waning” by the immune loss factor λ < 1. Such a J will “accumulate” the disease history of the host. Both stimulation and loss will be made age-dependent (at early ages) to reflect immune maturation, as explained below. One can also make immune loss, as well as stimulation dependent on the disease state. It may affect (increase or decrease) immune production and resolution during A-S episodes; hence change their frequency and duration. But for the present model we adopt the simplest “independence” assumption.
The resulting (discrete-time) dynamic system combines a J-dependent stochastic Markov map on {N, A, S}-space, concurrent with x-dependent waxing-waning of J. We distinguish three Markov maps: (i) ΦR(J, x) defined by probabilities {pij (J)}, for the resolving R-step; (ii) ΦI(J, x) with probabilities {qij (J)} for the I-step; and (iii) ΦD(x) probabilities {rij} for the drug treatment D-step. The corresponding finite difference equations in variables x = {N, A, S}, and J > 0, as functions of discrete time t = 1,2,… become:
| (1) |
The host dynamics alternate between the R-step and I-step (ΦR;ΦI-maps) with random frequency ε = 0;1 (“0” for the resolving R-step; “1” for the inoculation I-step) given by EIR. So ε is a two-valued {0,1} random variable with probability distribution {p0, p1}, where p1 = EIR × Δt designates the mean number of inoculations over time-step Δt. The choice of time-step would set a limiting EIR value in our simulations, EIR ≤ 1/Δt/day.
2.2. Host parameters
We start with transition probabilities at the N, A, S nodes for the three steps. There are obvious relations among them, as shown in Table 1. One can choose any triplet, such as {pAN, pAS, pSA} for the R-step and {qNN, qAS, qSA} for the I-step, as input parameters, and compute the rest. The D-step depends on the drug dosage and efficacy. For a drug that is 100% efficacious, we expect rAA = rSS = 0, so a host would transition from S to A and from A to N with certainty (probability 1). Partial efficacy could be measured by a departure from certainty, i.e. parameters rSS;rAA > 0.
All probabilities {pij;qij} depend on immune variable J, as shown in Fig. 2. We make a few simplifying assumptions by (i) decoupling drug action from protective immunity J, so the drug-efficacy parameters rS;rA are independent of J; and (ii) assuming equal transition probabilities A ⇄ S for the R- and I-steps: qAS = pAS;qSA = pSA, and the increased “resident probability” qAA = pAA + pAN, compared to pA (so the inoculation step would maintain the A-state with higher probability, as we do not allow A → N transition). The resulting q-triplet requires one additional parameter, qNN. Decoupling drug action from immunity is another simplification, as more detailed analysis (e.g. [6]) exhibits more complicated patterns of interaction.
The waxing function (assumed to depend on the x-state alone) is determined by three values:
| (2) |
meaning “no stimulation at N,” “moderate stimulation at A,” and “stronger stimulation at S.” The waning factor λ < 1 corresponds to a typical loss/deactivation rate of immunity.
In total, we get four functional parameters {pij (J), qNN (J)} that define stochastic maps ΦR;ΦI and three scalars {σA, σS, λ}. The stimulation coefficients σA;σS can be either deterministic (with prescribed values) or stochastic (with prescribed statistics). The latter (stochastic coefficients) appear more appropriate for our disease-stimulation context (see Appendix), but in many cases such random σ produces behavior that is qualitatively similar to a deterministic (mean) case.
The probability functions {pij(J), qij (J)} can be crudely estimated by linking our disease-state model to some known examples of intra-host immune regulation of parasitemia (continuous [7–10] or discrete/stochastic [13,14]). We provide technical details of the derivation in the Appendix and state the result here: probabilities {pij;qN} can be expressed through a sigmoid function, e.g. φ(z) = e2z/1 + e2z), as follows:
| (3) |
as illustrated in Fig. 2. Parameters {JAN ;…} mark threshold immune levels for transitions (when the probability exceeds or falls below ½) and αA;… describe the slope/speed of transitions at these thresholds. The four subscripted J’s and three α’s encode the basic biologic mechanisms of immune regulation. Using continuous models [7,9,12], we derive the following (crude) estimates:
| (4) |
Overall, our approach to the immune-modulated disease process resembles stochastic work on immune-modulated parasite growth [13,14] in which parasite growth/transition is described by a replication factor (over its 2-day cycle), with J-dependent survival probability that accumulates past history. Here we look at random transitions among N-A-S disease states, whose probabilities are determined by an accumulated past history of disease.
2.3. Aging and maternal immunity
The ability to mount an efficient immune response develops with age [18]. In our formulation, the disease state (and the underlying level of parasitemia) results in production of immunity via “stimulation coefficients” σA;σS, whereas immunity regulates the course of disease (and associated parasitemia) through transition probabilities {pij (J)}. The immune efficiency reflects its combined stimulation, loss, and regulatory/clearing effect.
The simplest assumption is to fix all immune parameters (sigmas, lambda, and probability functions) in a “frozen” state. Such a frozen (non-aging) host might be an appropriate description for a mature adult. In children, immune efficiency (along with other physiological characteristics) develops with age and reaches maturity by adolescence. We account for the aging process by allowing slow temporal change of stimulation parameters σA (t);σS(t), from relatively low values in the early ages (0 < t < 2 years) to relatively high mature values by age 10. By the same pattern, the loss factor
| (5) |
(μ = immune loss rate/day) can also change with age t, from a relatively high value at young ages (0–6 months) to a relatively low (stable) adult value over 3–5 years of life. We show plausible functions σA/S(t), μ(t) in Fig. 3: both have typical initial and terminal values and a transition (“half-value”) age. Thus, we let the immune loss rate μ (t) vary between its mature value of 0.007/day (roughly corresponding to a 100-day period) and the early (child) value of 0.028/day, with the transitional age tL ≈ 1 year. The stimulation coefficient σA varies more widely, at 0.2 < σA (t) < 3, with transitional age tS ≈ 2.5 years, and a similar pattern is maintained for σS (t).
Figure 3.
Left: Immune stimulation coefficients over the 10-year period of early development reach half-maximal level at age tS= 2.5 years. Right: Immune loss factor μ(t) with half-maxima at tL = 6 months, 9 months, and 1 year.
Such patterns express the general ability of mature (adult) hosts to mount a more efficient immune response (enhanced J accumulation and reduced loss) under identical N-A-S conditions. A similar maturation concept can also apply to immune response/clearing parameters (4), but here we shall confine it to the σ, λ.
Another important factor in child protection over the first 4–6 months of life is maternal immunity. Therefore, we provide each (newborn) host with some initial level of J that decays at a higher rate compared with the normal immune waning (see the μ -function in Fig. 3). This maternal immunity could be practically depleted by the end of the first year without the immune stimulation that gradually builds up the host’s own immunity.
2.4. Disease severity
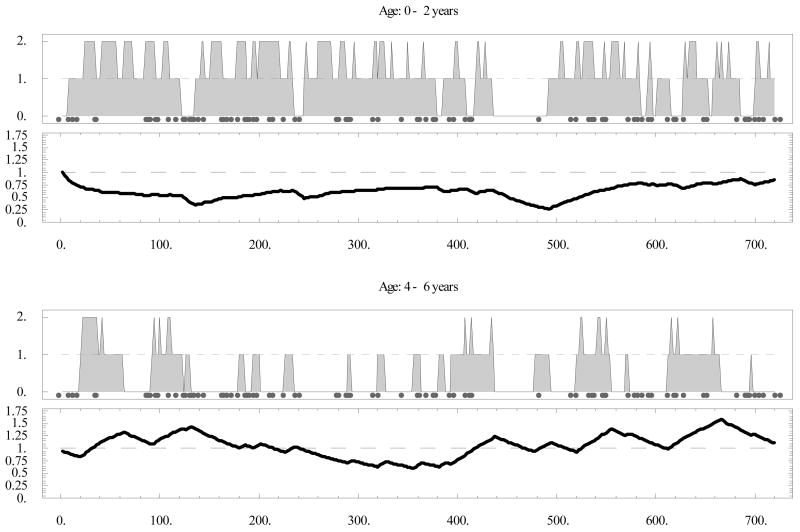
There are several ways to represent the severity of malaria disease on an individual level, and statistically on a community level. We call a severe episode any contiguous S-sequence of duration longer than two time-steps (4 days). One can count the number of such episodes over any given period (e.g., yearly bins: 0–1, etc.), and we call this the severity count. Alternatively, one can use some weighted count, e.g. the total duration of severe episodes over a given period (so that each episode is weighted in proportion to its duration), called here the severity index. Table 2 records severe episodes for a host of Fig. 4, counted over 6 years.
Table 2.
Duration of severe episodes (in units Δt=2 days) and severity over a 6-year period for a host of Fig. 4
| Age | Durations | Index | Count | ||||||||||||||
|---|---|---|---|---|---|---|---|---|---|---|---|---|---|---|---|---|---|
| 0–1 | 6 | 8 | 5 | 5 | 3 | 2 | 6 | 5 | 2 | 11 | 2 | 7 | 3 | 2 | 3 | 70 | 15 |
| 1–2 | 2 | 2 | 2 | 2 | 5 | 4 | 4 | 2 | 23 | 8 | |||||||
| 2–3 | 3 | 2 | 2 | 7 | 3 | ||||||||||||
| 3–4 | 2 | 3 | 4 | 9 | 3 | ||||||||||||
| 4–5 | 8 | 2 | 10 | 2 | |||||||||||||
| 5–6 | 2 | 2 | 4 | 2 | |||||||||||||
Figure 4.
Individual host history over a 6-year period at entomological inoculation rate (EIR) = 0.1/day (marked with gray circles). Levels {0,1,2} on the upper panels correspond to {N,A,S} states; respectively; lower panels show the immune effector variable J. N = not infected; A = asymptomatic; S = symptomatic.
Such a severity index has several potential applications. It can be related to recorded statistics of clinical cases, e.g. hospital admissions [20,21], and might be used to predict malaria complications and pathologic conditions (anemia, cerebral malaria) that lead to child mortality in many endemic areas. Recurrent severe episodes can also contribute cumulatively to the development of long-term chronic conditions and disabilities [22,24].
2.5. Drug treatment
Here we take a simplified view of drug action. After the drug is introduced at time t0, the dynamic process is changed from ΦR/I-map (1) to a persistent ΦD-map over the duration (half-life) T of the drug. So equation (1) is replaced with:
| (6) |
We further assume that new inoculations have no effect on the dynamics of disease over the drug-covered period: t0 < t < t0 + T. These are clearly oversimplifications. In reality, drug action depends on its concentration and efficacy at a given time. The concentration typically decays at an exponential rate (drug lifetime), which determines the effective cover window T ∞ 1/rate. The combined effect of drug + immunity exhibits yet more complicated patterns (e.g. [6]). To accommodate such features would require a refined version of the drug-map ΦD (and associated transition probabilities). It is not clear a priori, however, whether such modifications could produce significant long-term effects on the individual or statistical (cohort) levels.
Thus, the essential parameters for our simplified drug treatment include (i) treatment time/age t0; (ii) the effective cover window T; and (iii) to a lesser extent, its “A, S efficacy” parameters: {rA, rS}.
2.6. Vaccination
We also examine the effect of a hypothetical vaccine, administered at a certain (young) age t0, on disease. We assume a vaccine would have multiple effects, including (i) an immediate immune boost, by raising the J level by a certain amount or factor; and (ii) enhancement of immune stimulation coefficients {σA;σS} and lowering of the loss rate μ. Because both parameters are age dependent (they mature as the child develops), we can attain (ii) by a suitable “age shift” that will advance the host immune status to an older (effective) immune age. Therefore, the vaccine will shift the normal aging curves σA/S(t) and μ (t) (Fig. 3) to new values:
| (7) |
with the age-shift parameter tVB. The vaccinated infants will thus acquire better (more mature) immune protection. Thus, the essential vaccine parameters include (i) vaccination age t0; (ii) instantaneous J-boost factor B > 1, so that J = J (t0) →BJ; and (iii) maturation age-shift tVB.
We allow “immune boost” after vaccination along with “immune maturation” of stimulation-decay parameters. The basic idea behind maturation (aging) is to separate two processes: (i) relatively fast development of the specific anti-malarial immunity (effector J) in response to “challenge” (host disease state); (ii) slow change of the immune stimulation parameters with age, to allow more efficient “adult response” to an identical challenge, compared to that of a child. The immune parameters we allow to age (mature) include immune stimulation/decay rates {σA,S; λ}, while “clearing efficiency” parameters {Jij;αij} that enter transition probabilities (3)–(4), are kept fixed.
We explain the difference between two sets of parameters, and our choice for age-dependent ones. They represent different processes (aspects) of immune regulation. Indeed, increased σ will enhance production of J (antibodies) for a given A/S – challenge, while increased λ will slow its decay. The clearing parameters measure ‘sensitivity’ or ‘specificity’ of the J-effector, so that lower thresholds {Jij}, and higher {αij} will increase the likelihood of (disease) resolving transitions, and diminished “upsurge” probabilities.
In principle, mature (aged) immunity could enhance both sets, but we expect more pronounced effects for {σA,S;λ}. Indeed, specificity develops primarily in direct response to a challenge rather than the long-term (accumulated) history, or host age. Thus in our setup the main difference between an exposed or vaccinated host (with ‘immune memory’), and an immuno-naïve one, is in the speed of J-production rather than its specificity.
As our model identifies ‘aging’ with speed of J-production, rather than its ‘specificity’, we think of the long-term vaccination effect as a transition to more ‘mature/aged’ immune status. The proposed age-shift is one possible way to implement it.
Another plausible effect of vaccination (suggested by a referee) is to change transition probabilities, that is parameters {Jij,αij}, so that a vaccinated host would produce immune effectors of ‘higher specificity’.
3. Results
We explored stochastic system (1) on the individual and statistical/community levels by implementing it numerically in Wolfram Mathematica 5. The essential community characteristics included (i) N-A-S disease prevalences and immune statistics (mean J̄ = 〈J〉, and variance σJ2 = 〈(J − J̄)2〉); and (ii) severity index and severity count. Furthermore, we studied the effect of interventions, by drug treatment or vaccination, on the individual and community levels. We explored how these effects changed over time and how they depended on the essential parameters of infection (in our case, EIR).
3.1. Individual host
Fig. 4 shows a typical 6-year host history at EIR = 0.1/day. We saw an initial drop in “maternal” J (days 0–140 in the top panel), followed by a gradual increase through exposure, and a sequence of severe episodes (contiguous S-states). Note the gradual change in J slopes: a steep drop and slow ascent in the early years (top), compared with a slow drop and steeper ascent in the later years (bottom). Overall, the number and duration of severe episodes declined with immune maturation, as apparent by comparing the upper panel of Fig. 4 (ages 0–2) and the lower one (ages 4–6), as well as Table 2.
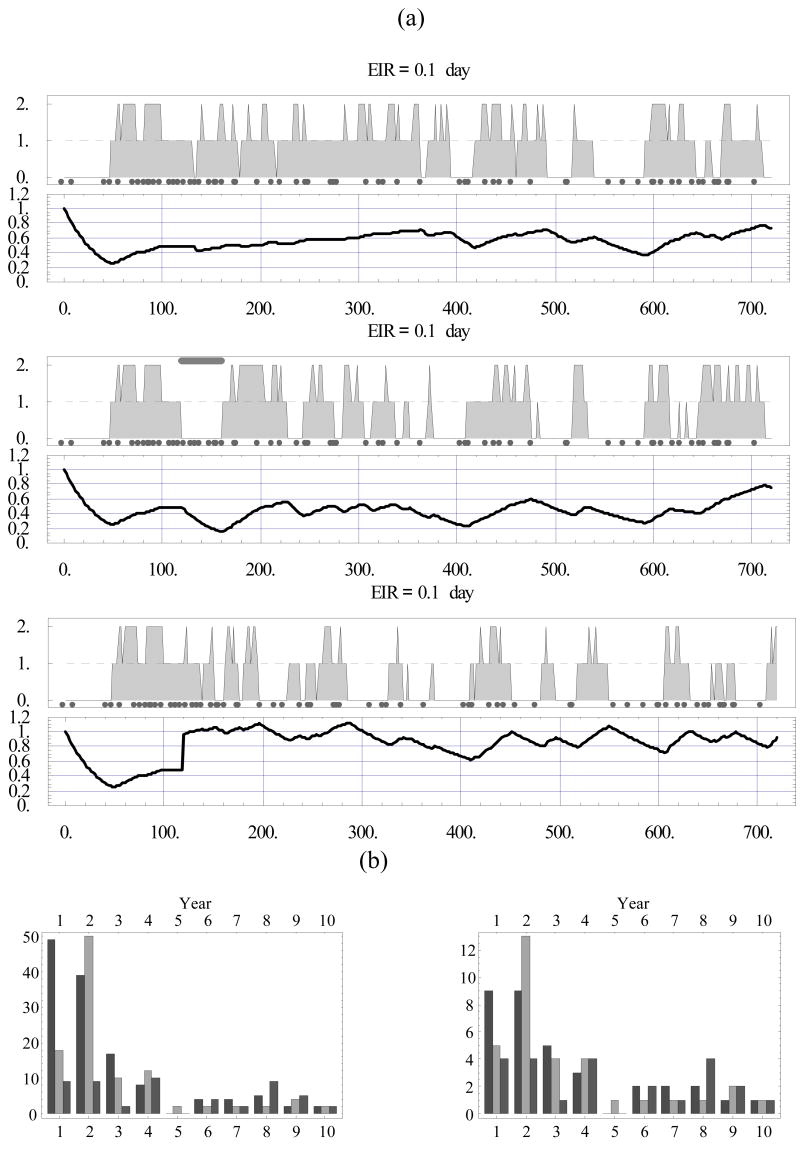
Next we subjected the host to treatment and vaccination. Fig. 5 (a) compares this hypothetical host (with identical inoculation history and immune regulation parameters) over his first 2 years of life in three cases: (top) untreated and unvaccinated; (middle) drug treatment at the fourth month, with a 40-day cover; and (bottom) vaccination at the fourth month, with vaccine boost B = 2 and age shift (immune maturation) of 2 years. We observed the treatment pushing severe episodes to the second year. The vaccination, marked by a 2-fold jump of J at day 120, with subsequently steeper stimulation and reduced decay curves, seemed to lessen the severity over an extended period. Fig. 5 (b) shows the severity index (left) and severity count (right) for these three cases. The treatment lowered both in the first year but created a rebound in the second year, after which both the treated and the untreated cases seem to level off. The vaccine gave a more sustained reduction over the first 2 years, but later its effects also seemed to level off, as in the other cases. We found that the drug had almost no net effect over the first 2–3 years on the count (i.e. a big effect in year 1 was countered by a big rebound in year 2), but did have a net effect on the index. In contrast, the vaccine appeared to have a net effect on both. Note that both dropped to zero, or nearly so, in year 5. The reason for a relatively short (transient) contribution of drug treatment can be explained by its effect on immunity. It dropped substantially (by a factor 2) over the cover period (days 120–270), whereas immune stimulation/loss parameters matured at their slow, natural pace. The overall effect was to make the host more susceptible after the treatment period compared with the untreated host, and even more so with the vaccinated host.
Figure 5.
(a) Identical hosts (with identical inoculation histories) over a 2-year period in three cases: (top) untreated; (middle) drug treatment administered at 4 months with drug half-life of 40 days (marked by gray horizontal bar); and (bottom) vaccination at 4 months. (b) Severity index (left) and severity count (right) in the three cases extended over the 10-year period (left to right bars).
A single history, however, may not be indicative of such outcomes because all hosts (treated or untreated) undergo a highly irregular, stochastic dynamic process. To corroborate and quantify these conclusions, we need to look at the statistical/ensemble means on the community level.
3.2. Community ensemble
We take a cohort of stochastic hosts (1), with the immune stimulation and loss functions of Fig. 3, and subjected each one of them to a random inoculation sequence with mean EIR = 0.05/day. The community can be made homogeneous (all disease-immune parameters identical) or we can easily incorporate any chosen degree of heterogeneity. Thus for most simulations below we use an ensemble of 500 nearly identical hosts. Precisely, they differ in their initial levels of maternal immunity (J0, a random variable with mean value 1 and variance 0.1), immune maturation (the half-value age of immune loss rate, tL, a random variable with mean 1 year and variance 0.1), and immune boost factor B (a random variable with mean 1.5 and variance 0.12).
We first calculated community statistics for the untreated population: N-A-S prevalence and mean J; their variances, correlations, etc.; and the mean severity index and count (Fig. 6). The results showed the A- and S-prevalences reaching their peaks (roughly 35%) at about 4 months along with mean 〈J〉, then slowly declining, leaving N predominant, a process concurrent with the buildup of mean immunity. While the mean J level steadily rose, its distribution became patchier (increased J variance in Fig. 6).
Figure 6.
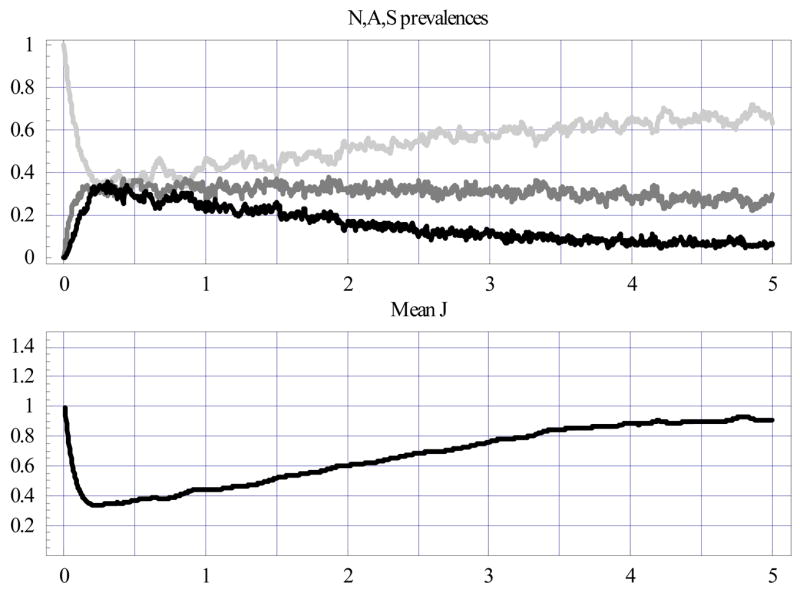
Random ensembles of 500 hosts at entomological inoculation rate (EIR) = 0.05/day. The upper plot shows NAS prevalences (N = light gray; A = medium gray; S = black), the lower one - mean J statistics.
Aging plays an important role here. A frozen immunity (i.e. frozen at a particular age) produced qualitatively different patterns: all variables (N-A-S prevalence, J statistics) equilibrated after several months and retained the frozen state (not shown). Maternal immunity also featured prominently at the initial stage here: its absence would drive the S- and A-peaks substantially higher (not shown).
Next we implemented and compared two community-wide interventions over the 5-year period. First, drug was administered at ages 4, 12, and 20 months, with drug cover window T = 40 days (close to mefloquine) and clearing efficacies given by resident probabilities: rA=.1; rS=.05 in the ΦD-map (6), i.e. a 10% chance to stay in the A-state and a 5% chance to stay in the S-state over a single time-step (Fig. 7). Second, vaccination was given at age 4 months, with randomly distributed vaccine boost B (mean 〈B〉 =1.5) and age shift (mean 〈tVB〉 =2 years) in (7) (Fig. 8).
Figure 7.
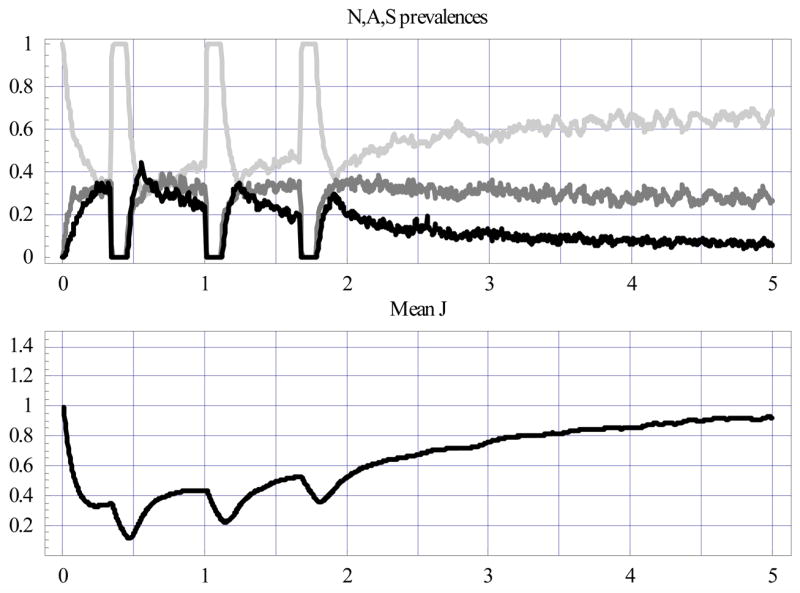
Same as Fig. 6 for the IPT cohort with three drug-treatment sessions (at ages 4, 12, and 20 months), marked by drops in A and S prevalence and mean J.
Figure 8.
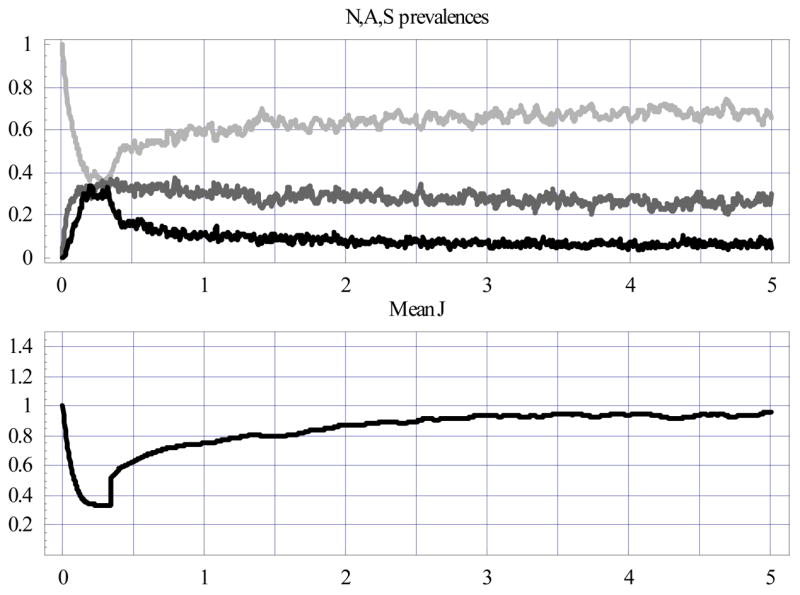
Same as Fig. 6 for vaccinated cohort at 4 months, marked by a sharp rise in mean J level (and its variance) and a subsequent drop in S prevalence.
Both interventions had pronounced effects on N-A-S prevalence and mean J in the early period (0–2 years), but these seemed to diminish later (2–5 years). In fact, by the fifth year, all three cases leveled off at about the same values: N-prevalence ≈65±5%; A-prevalence ≈30±5%; S-prevalence ≈10±2%, and mean 〈J〉 ≈.95. However, vaccination stabilized N-A-S prevalence and mean J much earlier than the drug or the natural, untreated process. Also note the slight spikes of A and S prevalence following the treatment window (clearly, decreased immunity – dips in the mean J curve – explain this feature).
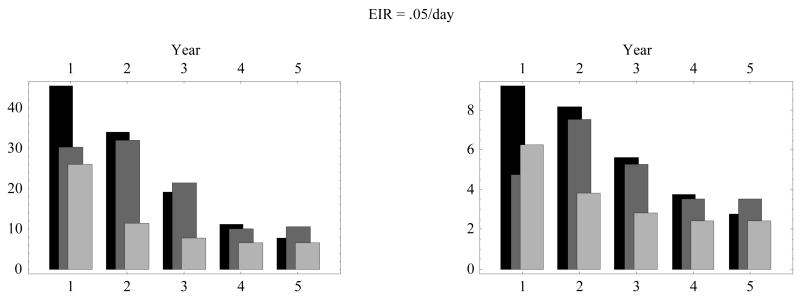
The pronounced difference between interventions appeared in the communal levels of disease severity and its yearly-bin distribution. Fig. 9 compares the severity index and count for all three cohorts (Fig. 6; Fig. 7; Fig. 8). Treatment reduced severity somewhat in the first year, but the drug cohort caught up with the untreated one from the second year on. Vaccination gave a substantial and persistent reduction over the 0- to 5-year period, however.
Figure 9.
Comparison of the ensemble-mean severity index (left) and severity count (right) over yearly bins (0–1; 1–2; … 4–5) for three ensembles: (i) the aging cohort of Fig. 6 (black bars); (ii) the treated cohort of Fig. 7 (gray bars); and (iii) the vaccinated cohort of Fig. 8 (light gray bars). EIR = entomological inoculation rate.
3.3. EIR and severity
Several of the recent studies noted above found a peculiar relation between EIR (force of infection) and the statistics of severe disease incidence, namely that the latter (e.g., clinical admissions) peaked at an intermediate level of EIR. Here we subjected our community of hosts to different levels of EIR to determine their effect on disease severity.
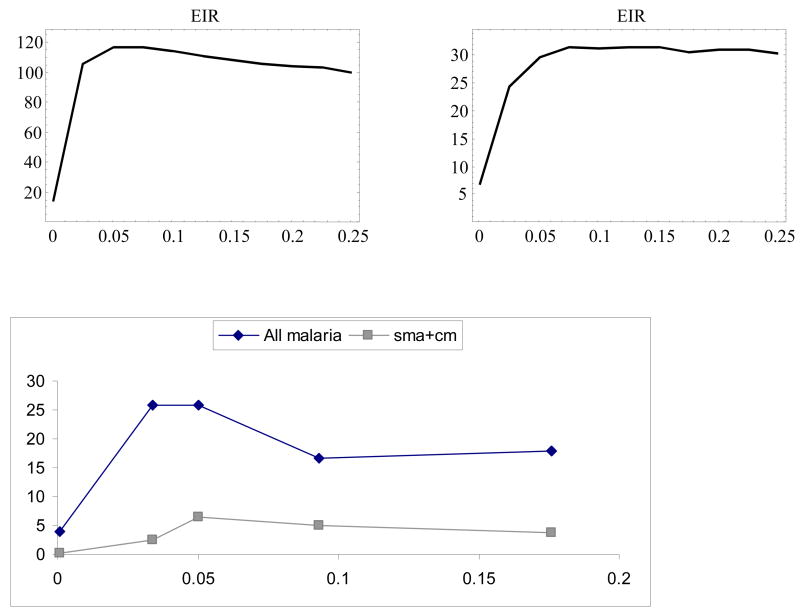
Fig. 10 shows the ensemble-mean severity index (left) and severity count (right) accumulated over the 5-year period (ages 0–5) as functions of EIR (in the range 0.01–0.25). For comparison, we plotted data for severe malaria [20] collected at five locations with dispersed EIR levels. Both indices exhibited characteristic peaks at moderate EIR and then dropped at higher values, consistent with the field data (right panel [20,21]). We attributed the declining mean severity at higher EIR to increased levels of J arising from persistent exposure. In highly endemic regions, a chronic asymptomatic parasitemia, below the threshold of detection by standard microscopy, is thought to contribute to immune protection in adults (premunition).
Figure 10.
Top: Severity index (left) and severity count (right) as functions of entomological inoculation rate (.01 < EIR < .25/day), versus (bottom) field data (after Snow et al. 1997 [19]). Data show the effect of EIR on prevalence of severe malaria (cases per 1000) in children aged 0–9. Cases include diagnoses of severe anemia (sma) + cerebral malaria (cm).
Fig. 11 shows the age distribution of the ensemble-mean severity over 5 yearly bins for a few selected EIR values: low, or 0.005; intermediate, or 0.045; and high, or 0.405. The low EIR had a characteristic concave curve (or bars) that peaked at age 2 and then dropped. The intermediate EIR curve had a “flat” count (and slowly decaying index) at early ages, with steeper decay later (falling below the low EIR curve after age 3.5). The high EIR curve started higher and dropped even more rapidly. These patterns are largely consistent with observed data; for example, [4] (Fig. 2), [2] (Fig. 1), [3] (Fig. 2), and [20] (Table 2). We attribute the patterns to specific disease-immune interactions at various ages and the resulting accumulated J.
Figure 11.

Distribution of the ensemble-mean severity index (left) and severity count (right) over the first five yearly bins, for three selected values of entomological inoculation rate EIR = 0.005 –(left columns- dark gray), 0.045 – middle columns (light gray), 0.405 (right columns- medium gray).
Indeed, low EIR combined with initial maternal immunity could delay the severity peak to the second year (or later). The continued low level of exposure would build J at a slow rate, so as to make such hosts more susceptible to severe episodes (hence with a higher severity index and count) over an extended period (ages 3–5). The intermediate and high EIR lead to higher severe incidence earlier (in the first year), as soon as maternal immunity drops below a protective level. At the same time, high EIR stimulates sufficient levels of immunity to provide better protection at later ages (ages 3–5).
4. Discussion
Previous approaches to modeling malaria on an intra-host level have considered interactions between populations of parasites (single or mixed) and immune effectors, and, for the most part, their implications at the intra-host level (e.g., antigenic variation in sustained infections with Plasmodium falciparum [13,14] or inter-species/inter-strain competition [10–13]). Here we consider interactions between immunity and disease, as simplistic but useful representations of host states, and examine their effects at the community level [25]. In particular, we were interested in the role that transmission intensity (EIR) plays in the statistics of disease severity in host populations.
We found a broad qualitative agreement between our results and those of published field studies, comparing our severity index over different ages and EIRs to age-incidence curves from sites with differing EIRs. However, we also noted discrepancies in detailed relationships that indicate shortcomings to be addressed in future work. For instance, although the age-incidence curves at the high and moderate EIR values in our Fig. 11 are qualitatively similar to those in Fig. 2 of Idro et al. [4], the data from their lowest-EIR site (Kabale, Uganda) show a marked rise in incidence for ages 2–3 and thus a noticeably convex curve over ages 1–4, whereas ours is only slightly convex.
Our intra-host model gives an extremely simplified, crude cartoon of the true host-parasite dynamics. We view it only as a first step in the development of realistic and efficient intra-host models. There are many ways to improve, modify and develop it further. One possibility is to incorporate a refinement of host state (beyond the three-level N-A-S) transitions and immunity. There are also many ways to go beyond simple stochasticity (pure random Markov transitions), and develop enhanced (e.g. two- to three-step) memory for disease progression. That is, rather than conditioning N-A-S transitions on a current (NAS-J) state through a single Markovian step, it could be conditioned on two to three prior states, i.e. to replace pi, j with pij,…,k, for instance pNA,N; pSA,N; pAA,N (for two-step memory). One would expect, for instance, that the NA or SA history would be less likely than AA to resolve into N, pNA,N; pSA,N < pAA,N, whereas in the current setup, all three are equal (= pA,N).
Furthermore, even highly endemic regions typically show seasonal variation in EIR and in the age-stratified incidence of clinical malaria, patterns that have significant implications for community-level immunity and for intervention programs [25]. Hence another important line of model development will be toward spatially distributed “individual-based” communities with more realistic transmission patterns (rather than simple EIR) and multiple parasite species/strains circulating within such communities. One such system, initiated previously [26], involves a detailed representation of intra-host dynamics and includes vector mosquitoes, making it computationally more extensive. Our approach here offers an alternative that reduces the complexities of intra-host regulation and vector population dynamics while maintaining sufficient detail and realism to address many empirical questions.
For instance, our simple model manages to capture the potential “rebound” effects of malaria interventions, in which protection against new infections allows acquired immunity to decay, such that a “compensatory” surge in clinical incidence may occur when protection is removed. Thus, cumulative incidence among those protected “catches up” with that of unprotected survivors in the same age cohort in the same community. Therefore, as suggested with respect to bednets [1], it is possible that lowering the effective EIR within a community would shift the age incidence of severe disease without substantially lowering the overall burden. We have previously suggested that the periodic administration of antimalarial drugs to infants without regard to their infection status (Intermittent Preventive Therapy) may cause similar effects under certain transmission conditions [27]. Our work here shows rebound effects with respect to drug but not vaccine intervention, because the effect of vaccine includes not only an immediate boost in immune response, but also a maturing of immune responsiveness. This representation reflects a real aim of malaria-vaccine development: to transform the immunologic profile of infants to that of clinically resilient adolescents or adults [23,28]. Thus, with the further developments outlined above, our modeling approach offers a conceptually realistic, computationally efficient tool for studying drug and vaccine effects on EIR- and age-related patterns of malaria infection and disease.
The present model is developed specifically for individual-based age cohorts, in which each host is subjected to a random force of infection with prescribed inoculation rate (EIR). There are several reasons to focus on age-cohorts, as opposed to more realistic age-structured communities. Our primary motivation was to examine the effect of preventive therapies on disease severity in young ages, where other (older) age groups play no role. More important, however is the prescribed force of infection (EIR) independent of hosts’ infectivity, so that infected hosts do not transmit disease to others via mosquito biting. An extension of our individual-based approach to complete communities would require two big modifications: (i) a proper measure of ‘infectivity’ linked to the host disease (NAS) state, and (ii) coupling of human infectivity to mosquito infection (see e.g. [26]). We postpone it to future studies.
Acknowledgments
The authors acknowledge helpful discussions with W.P. O’Meara and D.L. Smith, and detailed and substantive comments by the referees that helped us to improve the contents and exposition of the work.
Appendix
We build our stochastic three-state disease model based on deterministic “stimulation-clearing” models [10,11,13,14]. The simplest version consists of parasite density x(t), or “log-density” X(t) = ln x(t), and “rescaled” immune effector J(t), which obey a coupled differential system:
| (8) |
Here, a = .5ln16/day for parasite growth rate, and μ indicates loss rate of immunity. Function σ(X) should increase with X, but its specific form (linear as in [7,9] or “saturation type” as in [12]) is immaterial as far as the qualitative behavior of (8) is concerned. In all cases, it equilibrates at J* = 1, and some value X* > 0. Note that “strong” (clearing) immunity J >1 would drive the parasite down (X(t) →0), whereas subcritical J <1 would let it grow. System (8) is discretized with time-step Δt to get the following:
| (9) |
with the loss/deactivation factor λ ≈ (1− μΔt). We assume that our disease states roughly correspond to three different ranges of log-parasitemia X separated by thresholds: LN, ≪ LA ≪ LS (Fig. 12). A plausible choice is LN= 0;LA= 10; and LS= 13 on logarithmic X-scale (LN;LA are roughly separated by the log-distance between the sub-detectable (1/μl) and pyrogenic (105/μl) levels).
Figure 12.
Schematic partition of log-parasitemia X into three ranges corresponding to N,A,S states. N = not infected; A = asymptomatic; S = symptomatic.
We view N-A-S transition as a stochastic process, interpreted as a hypothetical frequency distribution of different N-A-S regions (for X-states) in a long-time host history, or alternatively a distribution of such regions for a sufficiently large sample (cohort) at any given time. Our goal is to estimate probability functions {pij;qij}based on the above L-bounds and a few basic parameters of (8).
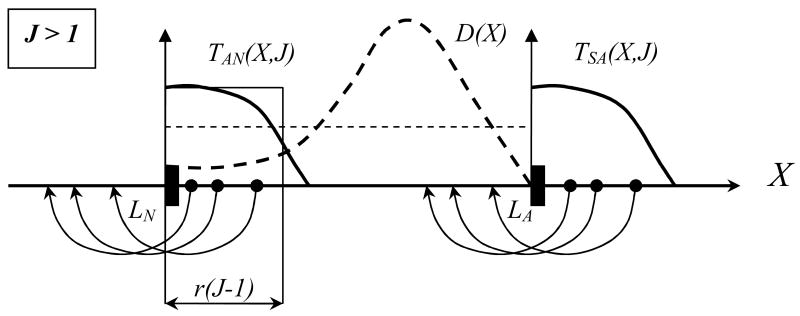
We imagine a hypothetical distribution of X-states in e.g. A-range, defined by a probability density , and consider a probability of transition to “cross from A to N”: 0< T (X, J) <1 (Fig. 13). Then we can estimate
Figure 13.
Schematic view of A → N; S → A transitions (case J > 1: strong clearing immunity) for different X-states in the S and A regions, with a hypothetical distribution D(X) in the A-range. Clearly, states close to interfaces LN;LA have higher transition probabilities. Thin solid and dashed lines show “uniform” approximations of T and D.
A deterministic model (9) predicts the range of X values adjacent to the interface LN= 0 to be shifted to the left (N-state) over time-step Δt, namely [0;r(J−1)], depending on proliferation factor r= aΔt and the strength of immune effector J >1. Assuming “uniform density” D and a “step-function” T over the range, we estimate the resulting N-A-S probabilities as follows:
| (10) |
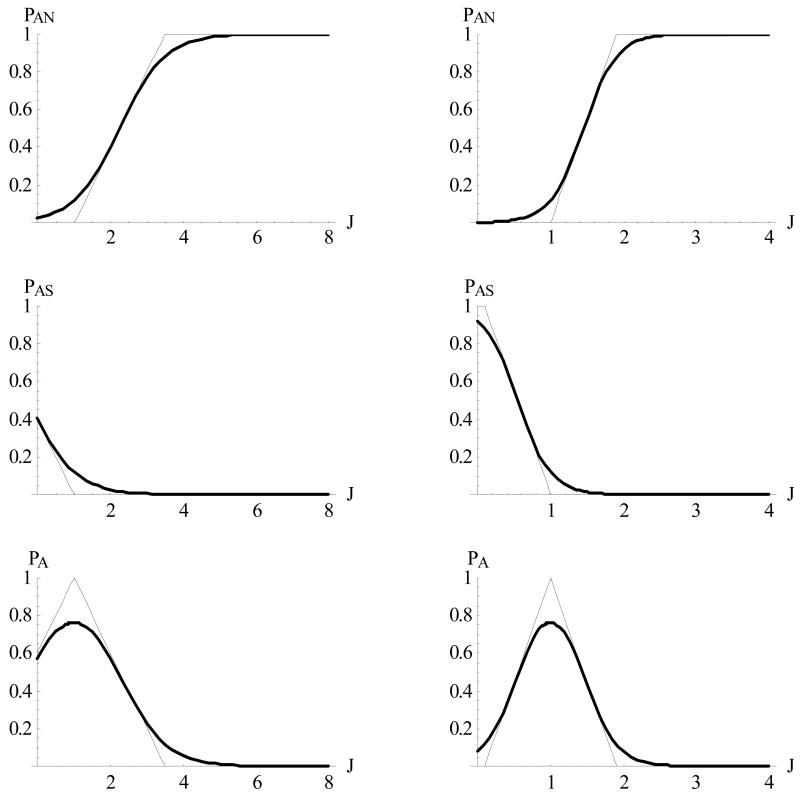
Fig. 14 shows such “piecewise linear” probability functions (10) along with their “smoothed out” approximations (3). Formula (10) contains two important parameters:
Figure 14.
Probability functions pAN; pAS; pA of (4) shown for two cases of parameter , αA <1 (left column) and αA >1 (right column), and their smoothed approximations.
| (11) |
that delineate transition intervals from p= 0 to p= 1, hence follow the probability thresholds:
| (12) |
expressed through α’s. Replacing piecewise linear functions in (10) with sigmoid , we get formula (3). Note that all parameters {αi;Jij}(11)–(12) can be computed from the underlying system (9), our choice of N-A-S thresholds, and time-step Δt. We use the following values for our numeric runs.
| N-A-S thresholds (log-scale) | LN = 0 (≈ 1 / μl); LN = 10 (≈ 2 · 104 / μl); LS = 13 (≈ 4 · 105 / μl) |
| Growth rate in (9) | r = aΔt = .5ln16Δt |
| Immune loss | μ = .007/day (≈ 100 day half-life) |
| J-production/loss | σ0 / μ = 2 |
| X-threshold | X0 = LN + .45 (LA−LN) (≈ 102 / μl) |
A similar method can be used to derive (estimate) immune stimulation coefficients {σA; σS}, but we use a simple empirical formulation.
Footnotes
Publisher's Disclaimer: This is a PDF file of an unedited manuscript that has been accepted for publication. As a service to our customers we are providing this early version of the manuscript. The manuscript will undergo copyediting, typesetting, and review of the resulting proof before it is published in its final citable form. Please note that during the production process errors may be discovered which could affect the content, and all legal disclaimers that apply to the journal pertain.
Contributor Information
David Gurarie, Email: David.Gurarie@case.edu.
F. Ellis McKenzie, Email: mckenzel@mail.nih.gov.
References
- 1.Snow RW, Marsh K. The consequences of reducing transmission of Plasmodium falciparum in Africa. Adv Parasitol. 2002;52:235–264. doi: 10.1016/s0065-308x(02)52013-3. [DOI] [PubMed] [Google Scholar]
- 2.Smith T, Killeen G, Lengeler C, Tanner M. Relationships between the outcome of Plasmodium falciparum infection and the intensity of transmission in Africa. Am J Trop Med Hyg. 2004;71s2:80–86. [PubMed] [Google Scholar]
- 3.Reyburn H, Mbatia R, Drakeley C, Bruce J, Carneiro I, Olomi R, Cox J, Nkya WM, Lemnge M, Greenwood BM, Riley EM. Association of transmission intensity and age with clinical manifestations and case fatality of severe Plasmodium falciparum malaria. J Am Med Assoc. 2005;293:1461–1470. doi: 10.1001/jama.293.12.1461. [DOI] [PubMed] [Google Scholar]
- 4.Idro R, Aloyo J, Mayende L, Bitarakwate E, John CC, Kivumbi GW. Severe malaria in children in areas with low, moderate and high transmission intensity in Uganda. Trop Med Int Health. 2006;11:115–124. doi: 10.1111/j.1365-3156.2005.01518.x. [DOI] [PubMed] [Google Scholar]
- 5.Richard A, Richardson S, Maccario J. A three-state Markov model of Plasmodium falciparum parasitemia. Math Biosci. 1993;117:283–300. doi: 10.1016/0025-5564(93)90029-a. [DOI] [PubMed] [Google Scholar]
- 6.Bailey NTJ. The biomathematics of malaria. C. Griffin & Co; London: 1982. [Google Scholar]
- 7.Mason DP, McKenzie FE. Blood-stage dynamics and clinical implications of mixed Plasmodium vivax-Plasmodium falciparum infections. Am J Trop Med Hyg. 1999;61:367–374. doi: 10.4269/ajtmh.1999.61.367. [DOI] [PMC free article] [PubMed] [Google Scholar]
- 8.Mason DP, McKenzie FE, Bossert WH. The blood-stage dynamics of mixed Plasmodium malariae-Plasmodium falciparum infections. J Theor Biol. 1999;198:549–566. doi: 10.1006/jtbi.1999.0932. [DOI] [PubMed] [Google Scholar]
- 9.Gurarie D, Zimmerman PA, King CH. Dynamic regulation of single- and mixed-species malaria infection: insights to specific and non-specific mechanisms of control. J Theor Biol. 2006;240:185–199. doi: 10.1016/j.jtbi.2005.09.015. [DOI] [PubMed] [Google Scholar]
- 10.Gurarie D, McKenzie FE. Dynamics of immune response and drug resistance in malaria infection. Malaria J. 2006;5:86. doi: 10.1186/1475-2875-5-86. [DOI] [PMC free article] [PubMed] [Google Scholar]
- 11.Recker M, Nee S, Bull PC, Kinyanjui S, Marsh K, Newbold C, Gupta S. Transient cross-reactive immune responses can orchestrate antigenic variation in malaria. Nature. 2004;429:555–558. doi: 10.1038/nature02486. [DOI] [PubMed] [Google Scholar]
- 12.Austin DJ, White NJ, Anderson RM. The dynamics of drug action on the within-host population growth of infectious agents: melding pharmacokinetics with pathogen population dynamics. J Theor Biol. 1998;194:313–339. doi: 10.1006/jtbi.1997.0438. [DOI] [PubMed] [Google Scholar]
- 13.Molineaux L, Diebner HH, Eichner M, Collins WE, Jeffery GM, Dietz K. Plasmodium falciparum parasitaemia described by a new mathematical model. Parasitology. 2001;122:379–391. doi: 10.1017/s0031182001007533. [DOI] [PubMed] [Google Scholar]
- 14.Paget-McNicol S, Gatton M, Hastings I, Saul A. The Plasmodium falciparum var gene switching rate, switching mechanism and patterns of parasite recrudescence described by mathematical modeling. Parasitology. 2002;124:225–235. doi: 10.1017/s0031182001001160. [DOI] [PubMed] [Google Scholar]
- 15.Artavanis-Tsakonas K, Tongren JE, Riley EM. The war between the malaria parasite and the immune system: immunity, immunoregulation and immunopathology. Clin Exp Immunol. 2003;133:145–152. doi: 10.1046/j.1365-2249.2003.02174.x. [DOI] [PMC free article] [PubMed] [Google Scholar]
- 16.Mwangi TW, Mohammed M, Dayo H, Snow RW, Marsh K. Clinical algorithms for malaria diagnosis lack utility among people of different age groups. Trop Med Int Health. 2005;10:530–536. doi: 10.1111/j.1365-3156.2005.01439.x. [DOI] [PMC free article] [PubMed] [Google Scholar]
- 17.Kaestli M, Cockburn IA, Cortes A, Baea K, Rowe JA, Beck HP. Virulence of malaria is associated with differential expression of Plasmodium falciparum var gene subgroups in a case-control study. J Infect Dis. 2006;193:1567–1574. doi: 10.1086/503776. [DOI] [PMC free article] [PubMed] [Google Scholar]
- 18.Rogers WO, Atuguba F, Hodgson A, Koram KA. Clinical case definitions and malaria vaccine efficacy. J Infect Dis. 2006;193:467–473. doi: 10.1086/499314. [DOI] [PubMed] [Google Scholar]
- 19.Gupta S, Snow RW, Donnelly CA, Marsh K, Newbold C. Immunity to noncerebral severe malaria is acquired after one or two infections. Nature Med. 1999;5:340–343. doi: 10.1038/6560. [DOI] [PubMed] [Google Scholar]
- 20.Snow RW, Omumbo JA, Lowe B, Molyneux CS, Obiero JO, Palmer A, Weber MW, Pinder M, Nahlen B, Obonyo C, Newbold C, Gupta S, Marsh K. Relation between severe malaria morbidity in children and level of Plasmodium falciparum transmission in Africa. Lancet. 1997;349:1650–1654. doi: 10.1016/S0140-6736(97)02038-2. [DOI] [PubMed] [Google Scholar]
- 21.Kitua AY, Smith TA, Alonso PL, Urassa H, Masanja H, Kimario J, Tanner M. The role of low level Plasmodium falciparum parasitaemia in anaemia among infants living in an area of intense and perennial transmission. Trop Med Int Health. 1997;2:325–333. doi: 10.1111/j.1365-3156.1997.tb00147.x. [DOI] [PubMed] [Google Scholar]
- 22.Beier JC, Killeen GF, Githure JI. Entomologic inoculation rates and Plasmodium falciparum malaria prevalence in Africa. Am J Trop Med Hyg. 1999;61:109–113. doi: 10.4269/ajtmh.1999.61.109. [DOI] [PubMed] [Google Scholar]
- 23.Breman JG, Alilio MS, Mills A. Conquering the intolerable burden of malaria: what’s new, what’s needed: a summary. Am J Trop Med Hyg. 2004;71s2:1–15. [PubMed] [Google Scholar]
- 24.Roberts DJ, Casals-Pascual C, Weatherall DJ. The clinical and pathophysiological features of malarial anaemia. Curr Topics Microbiol Immunol. 2005;295:137–167. doi: 10.1007/3-540-29088-5_6. [DOI] [PubMed] [Google Scholar]
- 25.McKenzie FE, Killeen GF, Beier JC, Bossert WH. Seasonality, parasite diversity and local extinctions in Plasmodium falciparum malaria. Ecology. 2001;82:2673–2681. doi: 10.1890/0012-9658(2001)082[2673:spdale]2.0.co;2. [DOI] [PMC free article] [PubMed] [Google Scholar]
- 26.McKenzie FE, Bossert WH. An integrated model of Plasmodium falciparum dynamics. J Theor Biol. 2005;232:411–426. doi: 10.1016/j.jtbi.2004.08.021. [DOI] [PubMed] [Google Scholar]
- 27.O’Meara WP, Smith DL, McKenzie FE. Potential impact of intermittent preventive treatment (IPT) on spread of drug resistant malaria. PloS Med. 2006;3:633–642. doi: 10.1371/journal.pmed.0030141. [DOI] [PMC free article] [PubMed] [Google Scholar]
- 28.Schofield L, Mueller I. Clinical immunity to malaria. Curr Mol Med. 2006;6:205–221. doi: 10.2174/156652406776055221. [DOI] [PubMed] [Google Scholar]


