

Abstract
Purpose
To study the long-term effect of being overweight on mortality in very elderly subjects.
Methods
The medical records of 470 inpatients (226 males) with a mean age of 81.5 ± 7 years and hospitalized in an acute geriatric ward between 1999 and 2000 were reviewed for this study. Body mass index (BMI) at admission day was subdivided into quartiles: <22, 22–25, 25.01–28, and ≥28 kg/m2. Patients were followed-up until August 31, 2004. Mortality data were taken from death certificates.
Results
During a mean follow-up of 3.46 ± 1.87 years (median 4.2 years [range 1.6 to 5.34 years]), 248 patients died. Those who died had lower baseline BMI than those who survived (24.1 ± 4.2 vs 26.3 ± 4.6 kg/m2; p < .0001). The age-adjusted mortality rate decreased from 24 to 9.6 per 100 patient-years from the highest to lowest BMI quartile (p < .001). BMI was associated with all-cause and cause-specific mortality even after controlling for sex. A multivariate Cox proportional hazards model identified that even after controlling for male gender, age, renal failure, and diabetes mellitus, which increased the risk of all-cause mortality, elevated BMI decreased the all-cause mortality risk.
Conclusions
In very elderly subjects, elevated BMI was associated with reduced mortality risk.
KEY WORDS: elderly, body mass index, mortality
INTRODUCTION
Obesity has increased remarkably over the world in the last decades and its prevalence is particularly high in elderly adults.1–3 It is estimated that more than two thirds of individuals aged 60 years and older are overweight or obese. The exact impact of elevated body mass index (BMI) on mortality is unclear. It is well accepted that being overweight and obese confer increased risk for total, cardiovascular, and cancer mortality.1,3–7 However, there is some evidence that in certain populations, including the elderly, individuals with coronary heart disease, congestive heart failure, rheumatoid arthritis, and end stage renal failure on dialysis, increased BMI may reduce mortality risk.8–13 Most studies that have evaluated the association between BMI and mortality have been carried out in community-dwelling persons of different age groups.1,5,14–17 Data on the association between BMI measured during hospitalization and long-term mortality in very elderly patients is scarce.18 It is conceivable that this simple, routine, and noninvasive measure could facilitate mortality risk stratification in hospitalized elderly.
The purpose of this study was to retrospectively evaluate the relationship between BMI and long-term mortality in a group of very elderly subjects who were hospitalized in an acute geriatric ward.
SUBJECTS AND METHODS
Study Population
During a 2-year period (January 1, 1999 to December 31, 2000), all subjects who were admitted consecutively to an acute geriatric ward in the framework of a study on orthostatic hypotension were evaluated.19 Subjects were included in the aforementioned study if they were at least 60 years old and were able on admission to stand to measure their height, weight, and blood pressure. Subjects who, for medical reasons, could not or were unwilling to stand on admission were excluded from the study. Of 1,852 patients who were hospitalized during this period, 470 patients were included in that study (see Fig. 1). The present study reports on follow-up data from the abovementioned cohort. Subjects were followed-up until August 31, 2004. Records on mortality were obtained from the day of admission to the acute geriatric ward until the end of the follow-up period.
Figure 1.
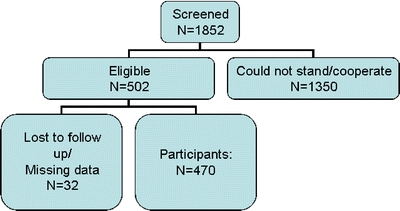
Subject dispensation. Age did not differ significantly between subjects who were included and those who were not included in the present study sample. Included subjects were 81.5 ± 6.8 years of age vs 82.3 ± 7.5 years of age in the nonincluded group, p = 0.12. Sex was also similarly distributed between included and nonincluded subjects. Among included subjects, 51.9% were female compared to 53.4% of the nonincluded subjects, p = 0.6. Finally, subjects did not differ in terms of duration of hospitalization, a marker of patient complexity/severity. Hospitalization duration was 11.4 ± 10.3 days among included subjects and 11.8 ± 11.1 days among nonincluded subjects, p = 0.5
This retrospective study based on the blind review and analysis of medical records was approved by the Institutional and Ministry of Health Ethics Committees.
Data Collection
Obtained from the medical record were findings of the clinical evaluation performed on each subject at the time of hospital admission, including detailed medical history and standard physical examination. The following variables were recorded: age, height, weight, ethnic origin, reason(s) for admission, diagnoses, and prescribed medications.
Laboratory findings extracted from the medical record included complete blood cell count and chemistry: serum glucose, urea, creatinine, sodium, potassium, thyrotropin, vitamin B12, and folic acid. Comorbid conditions were also identified from the medical record. Hypertension was defined as the presence of a prescription for antihypertensive medications in the medical record or a blood pressure (BP) recording greater than 140/90 mmHg on 2 or more repeated measurements. Diabetes mellitus was defined as the presence of hypoglycemic agents in the medical record or a recording of fasting blood glucose of 126 mg/dL on 2 or more measurements. Renal failure was defined as serum creatinine of ≥1.5 mg/dL on more than 2 measurements.
Body Mass Index
Weight and height were measured to the nearest 0.5 kg and 0.5 cm, respectively, and BMI was calculated as weight (kg) divided by height (m2). BMI was divided into quartiles: <22, 22–25, 25.01–28, and ≥28 kg/m2.
Mortality Data
Mortality data from January 1, 1999 through August 31, 2004 were extracted from the Population Registry of the Ministry of Interior Affairs. Cause of death was obtained from death certificates and medical records.
Cardiovascular mortality was defined as death from stroke, myocardial infarction, congestive heart failure, sudden death, rupture of aortic aneurysm, arrhythmia, or other thromboembolic event. A total of 291 causes are recorded for 248 deaths because more than 1 cause of death was identified for some patients.
Statistical Analysis
Descriptive statistics for continuous variables are reported as the mean±standard deviation. Baseline characteristics of the study population were compared by BMI quartile and by survival status. Continuous variables were compared by BMI quartile using ANOVA and post hoc, pairwise testing was carried out using Bonferroni’s method. A p value <.0026 indicated a significant result, thus preserving an overall significance level of .05.Categorical variables were compared by BMI quartile using the chi-square test. Age-adjusted mortality rates, expressed per 100 person-years of follow-up, were compared by BMI quartiles and Kaplan–Meier curves with log rank/Wilcoxon test. Furthermore, survival was modeled using Cox proportional hazard regression including BMI quartile, systolic and diastolic BP, age, gender, diabetes mellitus, hypertension, ischemic heart disease (IHD), congestive heart failure (CHF), smoking, Parkinsonism, prescribed medication, and 2 indicator variables constructed to identify patients with more than 1 chronic disease and patients prescribed more than 1 medication. The results are presented as hazard ratios (HR) and 95% confidence intervals (95%CI). All independent variables, including all two-way interactions, were entered and subsequently withdrawn from the model using a forward, stepwise approach. A variable was included in the model if it made a contribution at the .15 level of significance and was removed if after the addition of subsequent variables to the model, it no longer made a contribution at the .05 significance level. The proportional hazards (PH) assumptions were tested using the baseline empirical cumulative hazards function Ĥ0(t) (EHF).
RESULTS
Study Population
Patient characteristics at baseline are presented in Table 1. The mean BMI was 25.2 ± 4.5 kg/m2 (range 15.0–42.2). Patients in the highest BMI quartile were more likely to be female and had the highest blood pressure (BP) levels (Table 1). They also had a higher rate of hypertension (p < .0001) and a lower rate of Parkinson’s disease (p = .01) than those in the lowest quartile of BMI. Patients in the highest BMI quartile used more beta-blockers (p = .002) and diuretics (p = .01) than those in the lowest BMI quartile (Table 1).
Table 1.
Baseline Patient Characteristics by BMI Quartile
| Category | All (n = 470) | <22 (n = 109) | 22–25 (n = 131) | 25.01–28 (n = 118) | ≥28 (n = 112) | p value |
|---|---|---|---|---|---|---|
| Characteristics | ||||||
| Age (years) | 82 ± 7 | 83 ± 7 | 82 ± 6 | 81 ± 7 | 80 ± 7 | .0023 |
| Gender (% female) | 51.9 | 52.3 | 47.3 | 44.9 | 64.3 | .015 |
| Presently smoking (%) | 16.5 | 19.8 | 15.4 | 16.5 | 14.5 | .74 |
| BMI (kg/m2) | 25.2 ± 4.5 | 19.7 ± 1.8 | 23.5 ± 0.9 | 26.5 ± 0.9 | 31.1 ± 3.0 | |
| SBP (mmHg) | 147 ± 24 | 142 ± 24 | 144 ± 22 | 147 ± 24 | 154 ± 26 | .0009 |
| DBP (mmHg) | 72 ± 15 | 69 ± 14 | 71 ± 14 | 72 ± 14 | 77 ± 15 | .0014 |
| HR (beats/min) | 77 ± 14 | 78 ± 13 | 78 ± 13 | 76 ± 15 | 75 ± 14 | .24 |
| Comorbid diseases, n (%) | ||||||
| Hypertension | 294 (63) | 57 (52) | 63 (48) | 83 (70) | 91 (82) | <.0001 |
| Diabetes mellitus | 137 (29) | 32 (29) | 38 (29) | 38 (32) | 29 (26) | .77 |
| IHD | 266 (57) | 63 (58) | 65 (50) | 73 (62) | 65 (59) | .27 |
| CHF | 144 (31) | 34 (31) | 31 (24) | 36 (31) | 43 (39) | .08 |
| Stroke | 150 (32) | 31 (28) | 40 (31) | 40 (34) | 39 (35) | .7 |
| Chronic renal failure | 115 (24) | 19 (17) | 28 (21) | 42 (36) | 26 (23) | .01 |
| Chronic lung disease | 106 (23) | 29 (27) | 18 (14) | 29 (25) | 30 (27) | .04 |
| Parkinson | 60 (13) | 16 (15) | 26 (20) | 13 (11) | 5 (5) | .003 |
| Medication use, n (%) | ||||||
| Diuretics | 161 (34) | 31 (28) | 40 (31) | 39 (33) | 51 (46) | .034 |
| ACE inhibitors | 148 (31) | 30 (28) | 25 (27) | 43 (36) | 40 (36) | .22 |
| Calcium antagonists | 142 (30) | 27 (25) | 35 (27) | 39 (33) | 41 (37) | .18 |
| Nitrates | 132 (28) | 28 (26) | 30 (23) | 36 (31) | 38 (34) | .23 |
| Beta-blockers | 84 (18) | 14 (13) | 17 (13) | 19 (16) | 34 (30) | .002 |
| Sleeping pills | 131 (28) | 23 (21) | 38 (29) | 31 (26) | 39 (35) | .14 |
BMI: body mass index, SBP: systolic blood pressure, DBP: diastolic blood pressure, HR: heart rate, IHD: ischemic heart disease, CHF: congestive heart failure, ACE: angiotensin converting enzyme
Mortality Rate
There were a total of 248 deaths in the entire cohort over a mean follow-up of 3.46 ± 1.87 years (median 4.2 years [range 1.6 to 5.34 years]). The overall mortality rate was 15.3 per 100 person-years. Those who died had lower baseline BMI than those who survived (24.1 ± 4.2 vs 26.3 ± 4.6 kg/m2; p < .0001). Those who died were more likely to be men and to have ischemic heart disease, congestive heart failure, diabetes mellitus, Parkinson’s disease, and more than 1 disease than those who survived (Table 2).
Table 2.
Patient Characteristics by Survival Status
| Characteristics | Alive (n = 222) | Died (n = 248) | p value |
|---|---|---|---|
| Mean ± SD | Mean ± SD | ||
| Age (years) | 79.4 ± 6.4 | 83.4 ± 6.6 | .4 |
| Gender (% females) | 57.65 | 46.77 | .02 |
| BMI (kg/m2) | 26.3 ± 4.6 | 24.1 ± 4.2 | <.0001 |
| SBP (mmHg) | 148 ± 24 | 145 ± 24.4 | .98 |
| DBP (mmHg) | 73 ± 14 | 72 ± 15 | .92 |
| Heart rate (beats/min) | 76 ± 14 | 78 ± 14 | .18 |
| Comorbid diseases, n (%) | |||
| Hypertension | 141 (64) | 153 (62) | .7 |
| Diabetes mellitus | 69 (31) | 103 (42) | .04 |
| Ischemic heart disease | 114 (52) | 152 (62) | .03 |
| Congestive heart failure | 51 (23) | 93 (38) | .0015 |
| Stroke | 68 (31) | 82 (33) | .6 |
| Renal failure | 37 (17) | 78 (31) | .0002 |
| Chronic lung disease | 42 (19) | 64 (26) | .1 |
| Parkinson | 17 (8) | 43 (17) | .0014 |
| More than 1 disease | 211 (95) | 244 (98) | .04 |
| Medication use, n (%) | |||
| Diuretics | 68 (31) | 93 (38) | .15 |
| ACE inhibitors | 66 (30) | 82 (33) | .4 |
| Calcium antagonists | 68 (31) | 74 (30) | .9 |
| Nitrates | 52 (23) | 80 (32) | .05 |
| Beta-blockers | 47 (21) | 37 (15) | .07 |
| Sleeping pills | 61 (27) | 70 (28) | .9 |
| More than 1 medication | 116 (52) | 131 (53) | .9 |
BMI: body mass index, SBP: systolic blood pressure, DBP: diastolic blood pressure, ACE: angiotensin converting enzyme, beats/min: beats per minute
Death was most frequently because of cardiovascular diseases (n = 127), sepsis (n = 111), and malignancy (n = 34). Women died less frequently than men from cardiovascular causes [HR = 0.68; 95%CI = 0.47–0.98, p = .036].
Effect of BMI on Mortality
Patients with the lowest BMI had the highest rate of mortality (Table 3). As can be seen, the age-adjusted mortality rate decreased from 24 per 100 patient-years in the lowest BMI quartile to 9.6 per 100 patient-years in the highest BMI quartile (p < .001).
Table 3.
Mortality Rate by BMI Quartile
| BMI (kg/m2) category | Number of patients | Number of deaths | Mortality rate per 100 patient-years | Age adjusted mortality per 100 patient-years |
|---|---|---|---|---|
| <22 | 109 | 75 | 25.48 | 24 |
| 22–25 | 131 | 72 | 15.37 | 15.4 |
| 25.01–28 | 118 | 62 | 15.06 | 15.4 |
| ≥28 | 112 | 39 | 8.89 | 9.6 |
BMI: body mass index
p = .001
To avoid the influence of an acute disease during hospitalization on death rate, data were reanalyzed after excluding the 42 subjects who died within 6 months of hospitalization. After the elimination of these subjects, the mortality rate remained the highest among those in the lowest BMI quartile. BMI was inversely associated with mortality regardless of sex and cause of death (data not shown). The mortality rate was significantly higher in subjects with the lowest BMI quartile compared to the highest BMI quartile (Fig. 2; p < .0001). A multivariate Cox proportional hazards model analysis demonstrated that male gender, age, diabetes mellitus, and renal failure increased, whereas highest BMI quartile decreased all-cause mortality risk (Table 4). Specifically, male gender increased the risk of all-cause mortality by a relative 38% (95%CI = 6–78%); each 1-year increase in age increased the all-cause mortality risk by a relative 6% (95%CI = 4–9%); diabetes increased the risk of all-cause mortality by 53% (95%CI = 18–99%); and renal failure increased the all-cause mortality risk by a relative 72% (95%CI = 28–129%). Conversely, the highest quartile of BMI decreased all-cause mortality risk by a relative 33% (95%CI = 13–49%).
Figure 2.
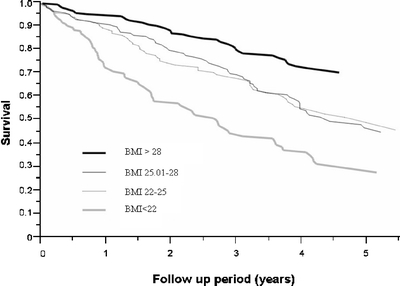
Survival curves by BMI quartile
Table 4.
Factors Affecting Survival (Cox Proportional Hazards Model)
| Variable | Hazard ratio | 95% confidence interval | p value |
|---|---|---|---|
| Male gender | 1.38 | 1.06–1.78 | .015 |
| Age (1 year) | 1.06 | 1.04–1.09 | <.0001 |
| Diabetes mellitus | 1.53 | 1.18–1.99 | .0016 |
| Renal failure | 1.72 | 1.28–2.29 | .0004 |
| BMI (kg/m2) | |||
| <22 | 1.63 | 1.3–2.03 | <.0001 |
| 22–25 | 0.97 | 0.79–1.20 | |
| 25.01–28 | 0.93 | 0.74–1.16 | |
| ≥28 | 0.67 | 0.51–0.87 | |
BMI: body mass index
DISCUSSION
In this retrospective cohort of elderly patients admitted to an acute geriatric ward, increased BMI was associated with a lower mortality rate. The association between BMI and mortality rate was linear and not U- or J-shaped. Thus, in very old hospitalized subjects, low BMI values were deleterious rather than favorable. The deleterious effect of low BMI was observed in both sexes and held true regardless of the cause of death.
Elevated BMI has been associated with decreased mortality through the preservation of fat-free mass.20 Nicoletti et al.21 suggested that the neurohormonal system might protect the overweight individual against the catabolic effects of some diseases. Low fat-free mass itself has been associated with mortality as described by Allison et al. and Heitmann et al.22,23 Fat-free mass was not measured in the present study, but it is reasonable to assume that these very elderly patients had low fat-free mass.
The findings of the present study are consistent with those of Fonarrow et al. who recently reported improved survival among subjects with elevated BMI in a very large cohort of individuals hospitalized for decompensated CHF.24 Proposed mechanisms for the improved survival were observed to be associated with increased BMI including modulation of the inflammatory response and increased nutritional and metabolic reserve.25
Results of the present study are in contrast to those of Calle et al.5 and others who reported that obesity is associated with the increased rate of mortality.1,15,26–29 The deleterious effect of being overweight on mortality was mainly observed in young and middle-age subjects.5,14,15,30,31 In these age groups, obesity may be accompanied by traditional cardiac risk factors such as hypertension, diabetes mellitus, sedentary lifestyle, and hyperlipidemia.1,2,5,7,16,32–34 Indeed, in the present cohort, patients in the highest BMI quartile were more likely to have hypertension and were more frequently treated with diuretics and beta-blockers.
It is possible that the present cohort reflects selective survival into very old age such that younger obese individuals with cardiovascular disease would not have survived to this age group. Specifically, overweight subjects who survived cardiovascular disease and other illnesses earlier in life may possess longevity genes, which may have protected them from mortality during the present follow-up period as well. A combination of genetic predisposition together with adequate energy stores in the form of fat may have served to protect these individuals from catabolic processes.
In agreement with the present study, other studies have reported an inverse association between BMI and mortality risk.35–37 Recently, Janssen et al.38 reported that the association between elevated BMI and reduced mortality risk was related to waist circumference (WC). This suggests that patients with elevated BMI and low WC have low mortality risk, whereas patients with high WC and elevated BMI have increased mortality risk, especially cardiovascular mortality. WC was not measured in the present study. A study in which WC is considered in addition to BMI as a mortality risk stratifier would be appropriate.
An important limitation of the present study is that BMI was measured in patients hospitalized for acute illness originally studied for orthostatic hypotension. This clearly limits the generalizability of the findings. The BMI of excluded subjects who were in generally poorer health than included subjects was not measured. If their BMI was significantly greater than included subjects, it is possible that the inverse association we observed between BMI and mortality is an overestimation of the true association. Conversely, if their BMI was significantly lower than that of included subjects, the association we observed between BMI and mortality would be an underestimation of the true association.
It is also important to note that whereas subjects who died during follow-up had lower BMI values than survivors, all subjects had BMI values within the normal range.39 This suggests that normal values developed for the general population may not be appropriate for classifying the elderly in terms of mortality risk.40
It cannot be overlooked, however, that the increased mortality associated with low BMI in the present study may be attributable to preexisting diseases in this patient cohort. Because BMI was measured in the subjects on a cross-sectional basis, it is not possible to know whether low BMI at a given point in time is a reflection of a stable, low body weight or whether it reflects a loss of weight during the period of time before measurement. If low BMI in fact is a function of weight loss, especially unintentional weight loss, then it is not surprising that it would be positively associated with mortality, as it could represent an underlying, undiagnosed pathology. However, the inverse relationship between BMI and mortality was preserved even after the exclusion of patients who died within 6 months after hospitalization in an attempt to control for the possibility of acute or subacute underlying illness. It is understood that complete adjustment for this process could only be obtained through repeated, prospective measures of BMI.
Furthermore, the cause of death was taken from death records and not from autopsy data, which increases the risk of misclassification.41 Autopsy is uncommonly performed in Israel because of cultural/religious practices.
In conclusion, in very elderly subjects hospitalized for acute illness, elevated BMI was associated with reduced mortality regardless of sex and cause of death. This study brings into question the appropriateness of presently used BMI cutoffs for hospitalized elderly patients.
Conflict of Interest Statement
None of the authors of this manuscript has any conflict of interest regarding funding source or other potential source of support.
Abbreviations
- BMI
body mass index
- BP
blood pressure
- mmHg
millimeter Hg (mercury)
- mg/dL
milligram/deciliter
- Kg
kilogram
- cm
centimeter
- m2
meter square
- SD
standard deviation
- IHD
ischemic heart disease
- CHF
congestive heart failure
- HR
hazard ratios
- CI
confidence intervals
- PH
proportional hazards
- EHF = Ĥ0(t)
empirical cumulative hazards function
- vs
versus
- WC
waist circumference
- SBP
systolic blood pressure
- DBP
diastolic blood pressure
- ACE
angiotensin converting enzyme
- M/F
males/females
- beats/min
beats per minute
References
- 1.Manson JE, Willett WC, Stampfer MJ, Colditz GA, Hunter DJ, Hankinson SE, et al. Body weight and mortality among women. N Engl J Med. 1995;333(11):677–85. [DOI] [PubMed]
- 2.Must A, Spadano J, Coakley EH, Field AE, Colditz G, Dietz WH. The disease burden associated with overweight and obesity. JAMA. 1999;282(16):1523–9. [DOI] [PubMed]
- 3.Sullivan DH, Johnson LE. Nutrition and aging. In: Hazzard WR, Blass JP, Halter JB, Ouslander JG, Tinetti ME, eds. Principles of Geriatric Medicine and Gerontology. 5 ed. New York: McGraw-Hill; 2003:265–83.
- 4.Calle EE, Rodriguez C, Walker-Thurmond K, Thun MJ. Overweight, obesity, and mortality from cancer in a prospectively studied cohort of U.S. adults. N Engl J Med. 2003;348(17):1625–38. [DOI] [PubMed]
- 5.Calle EE, Thun MJ, Petrelli JM, Rodriguez C, Heath CW Jr. Body-mass index and mortality in a prospective cohort of U.S. adults. N Engl J Med. 1999;341(15):1097–105. [DOI] [PubMed]
- 6.Kopelman PG. Obesity as a medical problem. Nature. 2000;404(6778):635–43. [DOI] [PubMed]
- 7.Willett WC, Manson JE, Stampfer MJ, Colditz GA, Rosner B, Speizer FE, et al. Weight, weight change, and coronary heart disease in women. Risk within the ‘normal’ weight range. JAMA. 1995;273(6):461–5. [DOI] [PubMed]
- 8.Curtis JP, Selter JG, Wang Y, Rathore SS, Jovin IS, Jadbabaie F, et al. The obesity paradox: body mass index and outcomes in patients with heart failure. Arch Intern Med. 2005;165(1):55–61. [DOI] [PubMed]
- 9.Escalante A, Haas RW, del Rincon I. Paradoxical effect of body mass index on survival in rheumatoid arthritis: role of comorbidity and systemic inflammation. Arch Intern Med. 2005;165(14):1624–9. [DOI] [PubMed]
- 10.Gustafsson F, Kragelund CB, Torp-Pedersen C, et al. Effect of obesity and being overweight on long-term mortality in congestive heart failure: influence of left ventricular systolic function. Eur Heart J. 2005;26(1):58–64. [DOI] [PubMed]
- 11.Kalantar-Zadeh K, Block G, Horwich T, Fonarow GC. Reverse epidemiology of conventional cardiovascular risk factors in patients with chronic heart failure. J Am Coll Cardiol. 2004;43(8):1439–44. [DOI] [PubMed]
- 12.Kalantar-Zadeh K, Block G, Humphreys MH, Kopple JD. Reverse epidemiology of cardiovascular risk factors in maintenance dialysis patients. Kidney Int. 2003;63(3):793–808. [DOI] [PubMed]
- 13.Romero-Corral A, Montori VM, Somers VK, et al. Association of bodyweight with total mortality and with cardiovascular events in coronary artery disease: a systematic review of cohort studies. Lancet. 2006;368(9536):666–78. [DOI] [PubMed]
- 14.Chang-Claude J, Hermann S, Eilber U, Steindorf K. Lifestyle determinants and mortality in German vegetarians and health-conscious persons: results of a 21-year follow-up. Cancer Epidemiol Biomarkers Prev. 2005;14(4):963–8. [DOI] [PubMed]
- 15.Hayashi R, Iwasaki M, Otani T, et al. Body mass index and mortality in a middle-aged Japanese cohort. J Epidemiol. 2005;15(3):70–7. [DOI] [PMC free article] [PubMed]
- 16.Hu G, Tuomilehto J, Silventoinen K, et al. The effects of physical activity and body mass index on cardiovascular, cancer and all-cause mortality among 47 212 middle-aged Finnish men and women. Int J Obes. 2005;29(8):894–902. [DOI] [PubMed]
- 17.Stevens J, Cai J, Pamuk ER, et al. The effect of age on the association between body-mass index and mortality. N Engl J Med. 1998;338(1):1–7. [DOI] [PubMed]
- 18.Landi F, Onder G, Gambassi G, et al. Body mass index and mortality among hospitalized patients. Arch Intern Med. 2000;160(17):2641–4. [DOI] [PubMed]
- 19.Weiss A, Grossman E, Beloosesky Y, Grinblat J. Orthostatic hypotension in acute geriatric ward: is it a consistent finding? Arch Intern Med. 2002;162(20):2369–74. [DOI] [PubMed]
- 20.Jagoe RT, Goodship TH, Gibson GJ. The influence of nutritional status on complications after operations for lung cancer. Ann Thorac Surg. 2001;71:766–8. [DOI] [PubMed]
- 21.Nicoletti I, Cicoira M, Morando G, et al. Impact of body mass index on short-term outcome after acute myocardial infarction: does excess body weight have a paradoxical protective role? Int J Cardiol. 2006;107(3):395–9. [DOI] [PubMed]
- 22.Allison DB, Zhu SK, Plankey M, et al. Differential associations of body mass index and adiposity with all-cause mortality among men in the first and second National Health and Nutrition Examination Surveys (NHANES I and NHANES II) follow-up studies. Int J Obes Relat Metab Disord. 2002;26(3):410–6. [DOI] [PubMed]
- 23.Heitmann BL, Erikson H, Ellsinger BM, et al. Mortality associated with body fat, fat-free mass and body mass index among 60-year-old swedish men—a 22-year follow-up. The study of men born in 1913. Int J Obes Relat Metab Disord. 2000;24(1):33–7. [DOI] [PubMed]
- 24.Fonarow GC, Srikanthan P, Costanzo MR, Cintron GB, Lopatin M, ADHERE Scientific Advisory Committee and Investigators. An obesity paradox in acute heart failure: analysis of body mass index and inhospital mortality for 108,927 patients in the Acute Decompensated Heart Failure National Registry. Am Heart J. 2007;153:74–81. [DOI] [PubMed]
- 25.Horwich TB, Fonarow GC. The impact of obesity on survival in patients with heart failure. Heart Fail Monit. 2002;3:8–14. [PubMed]
- 26.Flegal KM, Graubard BI, Williamson DF, Gail MH. Excess deaths associated with underweight, overweight, and obesity. JAMA. 2005;293(15):1861–7. [DOI] [PubMed]
- 27.Schooling CM, Lam TH, Li ZB, et al. Obesity, physical activity, and mortality in a prospective Chinese elderly cohort. Arch Intern Med. 2006;166(14):1498–504. [DOI] [PubMed]
- 28.Willett WC, Dietz WH, Colditz GA. Guidelines for healthy weight. N Engl J Med. 1999;341(6):427–34. [DOI] [PubMed]
- 29.Wilson PW, D’Agostino RB, Sullivan L, et al. Overweight and obesity as determinants of cardiovascular risk: the Framingham experience. Arch Intern Med. 2002;162(16):1867–72. [DOI] [PubMed]
- 30.Adams KF, Schatzkin A, Harris TB, et al. Overweight, obesity, and mortality in a large prospective cohort of persons 50 to 71 years old. N Engl J Med. 2006;355(8):763–78. [DOI] [PubMed]
- 31.Jee SH, Sull JW, Park J, et al. Body-mass index and mortality in Korean men and women. N Engl J Med. 2006;355(8):779–87. [DOI] [PubMed]
- 32.Lindsted KD, Singh PN. Body mass and 26 y risk of mortality among men who never smoked: a re-analysis among men from the Adventist Mortality Study. Int J Obes Relat Metab Disord. 1998;22(6):544–8. [DOI] [PubMed]
- 33.Stevens J, Plankey MW, Williamson DF, et al. The body mass index–mortality relationship in white and African American women. Obes Res. 1998;6(4):268–77. [DOI] [PubMed]
- 34.Zamboni M, Mazzali G, Zoico E, et al. Health consequences of obesity in the elderly: a review of four unresolved questions. Int J Obes. 2005;29(9):1011–29. [DOI] [PubMed]
- 35.Heiat A, Vaccarino V, Krumholz HM. An evidence-based assessment of federal guidelines for overweight and obesity as they apply to elderly persons. Arch Intern Med. 2001;161(9):1194–203. [DOI] [PubMed]
- 36.Hu FB, Willett WC, Li T, et al. Adiposity as compared with physical activity in predicting mortality among women. N Engl J Med. 2004;351(26):2694–703. [DOI] [PubMed]
- 37.Inoue K, Shono T, Toyokawa S, Kawakami M. Body mass index as a predictor of mortality in community-dwelling seniors. Aging Clin Exp Res. 2006;18(3):205–10. [DOI] [PubMed]
- 38.Janssen I, Katzmarzyk PT, Ross R. Body mass index is inversely related to mortality in older people after adjustment for waist circumference. J Am Geriatr Soc. 2005;53(12):2112–38. [DOI] [PubMed]
- 39.Shah B, Sucher K, Hollenbeck CB. Comparison of ideal body weight equations and published height–weight tables with body mass index tables for healthy adults in the United States. Nutr Clin Pract. 2006;21:312–9. [DOI] [PubMed]
- 40.Price GM, Uauy R, Breeze E, Bulpitt CJ, Fletcher AE. Weight, shape, and mortality risk in older persons: elevated waist–hip ratio, not high body mass index, is associated with a greater risk of death. Am J Clin Nutr. 2006;84(2):449–60. [DOI] [PubMed]
- 41.Wolfe M, Nolte KB, Yoon SS. Fatal infectious disease surveillance and the medical examiner database. Emerg Infect Dis. 2004;10:48–53. [DOI] [PMC free article] [PubMed]