

Abstract
Motility of nerve growth cones (GCs) is regulated by region-specific activities of cell adhesion molecules (CAMs). CAM activities could be modified by their localization to detergent-resistant membranes (DRMs), specialized microdomains enriched in signaling molecules. This paper deals with a question of whether DRMs are involved in GC migration stimulated by three CAMs; L1, N-cadherin (Ncad), and β1 integrin. We demonstrate that L1 and Ncad are present in DRMs, whereas β1 integrin is exclusively detected in non-DRMs of neurons and that localization of L1 and Ncad to DRMs is developmentally regulated. GC migration mediated by L1 and Ncad but not by β1 integrin is inhibited after DRM disruption by micro-scale chromophore-assisted laser inactivation (micro-CALI) of GM1 gangliosides or by pharmacological treatments that deplete cellular cholesterol or sphingolipids, essential components for DRMs. Characteristic morphology of GCs induced by L1 and Ncad is also affected by micro-CALI–mediated DRM disruption. Micro-CALI within the peripheral domain of GCs, or even within smaller areas such as the filopodia and the lamellipodia, is sufficient to impair their migration. However, micro-CALI within the central domain does not affect GC migration. These results demonstrate the region-specific involvement of DRMs in CAM-dependent GC behavior.
Keywords: lipid raft; micro-CALI; neuron; L1; N-cadherin
Introduction
The motility of nerve growth cones (GCs)* plays a pivotal role in neurite elongation during nervous system development. GCs express various cell adhesion molecules (CAMs) that recognize localized guidance cues and translate them into directed neurite elongation (Gordon-Weeks, 2000). So far, three major classes of CAMs have been identified in the nervous system: (1) integrins; (2) cadherins; and (3) the Ig superfamily of CAMs (IgCAMs). Cadherins and the majority of IgCAM members, including L1, mediate cell–cell adhesion via a homophilic binding mechanism (Grumet and Edelman, 1988; Takeichi, 1991). In vitro experiments have demonstrated that L1 and N-cadherin (Ncad) presented as a culture substrate stimulate neurite growth by binding homophilically to L1 and Ncad expressed on the GC, respectively (Lemmon et al., 1989; Bixby and Zhang, 1990). Although heterophilic trans-interactions of L1 with integrins have also been reported (Yip et al., 1998), L1 knockout neurons completely lose their ability to extend neurites on an L1 substrate (Dahme et al., 1997; Fransen et al., 1998), indicating that L1-stimulated neurite growth from mouse neurons depends, for the most part, on homophilic L1–L1 interactions. In contrast, β1 integrin forms a heterodimeric receptor on the GC, which promotes neurite growth on binding to laminin, an ECM molecule (Bozyczko and Horwitz, 1986; Tomaselli et al., 1986).
L1, Ncad, and β1 integrin are single-pass transmembrane proteins integrated in the cell membrane, where proteins and lipids are not uniformly distributed but form spatially differentiated microdomains. This lateral heterogeneity of the cell membrane presumably results from preferential packing of cholesterol and sphingolipids into platforms called “rafts,” onto which specific proteins attach on both sides of the lipid bilayer (Simons and Toomre, 2000). The size of lipid rafts varies from undetectable to 700 nm in diameter (Anderson and Jacobson, 2002). Rafts are insoluble in cold nonionic detergents and can be isolated from nonraft domains of the cell membrane (Brown and Rose, 1992). The isolated membrane fractions corresponding to rafts were termed detergent-resistant membranes (DRMs). DRMs are enriched in glycosylphosphatidylinositol (GPI)-anchored proteins and intracellular signaling molecules such as the Src family kinases (Lisanti et al., 1994). DRMs exist in various cells and subcellular compartments, including neuronal GCs (He and Meiri, 2002). The most intriguing property of rafts/DRMs is that they serve as platforms to concentrate signaling components and other molecules with the same subcellular destination, thus being involved in signal transduction and selected transport of membrane components (Simons and Toomre, 2000; Ikonen, 2001). Consequently, DRMs have been implicated in various cellular functions, including neuronal differentiation and survival (Tansey et al., 2000), neuritogenesis (Niethammer et al., 2002), and synaptic transmission (Bruses et al., 2001).
Previous reports demonstrated that the L1 family members are present in DRMs (Olive et al., 1995; Ren and Bennett, 1998) but that β1 integrin is exclusively localized to non-DRMs (Fra et al., 1994). It has not been studied whether Ncad is associated with DRMs. The major topic of this paper is to elucidate whether DRMs are involved in neurite growth mediated by these CAMs. We also present a new technique for acute and localized disruption of DRM integrity in living cells by micro-scale chromophore-assisted laser inactivation (micro-CALI) that was originally developed by Jay's group (Diamond et al., 1993; Buchstaller and Jay, 2000). This technique enables us to perturb DRMs within neuronal GCs or even smaller areas, thereby to elucidate the spatial distribution of DRM requirement for GC migration stimulated by CAMs.
Results
L1 and Ncad, but not β1 integrin, are expressed in DRMs
Insolubility in cold nonionic detergents and flotation on density gradients is the standard criteria for identification of DRM-associated molecules. Using this method, we tested whether three transmembrane CAMs (L1, Ncad, and β1 integrin) are localized to DRMs in cerebellar granule cells. Cultured cells from the postnatal day 8 (P8) mouse cerebellum were processed by Triton X-100 (Tx100) extraction and sucrose density gradient centrifugation. Segregation of DRMs from non-DRM regions was confirmed by separated distribution of DRM-specific and non-DRM–specific markers in the gradient (Fig. 1 A). GM1 gangliosides, a DRM-specific marker recognized by cholera toxin B subunits (CTxB) (Fra et al., 1994), floated to low density fractions, whereas transferrin receptors (TfRs), a non-DRM marker (Smart et al., 1995), stayed in high density fractions. The similar distribution pattern was reproducibly obtained. Based on these results, the fractions 2–4 (insoluble, DRM) or the fractions 7–10 (soluble, non-DRM) were combined, concentrated, and processed for Western blot analysis. L1 (200 kD, full-length) and Ncad (130 kD) were detected in both the DRM and non-DRM fractions, whereas β1 integrin (140 kD) was detected only in the non-DRM fraction (Fig. 1, B–D). The similar result was reproducibly obtained in more than 10 independent experiments. Culturing neurons on different substrates (poly-d-lysine, L1, Ncad, or laminin) did not affect the localization pattern of L1, Ncad, and β1 integrin in the gradient. To confirm that the detergent insolubility of L1 and Ncad is dependent on their localization to DRMs, neurons were pretreated with pharmacological agents that disrupt DRM integrity by removing cholesterol (Simons and Toomre, 2000). The amount of L1 and Ncad in the insoluble (DRM) fraction decreased after a treatment of the cells with lovastatin (a cholesterol synthesis inhibitor) in a dose-dependent manner (Fig. 1, B, C, and E). Both CAMs became undetectable in the DRM fraction after extracting cellular cholesterol with methyl-β-cyclodextrin (unpublished data). These results indicate that L1 and Ncad, but not β1 integrin, are expressed in DRMs in cerebellar granule cells.
Figure 1.

CAM localization to DRMs in cerebellar granule cells. Cultured cells from P8 mice were processed by detergent extraction and sucrose density gradient centrifugation. The gradient was divided into 10 fractions from the top (fraction 1) to the bottom (fraction 10), and each fraction was tested for expression of GM1 and TfR by Western blotting (A). The GM1-positive insoluble fractions (DRM) or the TfR-positive soluble fractions (non-DRM) were combined and processed for Western blot analysis of L1 (B), Ncad (C), and β1 integrin (D). In some experiments (bottom panels in B and C), the cells were treated with 4 μM lovastatin before detergent extraction. (E) The lovastatin dose–response curves for disruption of DRMs as assessed by detergent insolubility of L1 and Ncad (B and C). The value in ordinate was defined as D/(D+N) × 100 (%), where D and N were the intensity of blots in the DRM and non-DRM fractions, respectively. Each bar represents four independent experiments. *, P < 0.05; ***, P < 0.001; one-way ANOVA followed by Dunnett's post-test compared with neurons with no lovastatin treatment.
Next, we examined the localization pattern of CAMs to DRM versus non-DRM regions in the cerebellum in vivo. The cerebellar tissues from P3, P8, P15, P28, and P56 mice were included in this study. At all the developmental stages examined, the total amount of L1, Ncad, TfR, or GM1 expressed per unit weight of the cerebellum was not changed as assessed by Western blotting (unpublished data). However, β1 integrin expression in the cerebellum decreased with its development and became barely detectable at ∼P28 (unpublished data). The cerebellum was processed by Tx100 extraction and sucrose density gradient centrifugation, and CAM expression in each fraction of the gradient was tested by Western blotting. Consistent with the result on cultured neurons, L1 and Ncad were detected in the DRM fractions colocalizing with GM1 (Fig. 2, B–E), and β1 integrin was exclusively detected in the non-DRM fractions colocalizing with TfR (Fig. 2, A–C). Interestingly, L1 and Ncad started to appear in the DRM fractions at ∼P8 (Fig. 2 B), and their expression levels relative to those in the non-DRM fractions continued to increase until ∼P28 (Fig. 2 D). Thereafter, L1 expression in the DRM fractions became undetectable, whereas Ncad continued to be expressed in the DRM fractions at least until P56 (Fig. 2 E). The similar translocation of L1 and Ncad into DRMs was observed between P3 and P8 in cultured cerebellar granule cells (unpublished data), corresponding to the period when these cells migrate and elongate neurites in vivo. Although the precise mechanism regulating the subcellular translocation of these CAMs remains unclear, it has been suggested that targeting of L1 family members to DRMs is in part dependent on palmitoylation at their membrane-spanning domain (Ren and Bennett, 1998).
Figure 2.

Developmental changes of L1 and Ncad localization to DRMs in the cerebellum. The cerebellums from P3 (A), P8 (B), P15 (C), P28 (D), and P56 (E) mice were processed by detergent extraction, sucrose density gradient centrifugation, and fractionation. Each fraction was tested for expression of GM1, TfR, L1, Ncad, and β1 integrin by Western blotting. The similar localization pattern was reproducibly obtained in three independent experiments.
DRM components cholesterol and sphingolipids are involved in neurite growth mediated by L1 and Ncad, but not by β1 integrin
Next, we tested whether DRMs are involved in development of cerebellar granule cells using in vitro systems. Dissociated cells from the P8 mouse cerebellum were treated with lovastatin, and their ability to send out neurites was evaluated. Neurite growth on both L1 and Ncad substrates was impaired by lovastatin in a dose-dependent manner (Fig. 3, A–E) that was comparable with the lovastatin dose–response curves for disruption of DRMs as assessed by detergent insolubility of relevant receptors (Fig. 1 E). In contrast, neurite growth on a laminin substrate was not affected even by the maximal concentration of lovastatin used in this study (Fig. 3 E). The specificity of this pharmacological perturbation was confirmed by replenishing the cells with cholesterol. An addition of a soluble form of cholesterol into culture media completely negated the inhibitory effect of lovastatin on L1 and Ncad-dependent neurite growth (Fig. 3 F).
Figure 3.

Neurite growth on L1 and Ncad is affected by depletion of cellular cholesterol or sphingolipids. (A–D) Differential interference contrast images of cerebellar granule cells cultured for 36 h on L1 (A and B) or Ncad (C and D) in the absence (A and C) or presence (B and D; 4 μM) of lovastatin. Bar, 50 μm. (E–H) Cerebellar granule cells (E and F) or DRG neurons (G and H) in culture were treated with indicated concentrations of drugs, and the length of their neurites was measured (n = 100 for each bar). *, P < 0.05; ***, P < 0.001; one-way ANOVA followed by Dunnett's post-test compared with neurons with no drug treatment (control). (I) DRG neurons were cultured in the presence of indicated concentrations of fumonisin B1 or NB-DNJ for 8 h. Expression of GM1 and actin in the cells was detected by Western blotting.
Dorsal root ganglion (DRG) neurons cultured from embryonic day 17 (E17) mice were also analyzed. Neurite growth on both L1 and Ncad was impaired by lovastatin in a dose-dependent manner (Fig. 3 G). This inhibitory effect was subtle, but statistically significant. In contrast, neurite growth on laminin was not affected by lovastatin. Cholesterol replenishment completely negated the inhibitory effect of lovastatin (unpublished data). Next, we attempted to test whether sphingolipids, another essential component of DRMs, are involved in neurite growth. A treatment of DRG neurons with fumonisin B1, a fungal metabolite that inhibits biosynthesis of sphingolipids (both sphingomyelins and glycosphingolipids; Harel and Futerman, 1993), attenuated neurite growth on L1 and Ncad, but not on laminin (Fig. 3 H). In contrast, a blockade of glycosphingolipid synthesis by N-butyldeoxynojirimycin (NB-DNJ), a ceramide glucosyltransferase inhibitor that does not decrease sphingomyelin synthesis (Platt et al., 1994), had no effects on neurite growth mediated by L1 and Ncad (Fig. 3 H). Parallel experiments confirmed that the treatment with fumonisin B1 or NB-DNJ dramatically reduced the amount of glycosphingolipid GM1 expressed in DRG neurons (Fig. 3 I). Taken collectively, our results indicate that sphingolipids are involved in neurite growth mediated by L1 and Ncad whereas glycosphingolipid deficiency is not sufficient to inhibit neurite growth mediated by these CAMs. This is consistent with the previous finding that glycosphingolipid deficiency caused by loss of the ceramide glucosyltransferase activity did not disrupt DRM integrity because sphingomyelins compensated for the lack of glycosphingolipids (Ostermeyer et al., 1999).
L1 and Ncad are associated with cross-linked DRM patches in GCs
A previous study (Janes et al., 1999) demonstrated that membrane domains labeled with CTxB and then aggregated into patches with anti-CTxB antibody display characteristics of biochemically isolated DRMs, including detergent resistance and specific colocalization with DRM-associated proteins. Therefore, they concluded that the membrane patches formed by cross-linking CTxB correspond to regions of aggregated rafts/DRMs in live cells. Using this experimental strategy, we tested whether CAMs colocalize with cross-linked DRM patches in DRG GCs. Staining of live GCs with fluorescently labeled CTxB demonstrated a homogeneous distribution of GM1 at the plasma membrane (Fig. 5 J). However, when the cell-surface CTxB was cross-linked with antibodies, the staining became concentrated to distinct patches on the GC membrane (Fig. 4). CAM expression was then detected by immunofluorescence, and CAM colocalization with CTxB patches was quantified (Materials and methods). As shown in Fig. 4 Z, L1 and Ncad colocalized with CTxB patches more significantly than β1 integrin did in GCs. Importantly, L1 and Ncad became less involved in CTxB patches when GCs were depleted of cholesterol by a pretreatment with lovastatin. Although we could not exclude the possibility that the CTxB treatment influenced the CAM localization, these results are consistent with our biochemical data and suggest that L1 and Ncad but not β1 integrin are associated with DRMs in GCs.
Figure 5.

Micro-CALI of GM1 disrupts DRM integrity as assessed by Thy-1 insolubility in cold detergent. NIH-3T3 cells (A–D) or DRG GCs (E–I) incubated in the presence of FITC-CTxB (A–C and E–G), FITC-BSA (D and H), or the FITC-RGD peptide (I) were irradiated with a laser at the areas outlined in white. After detergent extraction, Thy-1 was labeled by immunocytochemistry (B, D, F, H, and I). Differential interference contrast images of Thy-1–labeled cells (B and F) are also shown (A and E, respectively). As a control, cells that had been subjected to micro-CALI but not to detergent extraction were processed for Thy-1 immunocytochemistry (C and G). Fluorescent images of FITC-CTxB (J) or the FITC-RGD peptide (K) bound to the DRG GC surface are also shown. Bars: (A–D) 20 μm; (E–I) 10 μm; (J and K) 10 μm.
Figure 4.
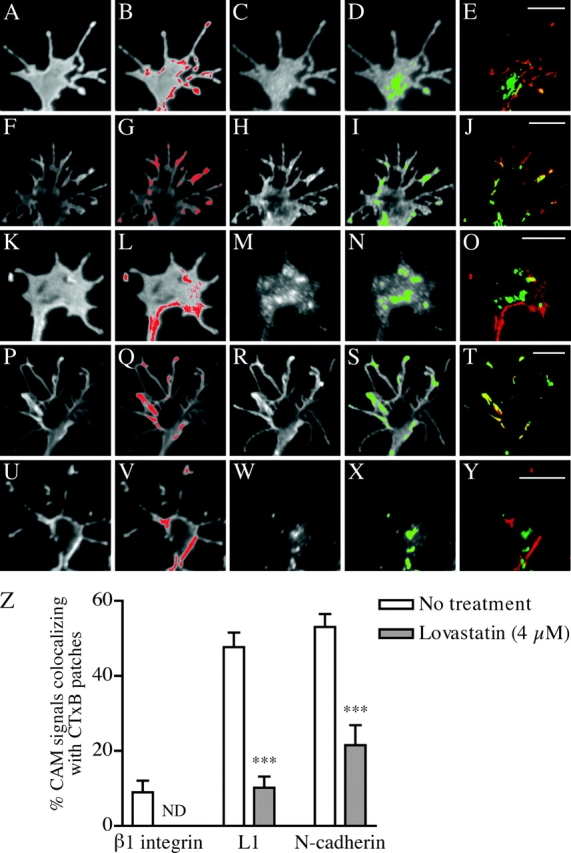
Codistribution of L1 and Ncad with cross-linked DRM patches in GCs. (A–Y) DRG GCs that had been treated to form visible CTxB patches were double labeled for β1 integrin (A–E), L1 (F–O), or Ncad (P–Y). GCs cultured in the presence of 4 μM lovastatin were used in some experiments (K–O and U–Y). Images showing CTxB patches (A, F, K, P, and U) were processed for intensity thresholding, and a red mask was generated on pixels whose intensity values fall within the upper 10% of the total integrated intensity in each GC (B, G, L, Q, and V). Similarly, green masks were generated (D, I, N, S, and X) on unprocessed images showing CAM distribution in the GCs (C, H, M, R, and W). Red and green masks were superimposed to reveal regions of colocalization appearing yellow (E, J, O, T, and Y). Bars, 5 μm. (Z) Quantitative analysis of CAM localization with CTxB patches using superimposed images (for example, E, J, O, T, and Y). The ordinate indicates the ratio of colocalized (yellow) mask area to the green mask area in GC. Each set of experiments involved 9–17 GCs. ***, P < 0.001; one-way ANOVA followed by Tukey's post-test compared with untreated GCs.
DRM integrity is disrupted by micro-CALI of GM1 gangliosides
Although lovastatin and fumonisin B1 inhibited neurite growth stimulated by L1 and Ncad (Fig. 3), this type of experiment using lipid synthesis inhibitors has several drawbacks. First, depending on the half-life of cellular lipids, pharmacological treatments should take at least an order of hours to reduce the amount of lipids to a level sufficient for neurite growth inhibition. This may, in part, explain why the treatments caused only a subtle reduction in neurite length under our experimental conditions. Second, cholesterol and sphingolipids are involved not only in the formation of DRMs in GCs, but also in the genesis of cell membranes and DRM-dependent protein sorting at cell bodies, thereby providing new membranes and proteins to growing neurites (Harel and Futerman, 1993; de Chaves et al., 1997; Ledesma et al., 1998). This makes it difficult to interpret the data obtained by pharmacological perturbation. To overcome these problems, we developed a new technique for acute and localized perturbation of DRMs in GCs.
Micro-CALI provides an elegant way to perturb molecular functions at particular locations and times. In this technique, target molecules are labeled with dye-conjugated antibodies or ligands in living cells. Upon laser irradiation, the dye generates short-lived free radicals that perturb the target and other molecules located within the close vicinity of the dye. The spatial range of this inactivating effect of two different dyes has been reported as 6 nm for malachite green (Linden et al., 1992) and <30 nm, although a lower range is expected by more strict estimation, for fluorescein (Surrey et al., 1998). This spatial specificity of micro-CALI should be sufficient for selective perturbation of DRMs if DRM-specific molecules are targeted. Therefore, we decided to target GM1 gangliosides by micro-CALI using FITC-conjugated CTxB. The advantage of using fluorescein rather than malachite green as a chromophore will be discussed.
To confirm whether micro-CALI of GM1 perturbs DRMs, NIH-3T3 cells incubated in the presence of FITC-CTxB were irradiated with a 480-nm laser for 30 s, and detergent extractability of Thy-1 was examined. Thy-1 is a GPI-anchored protein associated with DRMs/rafts (Ledesma et al., 1998; Dietrich et al., 2002). Laser irradiation caused Thy-1 to become soluble in cold Tx100, whereas nonirradiated cells retained Thy-1 after detergent extraction (Fig. 5, A and B). As shown in the cells neighboring on the target cell, micro-CALI of GM1 in only a part of a cell did not have the effect, most likely because DRM components could be supplied rapidly from the nonirradiated area by diffusion or active transport. Thy-1 immunoreactivity was not affected by micro-CALI of GM1 unless extracted with a detergent (Fig. 5 C), excluding the possibility that micro-CALI destroyed Thy-1 antigenicity. As another control, we showed that Thy-1 remained insoluble in cold Tx100 after laser irradiation in the presence of FITC-conjugated BSA instead of FITC-CTxB (Fig. 5 D). The similar results were obtained with DRG GCs (Fig. 5, E–H). Because FITC-BSA did not bind to the GC membrane, the RGD peptide conjugated to FITC (see Materials and methods for amino acid sequence) was used as another control chromophore. This peptide is derived from the active site of laminin and interacts with β1 and β3 integrins (Sasaki and Timpl, 2001) that are localized to non-DRM regions (Maile et al., 2002). The FITC-RGD peptide actually bound to the DRG GC surface (Fig. 5 K). Laser irradiation in the presence of the FITC-RGD peptide did not cause Thy-1 to become soluble in cold Tx100 (Fig. 5 I). Taken collectively, these results indicate that FITC-CTxB-mediated micro-CALI disrupts DRM integrity.
Micro-CALI–mediated disruption of DRMs affects GC behavior induced by L1 and Ncad, but not by β1 integrin
Whether DRMs in GCs are involved in neurite growth was tested by micro-CALI of GM1. For this experiment, we used DRG GCs because their migration is faster and therefore easier to quantify than that of cerebellar granule cell GCs. In addition, the large size of a DRG GC enabled application of micro-CALI to individual domains of the GC. Another important condition is that FITC-CTxB should not affect GC migration unless irradiated with a laser. Therefore, we examined whether neurite growth was influenced by the presence of the same concentration of FITC-CTxB as would be used in the micro-CALI experiment. The length of neurites from DRG neurons cultured on L1 for 8 h was as follows: 130.3 ± 5.5 μm (n = 100) in the absence of FITC-CTxB and 131.6 ± 4.4 μm (n = 100) in the presence of FITC-CTxB. Similarly, neurite length on Ncad was not affected significantly (132.7 ± 7.1 μm [n = 105] or 143.7 ± 7.8 μm [n = 100] in the absence or presence of FITC-CTxB, respectively). Furthermore, neurite growth on both substrates was affected by neither FITC-BSA nor the FITC-RGD peptide (unpublished data). Based on these data, we decided to apply micro-CALI of GM1 to studies on GC migration.
The entire area of a DRG GC was irradiated with a 480-nm laser for 30 s in the presence of FITC-CTxB bound to GM1. This treatment did not affect the cell-surface expression of L1, Ncad, and β1 integrin as assessed by immunocytochemistry (unpublished data). Analyses of GC migration before and after the laser irradiation revealed that micro-CALI of GM1 dramatically reduced its migration rate on L1 and Ncad, but not on laminin (Fig. 6, A, C, and E, and Fig. 7 A). As controls, laser irradiation in the presence of FITC-BSA or the FITC-RGD peptide did not inhibit GC migration on L1 and Ncad (Fig. 6, B and D, and Fig. 7, A and B). Because GM1 was not essential for neurite growth (Fig. 3, H and I), perturbation of its molecular function was not a direct cause of the GC stall induced by FITC-CTxB–mediated micro-CALI. Therefore, consistent with our observation on neurite growth after pharmacological perturbation, these micro-CALI experiments demonstrate that DRMs in GCs are involved in their migration mediated by L1 and Ncad, but not by β1 integrin. Next, we examined whether GCs could recover after DRM disruption by micro-CALI. This is likely to occur by diffusion or active transport of DRM components from the nonirradiated neurite shaft. As shown in Fig. 7 D, the GCs recovered and started to migrate at an original velocity on both L1 and Ncad within 60 min after laser irradiation.
Figure 6.

Micro-CALI–mediated DRM disruption affects GC behavior on L1 and Ncad. Time-lapse image sequences of DRG GCs migrating on L1 (A and B), Ncad (C and D), or laminin (E). The areas outlined in black were irradiated with a laser for 30 s (from −0.5 to 0 min) in the presence of either FITC-CTxB (A, C, and E) or FITC-BSA (B and D). Bar, 5 μm.
Figure 7.
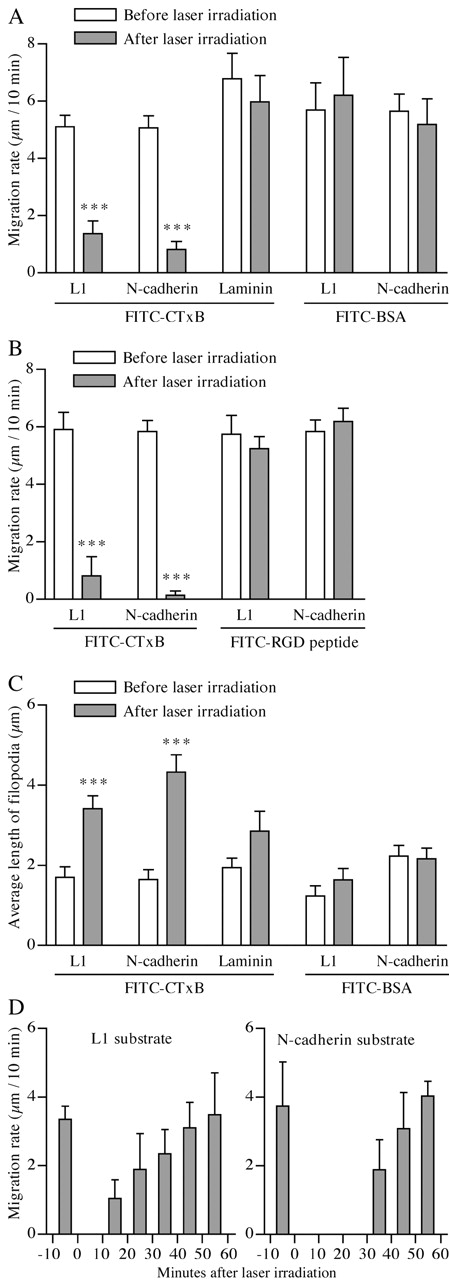
Quantitative analyses of changes in GC behavior induced by micro-CALI of GM1. (A–C) DRG GCs migrating on L1, Ncad, or laminin was irradiated with a laser in the presence of FITC-CTxB, FITC-BSA, or the FITC-RGD peptide, as shown in Fig. 6. Each set of experiments involved 7–31 GCs. Their migration rates (μm/10 min) were measured immediately before and after the laser irradiation (A and B). The average length of filopodia of each GC was quantified immediately before and 10 min after the laser irradiation (C). For this set of experiments (C), lamellipodia-dominated GCs were intentionally selected on a laminin substrate. ***, P < 0.001; paired t test compared with GCs before laser irradiation. (D) Migration rates of DRG GCs on L1 (n = 8) and Ncad (n = 5) were measured every 10 min. The entire area of the GC was subjected to micro-CALI of GM1 at 0 min.
In addition to stimulating neurite growth, CAMs induce distinctive morphological characteristics in GCs; the lamellipodia predominate on L1 and Ncad substrates, and the filopodia predominate on laminin (Payne et al., 1992). As shown in the representative images (Fig. 6, A and C), DRM disruption by micro-CALI resulted in lamellipodial retraction and filopodial extension on L1 and Ncad. In contrast, GCs on laminin did not respond to the same treatment, even if a lamellipodia-dominated GC was intentionally targeted (Fig. 6 E). The morphological change was quantified by measuring the average length of filopodia (from the lamellipodial edge to the filopodial tip) of a GC immediately before and 10 min after laser irradiation. This parameter increases as either the lamellipodia retract or the filopodia extend. On L1 and Ncad, micro-CALI of GM1 increased the length of filopodia, whereas the control treatment with FITC-BSA did not (Fig. 7 C). In contrast, changes of the filopodial length induced by micro-CALI were not statistically significant on laminin, although the filopodia tended to extend in response to the treatment (Fig. 7 C). Taken collectively, these results indicate that DRMs are involved not only in neurite growth, but also in the formation of lamellipodia-dominated GCs by L1 and Ncad.
Spatial distribution of DRM requirement for GC migration mediated by L1 and Ncad
The GC can be divided into two functionally distinct domains: (1) the central domain (C-domain) and (2) the peripheral domain (P-domain; Gordon-Weeks, 2000). Although immunocytochemical analyses showed that DRM components GM1 and flotillin (Bickel et al., 1997) distribute throughout a GC (unpublished data for flotillin), the involvement of DRMs in CAM-based GC motility may be spatially heterogeneous. To test this hypothesis, motile behavior of GCs was analyzed after micro-CALI of GM1 was applied in a domain-specific manner. The treatment within the P-domain caused lamellipodial retraction and filopodial extension and inhibited migration of the GCs on L1 and Ncad (Fig. 8, B and C). In contrast, the treatment within the C-domain did not affect GC migration on either substrate, but caused the transient formation of a bulbous structure bearing filopodium-like protrusions at the neurite shaft (Fig. 8, A and C). Because the shape of the laser-irradiated area was uncontrollable, the entire C-domain could not be irradiated without involving any part of the P-domain. For this reason, the periphery of the C-domain was left unirradiated in this set of micro-CALI experiments. It is known that as a GC migrates, the C-domain consolidates and becomes the neurite shaft behind it (Goldberg and Burmeister, 1986). Our result suggests that DRM disruption in the central-rear part of the C-domain delays its consolidation process without slowing migration rates of the GC. Quantitative analysis revealed that L1 and Ncad-dependent migration of GCs was impaired by DRM disruption in the P-domain, but not in the central-rear part of the C-domain (Fig. 8 D). As controls, GC behavior was not altered by laser irradiation to either domain in the presence of FITC-BSA instead of FITC-CTxB.
Figure 8.

GC migration on L1 and Ncad is impaired by micro-CALI–mediated DRM disruption in the P-domain but not in the C-domain. (A–C) Time-lapse image sequences of DRG GCs migrating on Ncad (A and B) or L1 (C). Either the P-domain or the C-domain was subjected to micro-CALI of GM1 at the areas outlined in black at 0 min (A–C) and 20 min (C). Bars: (A and B) 5 μm; (C) 10 μm. (D) Migration rates of DRG GCs immediately before and after laser irradiation within the P-domain or the C-domain in the presence of either FITC-CTxB or FITC-BSA. Each set of experiments involved 13–25 GCs. ***, P < 0.001; paired t test compared with migration rates before laser irradiation.
To further investigate the spatial distribution of DRM requirement in the P-domain, we applied micro-CALI to the filopodia versus the lamellipodia. Micro-CALI of GM1 in a single filopodium rarely affected GC behavior (unpublished data), so we attempted to include all the filopodia of a GC by multiple (three or four) times of nonoverlapped laser irradiation (Fig. 9 B). For micro-CALI in the lamellipodia, the C-domain could not be completely excluded from laser irradiation in most cases, because the laser spot could not be made small enough to restrict it within the lamellipodia (Fig. 9 A). Micro-CALI in either the lamellipodia or the filopodia caused lamellipodial retraction and filopodial extension and inhibited migration of the GC on L1 and Ncad (Fig. 9).
Figure 9.

Micro-CALI–mediated DRM disruption in either the lamellipodia or the filopodia is sufficient to impair GC migration on L1 and Ncad. (A and B) Time-lapse image sequences of DRG GCs migrating on L1. Either the lamellipodia (A) or the filopodia (B) was subjected to micro-CALI of GM1 at the areas outlined in black. All the filopodia were targeted by four times of laser irradiation (B). Bars, 5 μm. (C) Migration rates of DRG GCs immediately before and after micro-CALI of GM1 in the lamellipodia or the filopodia. Each set of experiments involved 10–12 GCs. ***, P < 0.001; paired t test compared with migration rates before laser irradiation.
Discussion
This work is, to our knowledge, the first observation on functional significance of DRMs in neuronal GCs. Development of a micro-CALI–based technique allowed us to perturb DRM integrity in focal subcellular areas, which could not be performed by pharmacological treatments or gene targeting strategies. In our micro-CALI experiments, we used fluorescein rather than malachite green as a chromophore for the following reasons: (1) malachite green is hydrophobic and tends to aggregate in solution; and (2) the total laser energy required for micro-CALI with fluorescein is ∼50-fold less than that with malachite green (Surrey et al., 1998), thereby enabling more acute inactivation of target molecules. Actually, we could have the effect after laser irradiation of 30 s, as compared with 5 min for malachite green–mediated micro-CALI (Diamond et al., 1993). This should be a critical factor, especially when rapidly moving molecules are targeted. Besides the selection of the dye, a frequency of a pulsed laser turned out to be another important factor. Although the frequency of 20 Hz was used in previous work (Diamond et al., 1993), the higher frequency of 30 Hz was required for a steady effect of micro-CALI under our experimental conditions.
It remains to be determined what molecular mechanisms underlie micro-CALI–induced alterations in GC behavior on L1 and Ncad. GM1 primarily resides on the exoplasmic leaflet of the plasma membrane. As a part of continuous endocytic membrane flow, GM1 is internalized into early endosomes and subjected to a sorting process that directs some of the molecules back to the plasma membrane and others to the Golgi apparatus in the cell body (Kolter and Sandhoff, 1998). Laser irradiation in the presence of FITC-CTxB bound to GM1 generates free radicals on the exoplasmic leaflet of both the plasma membrane and the endosomal membrane in GCs. Micro-CALI of GM1 should not directly inactivate DRM-associated cytoplasmic molecules, such as the Src family kinases, because the thickness of the cell membrane is beyond the spatial range of the effect by micro-CALI. Therefore, loss of migrating ability of GCs is caused either by direct perturbation of exoplasmic molecules within DRMs or by disruption of DRM integrity as demonstrated in this paper. However, the former possibility is less likely for the following reasons: (1) pharmacological agents that disrupt DRM integrity by removing cholesterol inhibited neurite growth; and (2) the antigenicity of Thy-1, a GPI-anchored molecule concentrated in DRMs, was not affected by micro-CALI of GM1. In any case, micro-CALI of GM1 should affect L1 and Ncad-mediated signal transduction across DRMs by disrupting either DRM integrity or DRM-associated molecules, such as GPI-anchored and transmembrane proteins, that are critical for these CAMs to generate signals. This inhibition could happen at both the cell surface and signaling endosomes.
Several DRM-associated molecules have been shown to be involved in L1-mediated neurite growth. Axonin-1, a GPI-anchored IgCAM localized to DRMs, interacts in cis with NgCAM, a chick homologue of L1, in the plane of the neuronal plasma membrane (Buchstaller et al., 1996). This lateral interaction of NgCAM with axonin-1 is required for NgCAM-dependent neurite growth. Similarly, a cis-interaction of L1 with TAG-1, a mammalian homologue of axonin-1, is likely to induce L1 binding to the membrane cytoskeleton (Malhotra et al., 1998). Both L1/NgCAM and TAG-1/axonin-1 are functionally associated with the Src family kinases, such as Src, Fyn, and Lyn, which attach to the cytoplasmic leaflet of DRMs. For example, Src phosphorylates the L1 cytoplasmic domain (Schaefer et al., 2002) and is required for neurite growth mediated by L1, but not by β1 integrin (Ignelzi et al., 1994). Src is also located at some intermediate point in the signaling pathway that phosphorylates MAPK in a Ras-independent manner in response to L1 cross-linking on the cell surface (Schmid et al., 2000). The L1-induced MAPK activation is required for L1-based neurite growth (Schmid et al., 2000). Another example is that clustering of axonin-1 with NgCAM induced by cell–cell contacts correlates with a reduction of the Fyn activity associated with axonin-1 (Kunz et al., 1996). Furthermore, cross-linking of TAG-1 induces Lyn activation (Kasahara et al., 2000). Taken collectively, these pieces of evidence strongly suggest that a cis-complex of L1/NgCAM and TAG-1/axonin-1 transduces signals across DRMs to the Src family kinases, which ultimately controls GC migration. At the same time, L1 localized to non-DRMs may functionally interact with non-DRM molecules, such as β1 integrins (Thelen et al., 2002), to control cell motility. L1 and Ncad share common downstream signals for stimulating neurite growth, such as the MAPK cascade (Perron and Bixby, 1999). Ligation of Ncad activates the MAPK cascade, although intermediate components in this signaling pathway have been less well identified than in L1's pathway. It remains to be determined whether Ncad activates MAPK in a similar manner to L1 or via an independent cascade, such as the Ras-MAPK pathway that also requires DRMs for its activation (Rizzo et al., 2001).
CAM activation induces characteristic morphologies of GCs. Changes in their morphologies can be triggered by CAM-associated signals that have been generated within a part of the GCs (Burden-Gulley et al., 1995). Candidates for such signaling molecules are the Rho family GTPases, such as Rac, Cdc42, and Rho, which regulate the organization of the actin cytoskeleton (Hall, 1998). Rac is involved in the formation of the lamellipodia, whereas Cdc42 regulates the filopodial formation (Luo et al., 1997). It has been demonstrated that L1 ligation increases the amount of activated, GTP-bound Rac (Schmid et al., 2000). Therefore, Rac activation is likely to be involved in the formation of lamellipodial GCs on L1, and maybe on Ncad, too. Interestingly, Rac1 is mainly associated with DRMs in nerve GCs, whereas Cdc42 and RhoA are mostly recovered in non-DRM fractions (Kumanogoh et al., 2001). This is consistent with our result that DRM disruption by micro-CALI causes lamellipodial retraction. These pieces of evidence imply that, in response to homophilic binding, L1 and Ncad transduce signals across DRMs, leading to Rac activation and the subsequent formation of the lamellipodia.
Perhaps the most interesting finding in this study is that DRMs in different domains of a GC are differentially involved in CAM-induced behavior of the GC, indicating the importance of CAM-associated signals that are controlled by DRMs in a spatially defined manner. This is a reasonable mechanism, given that GC motility is dependent on distinct but cooperative functions of the P-domain and the C-domain (Gordon-Weeks, 2000). As suggested by Doherty et al. (2000), the P-domain produces instructive signals for neurite growth and guidance, whereas the C-domain generates signals that are more likely to be permissive. The most important implication of this study is that DRM-dependent signals generated by L1 and Ncad in the P-domain instruct GC motility and morphological characteristics.
Materials and methods
Antibodies
Mouse monoclonal anti-TfR antibody was obtained from Zymed Laboratories, rabbit polyclonal anti-Ncad antibody and goat polyclonal anti-CTxB antiserum from Calbiochem, rabbit polyclonal anti-actin antiserum from Sigma-Aldrich, mouse monoclonal anti-β1 integrin antibody from Transduction Laboratories, rat monoclonal anti-β1 integrin antibody from CHEMICON International, and rat monoclonal anti-Thy-1 from BD Biosciences. Rabbit antiserum against the L1 cytoplasmic domain (Schaefer et al., 1999) was provided by Dr. Vance Lemmon (Case Western Reserve University, Cleveland, OH). HRP-conjugated goat anti–mouse IgG and goat anti–rabbit IgG were purchased from New England Biolabs, Inc., HRP-conjugated goat anti–rat IgG from Cappel, and Alexa-conjugated secondary antibodies from Molecular Probes, Inc.
Cell culture
DRGs dissected from E17 mice were dissociated sequentially with 2.4 U/ml dispase II (Roche) and 0.1 mg/ml DNase (Roche) in PBS. The dissociated cells were resuspended in RPMI 1640 medium (Life Technologies) supplemented with N2 (Life Technologies), 750 μg/ml BSA (Life Technologies), and 20 ng/ml NGF (Promega). The cells were plated on a dish that had been coated with laminin (9 μg/cm2; Life Technologies), L1-Fc, or Ncad-Fc (a gift of Dr. Patrick Doherty, Guy's Hospital, London, UK). Production of CAM-Fc and preparation of CAM-Fc–coated dishes were performed as described previously (Kamiguchi and Yoshihara, 2001).
For cultures of cerebellar granule cells, the cerebellums dissected from P8 mice were dissociated sequentially with 1% trypsin (Life Technologies) and 0.5 mg/ml DNase in PBS. The dissociated cells were resuspended in NEUROBASAL™ medium (Life Technologies) supplemented with B27 (Life Technologies) and 750 μg/ml BSA, and plated on a dish coated with various substrates. Purity of the cultures was tested by immunocytochemistry using antibodies against glial fibrillary acidic protein (Sigma-Aldrich) and Zic (a gift of Dr. Jun Aruga, RIKEN Brain Science Institute, Saitama, Japan), a protein whose expression is restricted to granule cells in the cerebellum (Aruga et al., 1994). Analyses of a total of more than 2,000 cells in the cultures revealed that 0.74 ± 0.05% (n = 3) and 98.67 ± 0.07% (n = 3) of the cells were positive for glial fibrillary acidic protein and Zic, respectively.
NIH 3T3 cells (American Type Culture Collection) were seeded on a dish coated with poly-d-lysine (70–150 kD; 0.1 mg/ml; Sigma-Aldrich) and cultured in RPMI 1640 medium supplemented with 10% FBS. All the cultures were maintained in a humid atmosphere of 95% air, 5% CO2 at 37°C.
Detergent extraction and sucrose density gradient centrifugation
For in vivo samples, ∼50 mg of the cerebellums from P3, P8, P15, P28, or P56 mice were homogenized in 1.5 ml TBS (25 mM Tris, 137 mM sodium chloride, and 2.68 mM potassium chloride, pH 7.4) containing 0.25% Tx100, protease inhibitor cocktail (Roche), and 2 mM pervanadate. After a 30-min extraction, 1 ml of the supernatant obtained by centrifugation was mixed with an equal volume of 80% sucrose and transferred to a centrifuge tube (SW55Ti; Beckman Coulter). This preparation was overlaid sequentially with 2 ml of 32% sucrose and 1 ml of 5% sucrose, both containing protease inhibitor cocktail and 2 mM pervanadate. The gradient was centrifuged at 368,000 g for 20 h, and 10 fractions (500 μl each) were collected from the top. All the procedures were done at 4°C.
For in vitro samples, 107 of cerebellar granule cells from P8 mice were cultured on poly-d-lysine for 36 h. Cellular cholesterol was depleted by a treatment with 0–4 μM lovastatin (Wako) throughout the culture period. Cells were scraped, spun down, and lysed in 1 ml TBS containing 0.5% Tx100, protease inhibitor cocktail, and 2 mM pervanadate for 30 min at 4°C. After centrifugation, 900 μl of the supernatant was mixed with an equal volume of 80% sucrose, and transferred to an SW60Ti centrifuge tube (Beckman Coulter). This preparation was overlaid sequentially with 1.8 ml of 32% and 900 μl of 5% sucrose, both containing protease inhibitor cocktail and 2 mM pervanadate. The gradient was centrifuged at 485,000 g for 20 h, and 10 fractions (450 μl each) were collected from the top. The fractions 2–4 or the fractions 7–10 were combined and concentrated by 3-h centrifugation at 485,000 g. The pellets were resuspended and subjected to SDS-PAGE.
Western blot analysis
Samples were separated by SDS-PAGE and transferred to a polyvinilidene difluoride membrane (Genetix). The membrane was blocked with 5% skim milk and 0.05% Tween 20 in PBS for 1 h at RT and incubated with a primary antibody overnight at 4°C. Primary antibodies used were as follows: anti-L1 antiserum (1:10,000 dilution), 0.25 μg/ml anti-TfR, 2 μg/ml anti-Ncad, 0.1 μg/ml mouse anti-β1 integrin for in vivo samples, 5 μg/ml rat anti-β1 integrin for in vitro samples, and anti-actin antiserum (1:500 dilution). After washes, the membrane was incubated with HRP-conjugated secondary antibodies. GM1 was labeled with 10 μg/ml HRP-conjugated CTxB (Sigma-Aldrich) for 50 min at RT. The blots were then detected by ECL plus reagents (Amersham Biosciences) on Scientific Imaging Film (Kodak). The intensity of the blots was quantified by NIH image version 1.62.
CTxB patching and image analysis
DRM patches were formed and visualized by incubating live DRG neurons sequentially with 8 μg/ml CTxB for 10 min at 4°C, anti-CTxB antiserum (1:250 dilution) for 1 h at 18°C, and 10 μg/ml Alexa 594-conjugated donkey anti–goat IgG for 10 min at 4°C. The cells were fixed with 2% formaldehyde and 0.05% glutaraldehyde in PBS for 5 min at 4°C and then incubated in methanol for 5 min at −20°C. After blocking with 10% horse serum in PBS, the fixed cells were incubated with anti-L1 antiserum (1:2,000 dilution), 10 μg/ml anti-Ncad antibody, or 10 μg/ml rat anti-β1 integrin antibody, and CAM expression was visualized with 10 μg/ml Alexa 488-conjugated secondary antibodies.
Grayscale images of CTxB patches and immunolabeled CAM signals were acquired using a 12-bit digital CCD camera (Cool SNAP HQ; Roper Scientific) and the MetaMorph® Imaging System version 4.0 (Universal Imaging Corp.). To minimize alignment errors in superimposition of the two images, a single multi-band dichroic mirror was used along with appropriate pairs of excitation and emission filters in external filter changers. Exposure time was adjusted so that the maximal pixel intensity value within a GC was 60–80% saturation. The integrated intensity (the sum of intensity values of all pixels in a region) was used as a parameter for thresholding. A threshold intensity level was set in each wavelength channel such that the integrated intensity above this threshold in a GC accounted for 10% of the total integrated intensity in the same GC. Pixel intensity values greater than this threshold level were defined as “intense” signals. A pixel with intense signals in both wavelength channels was regarded as indicating CAM colocalization with CTxB patches. For quantitative analysis, the ratio of the area showing colocalization to the area showing intense CAM signals was measured in each GC.
Micro-CALI
For micro-CALI of GM1 in DRG GCs, a cell-culture medium was replaced with Leibovitz L-15 (Life Technologies) supplemented with N2, 750 μg/ml BSA, and 20 ng/ml NGF. For NIH-3T3 cells, a serum-containing medium was replaced with Leibovitz L-15 supplemented with 750 μg/ml BSA. Cells were maintained in a humid atmosphere of 100% air at 37°C on a microscope stage. Before laser irradiation, the cells were incubated for 20 min with 8 μg/ml FITC-CTxB (Sigma-Aldrich), 4 μg/ml FITC-BSA (Sigma-Aldrich), or 0.8 μM of the FITC-RGD peptide (FITC-GSETQRGDI), all giving a final fluorescein concentration of 0.8 μM. The beam generated by a nitrogen-driven dye laser (VSL-337ND-S nitrogen laser and coumarin 480 dye molecules (6.9 mM; Laser Science, Inc.) was reflected into the epifluorescence port of an inverted microscope (Axiovert S100; Carl Zeiss MicroImaging, Inc.) through the Micropoint Ablation Laser System (Photonic Instruments, Inc.). An area ranging in diameter from 5 to 50 μm on the plane of a target cell was irradiated with the laser beam for 30 s at a frequency of 30 Hz, a pulse width of 3.5 ns, ∼25 nJ/μm2 per pulse, using either a 40× Plan Neofluor (NA 1.3, oil objective) or a 100× Plan Apochromat (NA 1.4, oil objective). The laser-irradiated area was visualized and defined as described previously (Buchstaller and Jay, 2000). In brief, a glass-based dish that had been painted with ink was irradiated, and an area of ink ablated by the laser was imaged with a CCD camera. This procedure was repeated at the end of a series of experiments to confirm that the laser remained to irradiate the same area as had been originally defined on the CCD-taken image. The accuracy of the ink-based method was verified by photobleaching FITC-BSA attached to a cover glass. The extent of laser irradiation was controlled by defocusing the laser beam and by changing an objective lens. Differential interference contrast images of a target GC were taken, and its migration rates (advance rates of the C-domain distal edge) before and after laser irradiation were quantified with the MetaMorph® Imaging System. GCs included in this analysis was limited to single GCs that grew unobstructed and without collapse during the time-lapse imaging.
Thy-1 immunocytochemistry
Immediately after subjected to micro-CALI, cells were incubated with 1% Tx100 in PBS for 10 min, rinsed once, and fixed with 2% formaldehyde and 0.05% glutaraldehyde in PBS for 15 min. As a control, cells were fixed without detergent extraction. All the procedures were done at 4°C. After blocking with 10% horse serum in PBS, the fixed cells were incubated with 50 μg/ml anti-Thy-1 antibody for 1 h at RT. Thy-1 was labeled by incubating the cells with 10 μg/ml Alexa 594-conjugated goat anti–rat IgG for 1 h at RT.
Measurement of neurite length
DRG neurons and cerebellar granule cells were cultivated for 8 h and 36 h, respectively, in the presence or absence of lovastatin, cholesterol (Sigma-Aldrich), fumonisin B1 (Sigma-Aldrich), or NB-DNJ (Sigma-Aldrich). Neurite length was measured as described previously (Kamiguchi and Yoshihara, 2001).
Statistics
Data were expressed as the mean ± SEM. Statistical analyses were performed using Prism version 3.0a (GraphPad Software, Inc.). P values <0.05 were judged statistically different.
Acknowledgments
We are grateful to Drs. J. Aruga, P. Doherty, and V. Lemmon, who provided antibodies and DNA constructs. We also thank Dr. Kohji Kasahara for technical advice on DRM biochemistry, Dr. Kohtaro Takei for introducing us to the use of micro-CALI technology, and Dr. Andrew Schaefer for helpful comments on this manuscript.
This study was partially supported by a Grant-in-Aid for Scientific Research from Japan Society for the Promotion of Science (13680857) to H. Kamiguchi.
Footnotes
Abbreviations used in this paper: CAM, cell adhesion molecule; C-domain, central domain; CTxB, cholera toxin B subunit; DRG, dorsal root ganglion; DRM, detergent-resistant membrane; GC, growth cone; GPI, glycosylphosphatidylinositol; IgCAM, Ig superfamily of CAM; micro-CALI, micro-scale chromophore-assisted laser inactivation; Ncad, N-cadherin; NB-DNJ, N-butyldeoxynojirimycin; P-domain, peripheral domain; TfR, transferrin receptor; Tx100, Triton X-100.
References
- Anderson, R.G., and K. Jacobson. 2002. A role for lipid shells in targeting proteins to caveolae, rafts, and other lipid domains. Science. 296:1821–1825. [DOI] [PubMed] [Google Scholar]
- Aruga, J., N. Yokota, M. Hashimoto, T. Furuichi, M. Fukuda, and K. Mikoshiba. 1994. A novel zinc finger protein, zic, is involved in neurogenesis, especially in the cell lineage of cerebellar granule cells. J. Neurochem. 63:1880–1890. [DOI] [PubMed] [Google Scholar]
- Bickel, P.E., P.E. Scherer, J.E. Schnitzer, P. Oh, M.P. Lisanti, and H.F. Lodish. 1997. Flotillin and epidermal surface antigen define a new family of caveolae-associated integral membrane proteins. J. Biol. Chem. 272:13793–13802. [DOI] [PubMed] [Google Scholar]
- Bixby, J.L., and R. Zhang. 1990. Purified N-cadherin is a potent substrate for the rapid induction of neurite outgrowth. J. Cell Biol. 110:1253–1260. [DOI] [PMC free article] [PubMed] [Google Scholar]
- Bozyczko, D., and A.F. Horwitz. 1986. The participation of a putative cell surface receptor for laminin and fibronectin in peripheral neurite extension. J. Neurosci. 6:1241–1251. [DOI] [PMC free article] [PubMed] [Google Scholar]
- Brown, D.A., and J.K. Rose. 1992. Sorting of GPI-anchored proteins to glycolipid-enriched membrane subdomains during transport to the apical cell surface. Cell. 68:533–544. [DOI] [PubMed] [Google Scholar]
- Bruses, J.L., N. Chauvet, and U. Rutishauser. 2001. Membrane lipid rafts are necessary for the maintenance of the α7 nicotinic acetylcholine receptor in somatic spines of ciliary neurons. J. Neurosci. 21:504–512. [DOI] [PMC free article] [PubMed] [Google Scholar]
- Buchstaller, A., and D.G. Jay. 2000. Micro-scale chromophore-assisted laser inactivation of nerve growth cone proteins. Microsc. Res. Tech. 48:97–106. [DOI] [PubMed] [Google Scholar]
- Buchstaller, A., S. Kunz, P. Berger, B. Kunz, U. Ziegler, C. Rader, and P. Sonderegger. 1996. Cell adhesion molecules NgCAM and axonin-1 form heterodimers in the neuronal membrane and cooperate in neurite outgrowth promotion. J. Cell Biol. 135:1593–1607. [DOI] [PMC free article] [PubMed] [Google Scholar]
- Burden-Gulley, S.M., H.R. Payne, and V. Lemmon. 1995. Growth cones are actively influenced by substrate-bound adhesion molecules. J. Neurosci. 15:4370–4381. [DOI] [PMC free article] [PubMed] [Google Scholar]
- Dahme, M., U. Bartsch, R. Martini, B. Anliker, M. Schachner, and N. Mantei. 1997. Disruption of the mouse L1 gene leads to malformations of the nervous system. Nat. Genet. 17:346–349. [DOI] [PubMed] [Google Scholar]
- de Chaves, E.I., A.E. Rusinol, D.E. Vance, R.B. Campenot, and J.E. Vance. 1997. Role of lipoproteins in the delivery of lipids to axons during axonal regeneration. J. Biol. Chem. 272:30766–30773. [DOI] [PubMed] [Google Scholar]
- Diamond, P., A. Mallavarapu, J. Schnipper, J. Booth, L. Park, T.P. O'Connor, and D.G. Jay. 1993. Fasciclin I and II have distinct roles in the development of grasshopper pioneer neurons. Neuron. 11:409–421. [DOI] [PubMed] [Google Scholar]
- Dietrich, C., B. Yang, T. Fujiwara, A. Kusumi, and K. Jacobson. 2002. Relationship of lipid rafts to transient confinement zones detected by single particle tracking. Biophys. J. 82:274–284. [DOI] [PMC free article] [PubMed] [Google Scholar]
- Doherty, P., G. Williams, and E.J. Williams. 2000. CAMs and axonal growth: a critical evaluation of the role of calcium and the MAPK cascade. Mol. Cell. Neurosci. 16:283–295. [DOI] [PubMed] [Google Scholar]
- Fra, A.M., E. Williamson, K. Simons, and R.G. Parton. 1994. Detergent-insoluble glycolipid microdomains in lymphocytes in the absence of caveolae. J. Biol. Chem. 269:30745–30748. [PubMed] [Google Scholar]
- Fransen, E., R. D'Hooge, G. Van Camp, M. Verhoye, J. Sijbers, E. Reyniers, P. Soriano, H. Kamiguchi, R. Willemsen, S.K. Koekkoek, et al. 1998. L1 knockout mice show dilated ventricles, vermis hypoplasia and impaired exploration patterns. Hum. Mol. Genet. 7:999–1009. [DOI] [PubMed] [Google Scholar]
- Goldberg, D.J., and D.W. Burmeister. 1986. Stages in axon formation: observations of growth of Aplysia axons in culture using video-enhanced contrast-differential interference contrast microscopy. J. Cell Biol. 103:1921–1931. [DOI] [PMC free article] [PubMed] [Google Scholar]
- Gordon-Weeks, P.R. 2000. Neuronal Growth Cones. Cambridge University Press, Cambridge/New York. 260 pp.
- Grumet, M., and G.M. Edelman. 1988. Neuron-glia cell adhesion molecule interacts with neurons and astroglia via different binding mechanisms. J. Cell Biol. 106:487–503. [DOI] [PMC free article] [PubMed] [Google Scholar]
- Hall, A. 1998. Rho GTPases and the actin cytoskeleton. Science. 279:509–514. [DOI] [PubMed] [Google Scholar]
- Harel, R., and A.H. Futerman. 1993. Inhibition of sphingolipid synthesis affects axonal outgrowth in cultured hippocampal neurons. J. Biol. Chem. 268:14476–14481. [PubMed] [Google Scholar]
- He, Q., and K.F. Meiri. 2002. Isolation and characterization of detergent-resistant microdomains responsive to NCAM-mediated signaling from growth cones. Mol. Cell. Neurosci. 19:18–31. [DOI] [PubMed] [Google Scholar]
- Ignelzi, M.A., Jr., D.R. Miller, P. Soriano, and P.F. Maness. 1994. Impaired neurite outgrowth of src-minus cerebellar neurons on the cell adhesion molecule L1. Neuron. 12:873–884. [DOI] [PubMed] [Google Scholar]
- Ikonen, E. 2001. Roles of lipid rafts in membrane transport. Curr. Opin. Cell Biol. 13:470–477. [DOI] [PubMed] [Google Scholar]
- Janes, P.W., S.C. Ley, and A.I. Magee. 1999. Aggregation of lipid rafts accompanies signaling via the T cell antigen receptor. J. Cell Biol. 147:447–461. [DOI] [PMC free article] [PubMed] [Google Scholar]
- Kamiguchi, H., and F. Yoshihara. 2001. The role of endocytic L1 trafficking in polarized adhesion and migration of nerve growth cones. J. Neurosci. 21:9194–9203. [DOI] [PMC free article] [PubMed] [Google Scholar]
- Kasahara, K., K. Watanabe, K. Takeuchi, H. Kaneko, A. Oohira, T. Yamamoto, and Y. Sanai. 2000. Involvement of gangliosides in glycosylphosphatidylinositol-anchored neuronal cell adhesion molecule TAG-1 signaling in lipid rafts. J. Biol. Chem. 275:34701–34709. [DOI] [PubMed] [Google Scholar]
- Kolter, T., and K. Sandhoff. 1998. Recent advances in the biochemistry of sphingolipidoses. Brain Pathol. 8:79–100. [DOI] [PMC free article] [PubMed] [Google Scholar]
- Kumanogoh, H., S. Miyata, Y. Sokawa, and S. Maekawa. 2001. Biochemical and morphological analysis on the localization of Rac1 in neurons. Neurosci. Res. 39:189–196. [DOI] [PubMed] [Google Scholar]
- Kunz, S., U. Ziegler, B. Kunz, and P. Sonderegger. 1996. Intracellular signaling is changed after clustering of the neural cell adhesion molecules axonin-1 and NgCAM during neurite fasciculation. J. Cell Biol. 135:253–267. [DOI] [PMC free article] [PubMed] [Google Scholar]
- Ledesma, M.D., K. Simons, and C.G. Dotti. 1998. Neuronal polarity: essential role of protein-lipid complexes in axonal sorting. Proc. Natl. Acad. Sci. USA. 95:3966–3971. [DOI] [PMC free article] [PubMed] [Google Scholar]
- Lemmon, V., K.L. Farr, and C. Lagenaur. 1989. L1-mediated axon outgrowth occurs via a homophilic binding mechanism. Neuron. 2:1597–1603. [DOI] [PubMed] [Google Scholar]
- Linden, K.G., J.C. Liao, and D.G. Jay. 1992. Spatial specificity of chromophore assisted laser inactivation of protein function. Biophys. J. 61:956–962. [DOI] [PMC free article] [PubMed] [Google Scholar]
- Lisanti, M.P., P.E. Scherer, J. Vidugiriene, Z. Tang, A. Hermanowski-Vosatka, Y.H. Tu, R.F. Cook, and M. Sargiacomo. 1994. Characterization of caveolin-rich membrane domains isolated from an endothelial-rich source: implications for human disease. J. Cell Biol. 126:111–126. [DOI] [PMC free article] [PubMed] [Google Scholar]
- Luo, L., L.Y. Jan, and Y.N. Jan. 1997. Rho family GTP-binding proteins in growth cone signalling. Curr. Opin. Neurobiol. 7:81–86. [DOI] [PubMed] [Google Scholar]
- Maile, L.A., Y. Imai, J.B. Clarke, and D.R. Clemmons. 2002. Insulin-like growth factor I increases αVβ3 affinity by increasing the amount of integrin-associated protein that is associated with non-raft domains of the cellular membrane. J. Biol. Chem. 277:1800–1805. [DOI] [PubMed] [Google Scholar]
- Malhotra, J.D., P. Tsiotra, D. Karagogeos, and M. Hortsch. 1998. Cis-activation of L1-mediated ankyrin recruitment by TAG-1 homophilic cell adhesion. J. Biol. Chem. 273:33354–33359. [DOI] [PubMed] [Google Scholar]
- Niethammer, P., M. Delling, V. Sytnyk, A. Dityatev, K. Fukami, and M. Schachner. 2002. Cosignaling of NCAM via lipid rafts and the FGF receptor is required for neuritogenesis. J. Cell Biol. 157:521–532. [DOI] [PMC free article] [PubMed] [Google Scholar]
- Olive, S., C. Dubois, M. Schachner, and G. Rougon. 1995. The F3 neuronal glycosylphosphatidylinositol-linked molecule is localized to glycolipid-enriched membrane subdomains and interacts with L1 and fyn kinase in cerebellum. J. Neurochem. 65:2307–2317. [DOI] [PubMed] [Google Scholar]
- Ostermeyer, A.G., B.T. Beckrich, K.A. Ivarson, K.E. Grove, and D.A. Brown. 1999. Glycosphingolipids are not essential for formation of detergent-resistant membrane rafts in melanoma cells. methyl-β-cyclodextrin does not affect cell surface transport of a GPI-anchored protein. J. Biol. Chem. 274:34459–34466. [DOI] [PubMed] [Google Scholar]
- Payne, H.R., S.M. Burden, and V. Lemmon. 1992. Modulation of growth cone morphology by substrate-bound adhesion molecules. Cell Motil. Cytoskeleton. 21:65–73. [DOI] [PubMed] [Google Scholar]
- Perron, J.C., and J.L. Bixby. 1999. Distinct neurite outgrowth signaling pathways converge on ERK activation. Mol. Cell. Neurosci. 13:362–378. [DOI] [PubMed] [Google Scholar]
- Platt, F.M., G.R. Neises, R.A. Dwek, and T.D. Butters. 1994. N-butyldeoxynojirimycin is a novel inhibitor of glycolipid biosynthesis. J. Biol. Chem. 269:8362–8365. [PubMed] [Google Scholar]
- Ren, Q., and V. Bennett. 1998. Palmitoylation of neurofascin at a site in the membrane-spanning domain highly conserved among the L1 family of cell adhesion molecules. J. Neurochem. 70:1839–1849. [DOI] [PubMed] [Google Scholar]
- Rizzo, M.A., C.A. Kraft, S.C. Watkins, E.S. Levitan, and G. Romero. 2001. Agonist-dependent traffic of raft-associated Ras and Raf-1 is required for activation of the mitogen-activated protein kinase cascade. J. Biol. Chem. 276:34928–34933. [DOI] [PubMed] [Google Scholar]
- Sasaki, T., and R. Timpl. 2001. Domain IVa of laminin α5 chain is cell-adhesive and binds β1 and αVβ3 integrins through Arg-Gly-Asp. FEBS Lett. 509:181–185. [DOI] [PubMed] [Google Scholar]
- Schaefer, A.W., H. Kamiguchi, E.V. Wong, C.M. Beach, G. Landreth, and V. Lemmon. 1999. Activation of the MAPK signal cascade by the neural cell adhesion molecule L1 requires L1 internalization. J. Biol. Chem. 274:37965–37973. [DOI] [PubMed] [Google Scholar]
- Schaefer, A.W., Y. Kamei, H. Kamiguchi, E.V. Wong, I. Rapoport, T. Kirchhausen, C.M. Beach, G. Landreth, S.K. Lemmon, and V. Lemmon. 2002. L1 endocytosis is controlled by a phosphorylation-dephosphorylation cycle stimulated by outside-in signaling by L1. J. Cell Biol. 157:1223–1232. [DOI] [PMC free article] [PubMed] [Google Scholar]
- Schmid, R.S., W.M. Pruitt, and P.F. Maness. 2000. A MAP kinase-signaling pathway mediates neurite outgrowth on L1 and requires Src-dependent endocytosis. J. Neurosci. 20:4177–4188. [DOI] [PMC free article] [PubMed] [Google Scholar]
- Simons, K., and D. Toomre. 2000. Lipid rafts and signal transduction. Nat. Rev. Mol. Cell Biol. 1:31–39. [DOI] [PubMed] [Google Scholar]
- Smart, E.J., Y.S. Ying, C. Mineo, and R.G. Anderson. 1995. A detergent-free method for purifying caveolae membrane from tissue culture cells. Proc. Natl. Acad. Sci. USA. 92:10104–10108. [DOI] [PMC free article] [PubMed] [Google Scholar]
- Surrey, T., M.B. Elowitz, P.E. Wolf, F. Yang, F. Nedelec, K. Shokat, and S. Leibler. 1998. Chromophore-assisted light inactivation and self-organization of microtubules and motors. Proc. Natl. Acad. Sci. USA. 95:4293–4298. [DOI] [PMC free article] [PubMed] [Google Scholar]
- Takeichi, M. 1991. Cadherin cell adhesion receptors as a morphogenetic regulator. Science. 251:1451–1455. [DOI] [PubMed] [Google Scholar]
- Tansey, M.G., R.H. Baloh, J. Milbrandt, and E.M. Johnson, Jr. 2000. GFRα-mediated localization of RET to lipid rafts is required for effective downstream signaling, differentiation, and neuronal survival. Neuron. 25:611–623. [DOI] [PubMed] [Google Scholar]
- Thelen, K., V. Kedar, A.K. Panicker, R.S. Schmid, B.R. Midkiff, and P.F. Maness. 2002. The neural cell adhesion molecule L1 potentiates integrin-dependent cell migration to extracellular matrix proteins. J. Neurosci. 22:4918–4931. [DOI] [PMC free article] [PubMed] [Google Scholar]
- Tomaselli, K.J., L.F. Reichardt, and J.L. Bixby. 1986. Distinct molecular interactions mediate neuronal process outgrowth on non-neuronal cell surfaces and extracellular matrices. J. Cell Biol. 103:2659–2672. [DOI] [PMC free article] [PubMed] [Google Scholar]
- Yip, P.M., X. Zhao, A.M. Montgomery, and C.H. Siu. 1998. The Arg-Gly-Asp motif in the cell adhesion molecule L1 promotes neurite outgrowth via interaction with the αvβ3 integrin. Mol. Biol. Cell. 9:277–290. [DOI] [PMC free article] [PubMed] [Google Scholar]