Abstract
OBJECTIVE: Family members of patients with an established diagnosis of type 2 diabetes mellitus (T2DM) are theoretically at risk of having the metabolic syndrome (MetS). A sample of these family members was studied from a population in a small township in Argentina, which has a high prevalence of T2DM. METHODS: We examined the clinical and metabolic characteristics of 132 first-degree relatives of T2DM patients (FDR) and 112 age-matched controls. The subjects were categorized according to the International Diabetes Federation (IDF) and National Cholesterol Education Program Adult Treatment Panel III (NCEP-ATPIII) criteria for MetS. RESULTS: The prevalence of MetS in the FDR group was 34.8 (IDF) and 26.5% (NCEP-ATPIII) respectively, which was significantly different to the prevalence in controls (p < 0.025). According to IDF criteria, the most prevalent factors among FDR subjects with MetS were low HDL-cholesterol (87%) followed by hypertriglyceridemia (69.5%). In the MetS group, which ranged between 20-29 years old (36%), the major risk factor in women was a low HDL-cholesterol serum level. In the MetS group, which ranged between 30-39 years old (44.4%), the most important risk factor in men was hypertriglyceridemia. CONCLUSION: This study revealed that the prevalence of MetS is high in young FDR adults, who need urgent preventive treatment, including lifestyle changes. The risk of developing T2DM is five times higher in non-diabetic people with MetS than in those without the syndrome.
Keywords: type 2 diabetes, metabolic syndrome, triglycerides, HDL-cholesterol, family history
Introduction
Type 2 diabetes mellitus (T2DM) is a heterogeneous disease with a strong genetic component. It is characterized by insulin resistance and impaired beta-cell function. Studies in T2DM patients have shown that defects in both insulin secretion and insulin action seem to be inherited [1-3]. The combination of insulin resistance and compensatory hyperinsulinemia increases the risk of hypertension and dyslipidemia characterized by high plasma triglycerides (TG) and low high-density lipoprotein cholesterol (HDL-C) concentration. These changes increase the risk of cardiovascular disease. In 1988, this cluster of related abnormalities was designated as Syndrome X [4, 5].
Today, the increased risk for developing cardiovascular disease and diabetes associated with a cluster of metabolic abnormalities is referred to as the metabolic syndrome (MetS). MetS includes hypertension, glucose intolerance, high TG, low HDL-C and abdominal obesity [6]. The strong association of abdominal obesity with metabolic abnormalities has prompted the National Institute of Health (NIH) of the United States of America [7] and the World Health Organization (WHO) [8] to issue guidelines for the use of gender-specific waist circumference cut points to identify abdominal obesity [9].
The most widely used definitions for clinical identification of the MetS are provided by the National Cholesterol Education Program Adult Treatment Panel III (NCEP-ATPIII) [10] and the International Diabetes Federation (IDF) [11]. MetS by NCEP-ATPIII is defined when a subject meets three or more of the following five criteria:
Arterial blood pressure ≥ 130/85 mmHg.
Central obesity (waist circumference, male < 102 cm; female < 88 cm).
Serum TG level ≥ 150 mg/dl (1.7 mmol/l).
Serum HDL-C level < 40 mg/dl (1.03 mmol/l) in male or < 50 mg/dl (1.29 mmol/l) in female.
Fasting glucose ≥ 110 mg/dl (6.1 mmol/l).
The new IDF definition for MetS differs from the NCEP-ATPIII definition in that it puts more emphasis on the role of obesity and contains a stricter requirement for central obesity. According to this, the IDF waist circumference level for South Americans is: males ≥ 90 cm and females ≥ 80 cm. The rationale for this requirement is that central obesity is more strongly correlated with the other MetS features than is any other parameter [12, 13]. For a person to be defined as having the MetS, he or she must have central obesity plus any two of the four factors, as defined above (i.e. raised TG level, reduced HDL-C level, raised blood pressure and raised fasting plasma glucose) or previously diagnosed diabetes mellitus [11, 13].
In this study, we estimated the prevalence of MetS in first-degree relatives of T2DM patients (FDR). We hypothesized that family members of patients with an established diagnosis of T2DM are theoretically at risk of having the syndrome and of developing T2DM as well. The theoretical rationale for this hypothesis is supported by the evidence that 1) T2DM has a critical genetic dimension which is transferred to offspring to a high degree [14] and 2) MetS is closely related to the developing T2DM [15]. In order to test this hypothesis, this study examined the prevalence of MetS in first-degree relatives of T2DM patients.
We used both the IDF and NCEP-ATPIII definition to determine the prevalence of MetS in fist-degree relatives of T2DM patients. The study showed that prevalence rates differ considerably when applying the two definitions. This is remarkable as both guidelines differ only in the way central obesity is defined, as described above. While central obesity was a major factor for diagnosing MetS in this study, lipid disorders (low HDL-cholesterol and hypertriglyceridemia) were similar common factors. In this context, it would be interesting to find out, which definition is a better predictor of the development of T2DM. However, this question needs long-term follow-up and is beyond the scope of the present study. It would be appropriate for future investigations.
Methods
Subjects
We studied a randomly selected cross-sectional population sample of first-degree family members of T2DM patients from Santa Rosa del Conlara, a small township in the province of San Luis, Argentina, which has a high prevalence of T2DM. Sample subjects were not previously diagnosed with T2DM. The reason for excluding diagnosed T2DM patients is that we aimed to detect subjects at risk for T2DM and associated metabolic abnormalities in a general group of subjects who are genetically at risk. Other exclusion criteria related to liver, renal or thyroid disease, and the consumption of antilipemic agents. On the first day after overnight fast (10 to 12 h), blood samples were obtained for the determination of plasma glucose, plasma HDL-C and plasma TG levels. Informed consent was obtained from all individuals before participation in the study.
We used the IDF definition for clinical identification of family members with MetS. The study consisted of 132 FDR of T2DM patients (79 female and 53 male), aged between 20 and 55 years. We also recruited an age-matched control cohort consisting of 112 individuals (64 women and 48 men) without T2DM and without FDR history from the same region. For gathering data, a standardized health questionnaire was used, which covered the individuals’ medical history, current and previous medication and family history of diabetes.
On the first day, each subject also underwent a structured examination, which included measurement of height, weight and waist circumference (WC). Height and weight were measured to the nearest 0.5 cm and 0.1 kg, respectively. Body mass index (BMI) was calculated as weight (kg) divided by height (m) squared. WC was determined at the umbilical level (cm) to the nearest 0.1 cm using a measuring tape positioned at the midpoint between the lowest rib and iliac crest.
Metabolic measurement
We used the IDF guideline to identify individuals with MetS and the data obtained from these individuals were used in the biochemical and clinical analyses. In a separate analysis, MetS defined by NCEP-ATPIII guidelines was compared to MetS defined by the IDF-definition. For IDF we first looked at central obesity (with WC of ≥ 90 cm in males and ≥ 80 cm in females) plus any two of the four additional factors (raised TG levels, reduced HDL-C levels, raised blood pressure or raised fasting glucose), as outlined in the Introduction. According to NCEP-ATPIII criteria, any three or more of the five risk factors consisting of central obesity (with WC of < 102 cm in male and < 88 cm in female), raised TG levels, reduced HDL-C levels, raised blood pressure and raised fasting glucose were decisive in classifying individuals as MetS patients.
Biochemical measurement
The measurement of plasma glucose was carried out by the glucose oxidase method, using a commercial enzymatic reagent (Wiener Kit). Plasma TG and cholesterol concentrations were measured by enzymatic methods (Wiener Kit).
Statistical Methods
The statistical analysis was performed using EPI-INFO software. The parametric Student’s t-test was used to compare means ± SD. Prevalence values, according to the characteristics of subjects, were compared using the Chi-square test. A p-value of less than 0.05 was considered to be statistically significant and odds ratios (OR) for FDR subjects compared to controls were expressed with 95% confidence intervals (CI).
Results
Table 1 shows the comparison between FDR and control subjects. The prevalence of MetS, defined according to IDF criteria, was significantly higher in FDR compared to controls (p < 0.025). Age was similar in both groups, as it was when only subjects with MetS were analyzed. The age of subjects with diagnosed MetS was higher in both groups (FDR and control) than the age of those without MetS.
Table 1. Clinical characteristics of first-degree relatives of type 2 diabetes patients and controls.
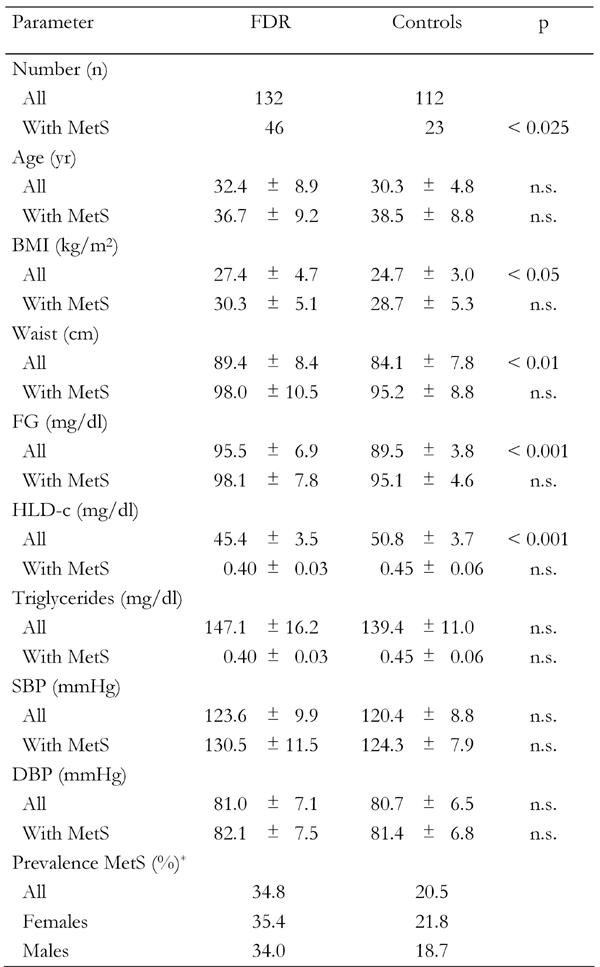
Data are expressed as mean ± SD. FDR: first-degree relatives. MetS: metabolic syndrome. BMI: body mass index. FG: fasting glucose. HLD-c: high lipoprotein density cholesterol. SBP: systolic blood pressure. DBP: diastolic blood pressure. n.s.: not significant. * According to IDF.
By comparing the complete samples of FDR and controls, it emerged that BMI, waist circumference, fasting glucose and HDL-C were significantly different (Table 1). As expected, no significant differences for these parameters were observed when only those subjects with diagnosed MetS were compared. The prevalence of MetS in FDR subjects, according to the IDF definition, was 34.8 (OR = 1.07; 0.48 < OR < 2.37) and 26.5% (OR = 1.29; 0.54 < OR < 3.09) according to the NCEP-ATPIII definition, compared to the prevalence in control subjects (Table 2).
Table 2. Prevalence of the metabolic syndrome in first-degree relatives of type 2 diabetes patients according to IDF and NCEP-ATPIII criteria.

Data are absolute numbers (first columns) and percentages of subjects (second columns) who have MetS or who does not have MetS (¬MetS). MetS: metabolic syndrome.
Focusing on subjects with MetS in FDR subjects, Table 3 shows the anthropometric characteristics of 132 FDR subjects (79 woman and 53 men). Subjects were grouped according to gender and presence or absence of MetS. The average age was 32.4 ± 6.1 for all subjects (range 20-55 yr). Statistically significant differences in age between subjects with and without MetS in both women (p < 0.005) and men (p < 0.003) were observed (Table 3). The analysis of MetS prevalence rates in the FDR group also showed significant gender differences with respect to age. Figure 1 shows that the major fraction of women with MetS was in the range 20-29 yr (32%), while the major fraction of men with MetS appeared in the 30-39 yr (50%) group. Interestingly, in both cases, the prevalence of MetS decreases with age. This can be explained by the exclusion of subjects with diagnosed T2DM, i.e. persons with MetS, who may have already proceeded to T2DM in later years of life, were not present in the study sample.
Table 3. Clinical characteristics of first-degree relatives of type 2 diabetes patients with and without metabolic syndrome according to IDF criteria.
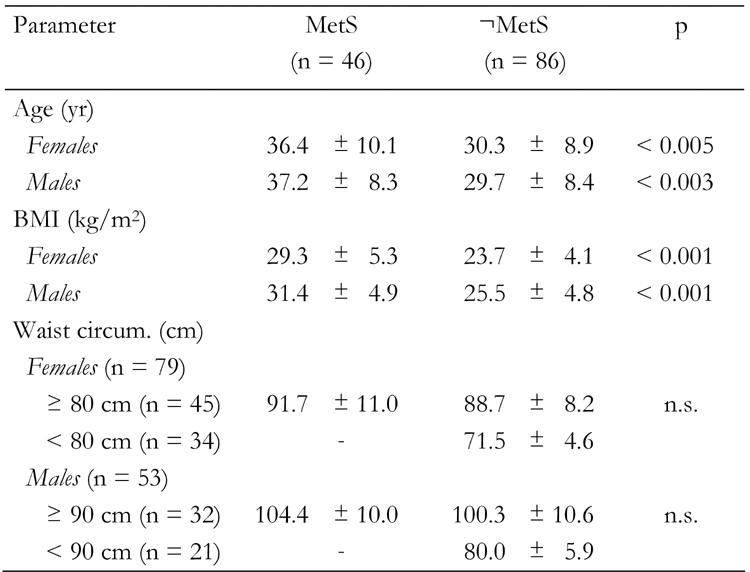
Data are expressed as mean ± SD. There were 28 women and 18 men with MetS diagnosis. Among those subjects who were not MetS diagnosed (¬MetS) there were 51 women and 35 men. MetS: metabolic syndrome. n.s.: not significant.
Figure 1.
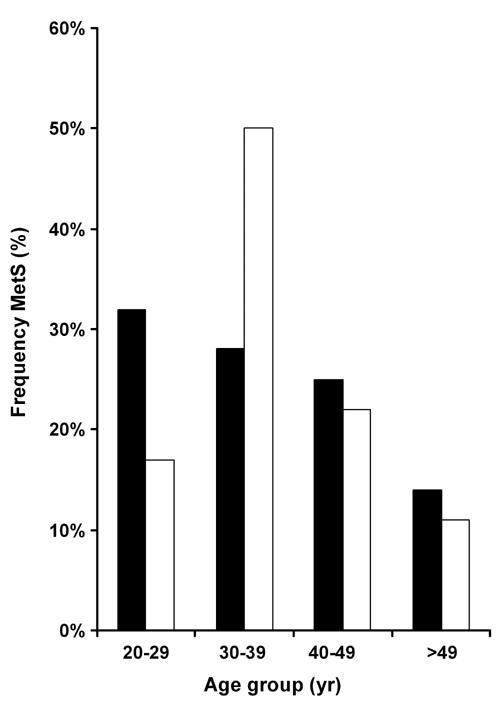
Age-adjusted frequency of the metabolic syndrome among first-degree relatives of type 2 diabetes patients in age groups. Women (black columns), men (white columns).
The average BMI for women was 26.5 ± 4.7 (95% CI = 18.1% - 38.9%) and 28.4 ± 4.8 (95% CI = 19.1% - 47.1%) for men. BMI was significantly higher in subjects with MetS compared to subjects without the MetS in men as well as women (p < 0.001, Table 3).
Table 4 shows that, beside central obesity (100%), the major contributory factors for MetS diagnosis in women were lipid disorders (low HDL-cholesterol and hypertriglyceridemia). Low HDL-C serum levels and central obesity were present in all women with MetS. As regards men, low HDL-C serum level was the second risk factor for those with MetS (66.7%). In both genders combined, low HDL-C levels were evident in 87% of FDR subjects with MetS. Hypertriglyceridemia was the most important risk factor among men with MetS (77.8% as opposed to 69.5% in both genders combined). High blood pressure, as a risk factor of MetS, exhibited the lowest frequency in the studied sample.
Table 4. Clinical characteristics of first-degree relatives of type 2 diabetes patients with metabolic syndrome according to IDF criteria.
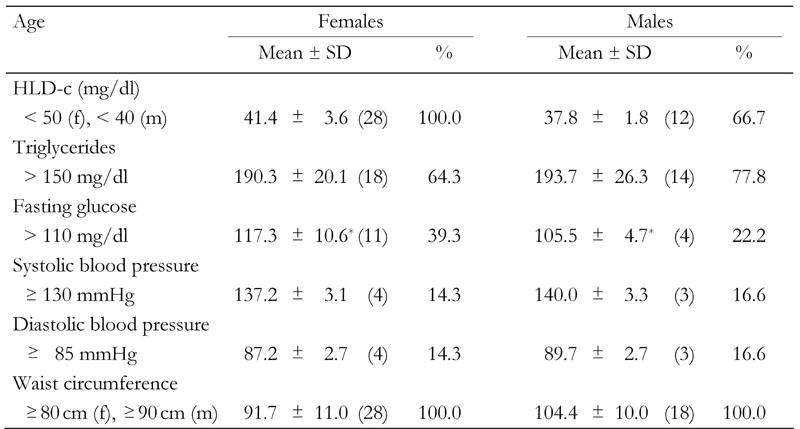
Data are expressed as mean ± SD. Absolute numbers in parentheses. f: female. m: male. * p < 0.05.
High glucose concentrations in fasting individuals differ significantly between men and women with MetS (p < 0.05, Table 4), with higher frequency in women than in men (39.9% as opposed to 22.2%). No significant differences were observed in hypertension frequency between men and women with MetS. High blood pressure as a risk factor of MetS exhibited the lowest frequency in the studied sample (women: 14.3%, men: 16.6%).
Figures 2 and 3 show the prevalence of the four MetS contributory factors among the MetS diagnosed individuals in association with age and gender. Men showed symptoms of MetS later than women. While the highest frequency of low HDL-C serum levels in women was observed in the 20-29 years group (36%), the highest percentage in men appeared between 30-39 years and >39 years (33.3% combined). Regarding hypertriglyceridemia, the opposite was observed for women. The highest frequency appeared in the >39 years group (28.5%), while in men, the highest frequency was observed in the group ranging between 30-39 years again (44.4%). In relation to glycemia, women did not show any difference among the three age groups (10.7%), whereas men showed a high frequency of raised fasting glucose in the group ranging between 30-39 years old (16.6%).
Figure 2.
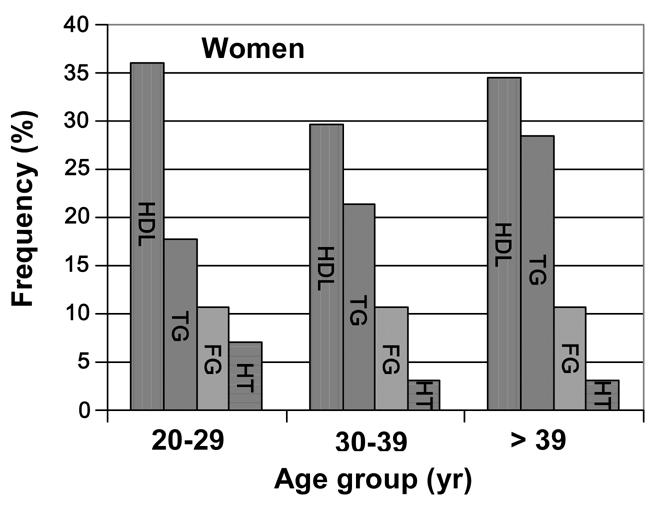
Percentage vs. age-specific prevalence of the risk factors among FDR women with the metabolic syndrome. HDL-cholosterol (first colum), triglycerides (second column), fasting glucose (third column), hypertension (fourth column).
Figure 3.
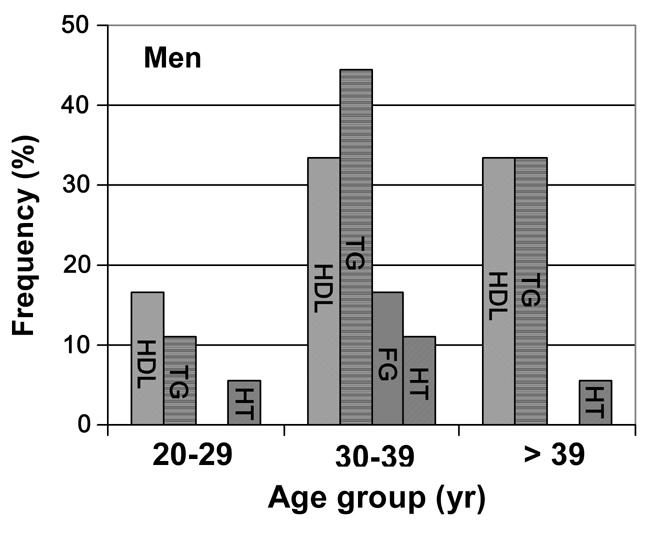
Percentage vs. age-specific prevalence of the risk factors among men with the metabolic syndrome. HDL-cholosterol (first colum), triglycerides (second column), fasting glucose (third column), hypertension (fourth column).
Table 5 shows the separate frequency of the five MetS risk factors prevalent in the sample of FDR subjects. Low HDL-C levels are present in 93.5% of the subjects with MetS, while only 46.5% of subjects without MetS have low HDL-C levels. The second most frequent individual risk factor among subjects with MetS was a high concentration of TG (74%), but also 78% of individuals without MetS exhibited TG concentration above the cut off point. Furthermore, 100% of individuals without MetS are above the cut off point for blood pressure and 95.3% are above healthy fasting glucose levels according to IDF criteria for MetS. This shows that many of the FDR subjects who are currently without MetS are at risk to develop MetS and diabetes.
Table 5. Frequency of risk factors in first-degree relatives of type 2 diabetes patients.
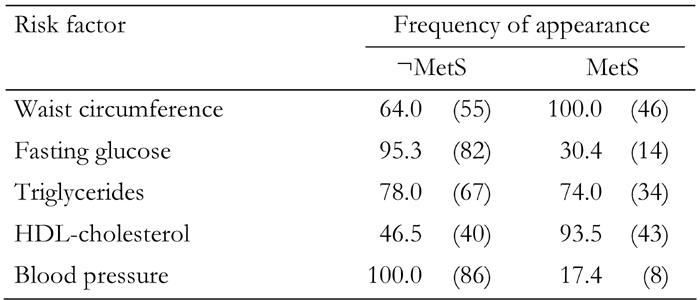
Data are percentages in FDR subjects diagnosed with MetS and without MetS (¬MetS). Absolute numbers in parentheses.
When considering different theoretical combinations of the four risk factors, some of them occur more frequently than others (Table 6). In individuals with MetS, the most frequent combination of three risk factors was: HDL-C, TG and fasting glucose (84.8%). When two risk factors were considered, the most frequent combination was HDL-C and TG (69.5%). Any other combination of two risk factors was not widely prevalent (0% - 19.5%). A combination of hypertension and TG did not appear in the study sample.
Table 6. Frequency of risk factor combinations for the metabolic syndrome in first-degree relatives of type 2 diabetes patients according to IDF criteria.
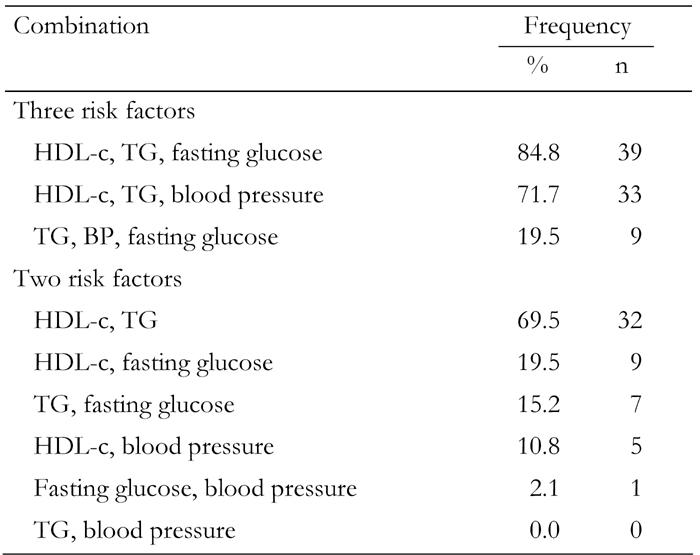
Data are percentages of risk factor combinations in FDR subjects diagnosed with MetS.
Discussion
The aim of the present work was to compare MetS frequency in non-diabetic FDR subjects and in age-matched, non-diabetic controls without family history of T2DM. The geographical region, Santa Rosa del Conlara, a small town in the province of San Luis, has a particular meaning as the prevalence of T2DM is high in such small Argentine townships. A previous study by the same authors revealed that the prevalence of T2DM (13.5%) in the same city was so high as to double the prevalence of this disease at national level. At present, there are no reports on the prevalence of MetS in FDR subjects in provinces such as San Louis where the prevalence of T2DM is high and healthcare restricted compared to Western industrialized countries.
Several studies on the family history of non-diabetic subjects with family antecedents of the disease have shown typical MetS alterations in carbohydrate and lipid metabolism at an early age, including central obesity, dyslipidemia, glucose intolerance, high blood pressure and genetic factors [1, 2, 13].
Obesity, in particular abdominal obesity expressed as waist circumference, is a well-known contributor to the development of MetS [16, 17]. A slight body weight increase may cause a marked metabolic disturbance [18]. Android-type fat distribution with abdominal adiposity is closely related to insulin resistance and has been recognized as an independent cardiovascular risk factor in men and in women [19]. In this study, a significant difference in BMI was observed between FDR subjects with and without MetS for both sexes (p < 0.001, Table 3).
Metabolic studies have shown that obesity is associated with resistance to insulin, impaired glucose tolerance and an unfavorable serum lipid profile. Dyslipoproteinemia, in combination with high levels of TG and low HDL-C levels, is considered to be the main symptom of insulin resistance [20-22]. Recent studies have demonstrated that high TG and low HDL-C levels are powerful predictors of T2DM in the elderly [23, 24]. The present study reveals that low HDL-C and high TG levels are also the most prevalent symptoms in MetS-positive individuals who have first-degree relatives with T2DM. This concordance suggests that MetS and T2DM are closely related diseases and are driven by the same metabolic disturbances. Surprisingly, the combination of hypertension and high TG levels in MetS-positive FDR subjects did not appear at all in the studied sample. However, this may be explained by the relatively young age of the study subjects.
In this study, we also looked for gender differences in MetS risk factors. It appeared that, among FDR subjects, a low HDL-C serum level was the major risk factor in women with MetS (100%, Table 4). HDL-C levels in both genders were also significantly different to those of controls (Table 1). Interestingly, female FDR subjects without MetS also showed a high frequency of low HDL-C serum levels (62%), which was also significantly higher than in controls. This suggests that FDR subjects are at much higher risk of developing MetS and diabetes than individuals without diabetes in their family history.
The risk of developing type 2 diabetes is five times higher for non-diabetic individuals with MetS than for those without the syndrome [13]. In relation to age, in the present study, MetS was most frequent in women aged 20-29 years, while in men it appeared most frequently in the range of 30-39 years (Figures 2 and 3). The development of MetS at an early age and family antecedents with T2DM in the studied population might result in an early development of diabetes. Generally, the young age of highest MetS prevalence and the surprising decrease in MetS with age (Figure 1) may be explained by the fact that subjects with MetS who have already developed diabetes in later stages of life were excluded from the study. On the other hand, this result implies that, if we intend to detect subjects at risk for type 2 diabetes, we should look at females and males between 20 and 40 years. In this age group, there are at-risk individuals in whom the development of type 2 diabetes can be postponed or prevented by appropriate early intervention.
The results of the present study draw attention to the fact that awareness of the risk for and prevention of cardiovascular disease in this particular population should begin as early as the third decade of life. However, the interpretation of the results is limited by the small sample size and the cross-sectional nature of the present study. It is nevertheless possible that, since patients with diabetes have been excluded, the observed pattern may have been caused by selective under-representation of those risk factors most closely associated with the development of type 2 diabetes. This issue can only be resolved by longitudinal studies in this population, relating incidence of diabetes to baseline variables.
Acknowledgments
This work was supported by the National University of San Luis and the Santa Rosa Provincial Hospital. We acknowledge the contributions of Lic. Isabel Gimenez, who performed a large proportion of the statistical analysis.
References
- 1.Groop L, Forsblom C, Lehtovirta M, Tuomi T, Karanko S, Nissen M, Ehrnstrom BO, Forsen B, Isomaa B, Snickars B, Taskinen MR. Metabolic consequences of a family history of NIDDM (the Botnia study): evidence for sex-specific parental effects. Diabetes. 1996;45(11):1585–1593. doi: 10.2337/diab.45.11.1585. [DOI] [PubMed] [Google Scholar]
- 2.Vauhkonen I, Niskanen L, Vanninen E, Kainulainen S, Uusitupa M, Laakso M. Defects in insulin secretion and insulin action in non-insulin-dependent diabetes mellitus are inherited. Metabolic studies on offspring of diabetic probands. J Clin Invest. 1998;101(1):86–96. doi: 10.1172/JCI716. [DOI] [PMC free article] [PubMed] [Google Scholar]
- 3.Li H, Isomaa B, Taskinen MR, Groop L, Tuomi T. Consequences of a family history of type 1 and type 2 diabetes on the phenotype of patients with type 2 diabetes. Diabetes Care. 2000;23(5):589–594. doi: 10.2337/diacare.23.5.589. [DOI] [PubMed] [Google Scholar]
- 4.Reaven GM. Insulin resistance, the insulin resistance syndrome, and cardiovascular disease. Panminerva Med. 2005;47(4):201–210. [PubMed] [Google Scholar]
- 5.Hansen BC. The metabolic syndrome X. Ann NY Acad Sci. 1999;892:1–24. doi: 10.1111/j.1749-6632.1999.tb07782.x. [DOI] [PubMed] [Google Scholar]
- 6.Bjorntorp P. Abdominal obesity and the metabolic syndrome. Ann Med. 1992;24(6):465–468. doi: 10.3109/07853899209166997. [DOI] [PubMed] [Google Scholar]
- 7.National Institutes of Health; Bethesda: The practical guide to the identification, evaluation and treatment of overweight and obesity in adults. 2000
- 8.WHO, Division of No Communicable Diseases, Programme of Nutrition, Family and Reproductive Health. World Health Organization; Geneva: WHO Consultation on Obesity. Obesity: preventing and managing the global epidemic. Obesity: preventing and managing the global. 1998
- 9.Tull ES, Thurland A, LaPorte RE. Metabolic syndrome among Caribbean-born persons living in the U.S. Virgin Islands. Rev Panam Salud Publica. 2005;18(6):418–426. doi: 10.1590/s1020-49892005001000005. [DOI] [PubMed] [Google Scholar]
- 10.Expert Panel on Detection, Evaluation, and Treatment of High Blood Cholesterol in Adults. Executive Summary of The Third Report of The National Cholesterol Education Program (NCEP) Expert Panel on Detection, Evaluation, And Treatment of High Blood Cholesterol In Adults (Adult Treatment Panel III) JAMA. 2001;285(19):2486–2497. doi: 10.1001/jama.285.19.2486. [DOI] [PubMed] [Google Scholar]
- 11.The IDF concensus worldwide definition of the metabolic syndrome. International Diabetes Federation; 2006. pp. 1–2. [Google Scholar]
- 12.Carr DB, Utzschneider KM, Hull RL, Kodama K, Retzlaff BM, Brunzell JD, Shofer JB, Fish BE, Knopp RH, Kahn SE. Intra-abdominal fat is a major determinant of the National Cholesterol Education Program Adult Treatment Panel III criteria for the metabolic syndrome. Diabetes. 2004;53(8):2087–2094. doi: 10.2337/diabetes.53.8.2087. [DOI] [PubMed] [Google Scholar]
- 13.Ford ES. Prevalence of the metabolic syndrome defined by the International Diabetes Federation among adults in the U.S. Diabetes Care. 2005;28(11):2745–2749. doi: 10.2337/diacare.28.11.2745. [DOI] [PubMed] [Google Scholar]
- 14.Dedoussis GV, Kaliora AC, Panagiotakos DB. Genes, Diet and Type 2 Diabetes Mellitus: A Review. Rev Diabet Stud. 2007;4(1):13–24. doi: 10.1900/RDS.2007.4.13. [DOI] [PMC free article] [PubMed] [Google Scholar]
- 15.Haffner SM. Relationship of metabolic risk factors and development of cardiovascular disease and diabetes. Obesity (Silver Spring) 2006;14(Suppl 3):121S–127S. doi: 10.1038/oby.2006.291. [DOI] [PubMed] [Google Scholar]
- 16.Ishikawa M, Pruneda ML, Adams-Huet B, Raskin P. Obesity-independent hyperinsulinemia in nondiabetic first-degree relatives of individuals with type 2 diabetes. Diabetes. 1998;47(5):788–792. doi: 10.2337/diabetes.47.5.788. [DOI] [PubMed] [Google Scholar]
- 17.Eckel RH. Obesity: mechanisms and clinical management. Lippincourt Williams and Wilkins; Philadelphia: 2003. [Google Scholar]
- 18.Denke MA, Sempos CT, Grundy SM. Excess body weight. An underrecognized contributor to high blood cholesterol levels in white American men. Arch intern Med. 1993;153(9):1093–1103. doi: 10.1001/archinte.153.9.1093. [DOI] [PubMed] [Google Scholar]
- 19.McKeique PM, Shah B, Marmot MG. Relation of central obesity and insulin resistance with high diabetes prevalence and cardiovascular risk in South Asians. Lancet. 1991;337(8738):382–386. doi: 10.1016/0140-6736(91)91164-p. [DOI] [PubMed] [Google Scholar]
- 20.Knudsen P, Eriksson J, Lahdenpera S, Kahri J, Groop L, Taskinen MR. Changes of lipolytic enzymes cluster with insulin resistance syndrome. Botnia Study Group. Diabetologia. 1995;38(3):344–350. doi: 10.1007/BF00400640. [DOI] [PubMed] [Google Scholar]
- 21.Sane T, Taskinen MR. Does familial hypertriglyceridemia predispose to NIDDM? Diabetes Care. 1993;16(11):1494–1501. doi: 10.2337/diacare.16.11.1494. [DOI] [PubMed] [Google Scholar]
- 22.Karhapaa P, Malkki M, Laasko M. Isolated low HDL cholesterol. An insulin-resistant state. Diabetes. 1994;43(3):411–417. doi: 10.2337/diab.43.3.411. [DOI] [PubMed] [Google Scholar]
- 23.Meis SB, Schuster D, Gaillard T, Osei K. Metabolic syndrome in non-diabetic, obese, first-degree relatives of African American patients with type 2 diabetes: African American triglycerides, HDL-c and insulin resistance. Ethn Dis. 2006;16(4):830–836. [PubMed] [Google Scholar]
- 24.Oh JY, Hong YS, Sung YA, Barrett-Connor E. Prevalence and factor analysis of metabolic syndrome in an urban Korean population. Diabetes Care. 2004;27(8):2027–2032. doi: 10.2337/diacare.27.8.2027. [DOI] [PubMed] [Google Scholar]


