Abstract
The γ-tubulin small complex (γ-TuSC) is an evolutionarily conserved heterotetramer essential for microtubule nucleation. We have determined the structure of the Saccharomyces cerevisiae γ-TuSC at 25-Å resolution by electron microscopy. γ-TuSC is Y-shaped, with an elongated body connected to two arms. Gold labeling showed that the two γ-tubulins are located in lobes at the ends of the arms, and the relative orientations of the other γ-TuSC components were determined by in vivo FRET. The structures of different subpopulations of γ-TuSC indicate flexibility in the connection between a mobile arm and the rest of the complex, resulting in variation of the relative positions and orientations of the γ-tubulins. In all of the structures, the γ-tubulins are distinctly separated, a configuration incompatible with the microtubule lattice. The separation of the γ-tubulins in isolated γ-TuSC likely plays a role in suppressing its intrinsic microtubule-nucleating activity, which is relatively weak until the γ-TuSC is incorporated into higher order complexes or localized to microtubule-organizing centers. We propose that further movement of the mobile arm is required to bring the γ-tubulins together in microtubule-like interactions, and provide a template for microtubule growth.
INTRODUCTION
Spontaneous growth of microtubules is strongly disfavored under intracellular conditions. To overcome this, microtubules are nucleated at their minus ends by complexes containing γ-tubulin, a paralogue of α- and β-tubulin. First identified as a suppressor of β-tubulin mutations in Aspergillus nidulans (Oakley and Oakley, 1989), γ-tubulin is ubiquitous and essential for nucleation in eukaryotes (Oakley and Akkari, 1999). γ-Tubulin is incorporated into an evolutionarily conserved heterotetramer, the 300-kDa γ-tubulin small complex (γ-TuSC), composed of two copies of Tub4p (the yeast γ-tubulin) and one each of the homologous proteins Spc97p/Dgrip84/GCP3 and Spc98p/Dgrip91/GCP4 (Knop et al., 1997; Oegema et al., 1999).
In Saccharomyces cerevisiae, γ-TuSC is bound directly to the spindle pole body (SPB) by Spc110p on the nuclear face and Spc72p on the cytoplasmic face. In most other eukaryotes, multiple γ-TuSC subunits assemble, along with at least three other accessory proteins, into the ∼2-MDa γ-tubulin ring complex (γ-TuRC) (Moritz et al., 1995; Zheng et al., 1995). Although it lacks the γ-TuRC–specific proteins, Saccharomyces microtubules are capped at the minus ends in a manner similar to γ-TuRC–capped microtubules, suggesting a conserved mechanism of nucleation (Byers et al., 1978; Keating and Borisy, 2000; Moritz et al., 2000; Wiese and Zheng, 2000).
Despite being critically important for in vivo microtubule nucleation, isolated γ-TuSC has only a very weak nucleating ability relative to free γ-tubulin or γ-TuRC. The mechanism by which the intrinsic nucleating ability of γ-tubulin is modulated in the different complexes is unknown (Oegema et al., 1999; Leguy et al., 2000). Also unresolved is the exact nature of the interactions of γ-tubulin with microtubule ends. One model proposes that γ-tubulins interact with each other longitudinally as in a microtubule protofilament, and nucleate through lateral contacts with α/β-tubulin (Erickson, 2000). In contrast, a more widely accepted model proposes that γ-tubulins make lateral contacts with each other and form a template for nucleation via longitudinal contacts with α/β-tubulin. The template model is supported by electron microscopy of γ-TuRC, which is helical and has the same diameter as a microtubule (Moritz et al., 2000; Wiese and Zheng, 2000), and the crystal structure of γ-tubulin, in which γ-tubulin monomers pack with contacts very similar to lateral microtubule interactions. (Moritz et al., 2000; Wiese and Zheng, 2000; Aldaz et al., 2005).
To better understand the mechanism of microtubule nucleation by γ-tubulin complexes and how this activity might be regulated, we have determined the structure of the Saccharomyces γ-TuSC by electron microscopy at 25-Å resolution. Gold labeling revealed the position of Tub4p in the complex, and the orientations of Spc97p and Spc98p were inferred by in vivo FRET analysis. The complex is Y-shaped, with a body consisting of N-terminal regions of Spc97p and Spc98p. The C-terminal regions of Spc97p and Spc98p form the base of each arm of the Y, and Tub4p forms part of a lobe at the end of each arm. Limited rotation of one of the arms results in several slightly different conformations of γ-TuSC, with varying distances between the Tub4ps. Notably, none of the observed distances between the Tub4ps is consistent with the interprotofilament spacing of the microtubule lattice, providing at least one explanation for the poor nucleating ability of isolated γ-TuSC. We propose that further rotation of the one mobile arm is required to bring Tub4p into a nucleation-competent conformation.
MATERIALS AND METHODS
γ-TuSC Expression and Purification
The yeast γ-TuSC components were expressed in Sf9 cells and purified as described previously (Vinh et al., 2002). The three γ-TuSC components—Tub4p, Spc97p, and Spc98p—were coexpressed with glutathione transferase (GST)-Spc110p1–220, which binds γ-TuSC and allows the complex to be purified by glutathione affinity. GST-Spc1101–220 was separated from γ-TuSC by anion exchange on a MonoQ column. Purified γ-TuSC was dialyzed into HB250 (40 mM HEPES, pH 7.5, 1 mM MgCl2, 1 mM EGTA, 1 mM dithiothreitol, 100 μM guanosine diphosphate [GDP], and 100 mM KCl), concentrated to 1–5 mg/ml, and 10% glycerol was added before freezing and storage at −80°C. A baculovirus construct of Tub4p with an N-terminal 6xHis tag and tobacco etch virus cleavage site was also generated. His-tagged γ-TuSC was expressed and purified as described above for the untagged complex.
For electron microscopy (EM) experiments, purified γ-TuSC was diluted in HB250. In experiments to examine possible structural effects of nucleotide state, γ-TuSC was diluted in HB250 with 1 mM guanosine 5′-O-(3-thio) triphosphate (GTPγS) (a nonhydrolyzable guanosine triphosphate [GTP] analog) instead of GDP.
Electron Microscopy
Samples were prepared on Quantifoil S7/2 copper grids coated with 30- to 40-Å carbon film. The grids were glow-discharged, and 4 μl of 50–100 nM γ-TuSC was applied. After 30 s, excess sample was wicked away, the grids were washed three times by touching to a water droplet, and then they were stained three times by touching to a droplet of 0.75% uranyl acetate (Ohi et al., 2004). Excess stain was removed by vacuum aspiration, and the samples left to air dry.
Pairs of tilted and untilted micrographs were acquired using the conical tilt software of the UCSF tomography package (Zheng et al., 2007a,b) on a Tecnai T20 electron microscope (FEI Company, Netherlands) operating at 120 kV. Images of the sample tilted at 60° were acquired first, followed by an overlapping montage of 0° images, with a cumulative dose of 50–100 e−/Å2. The micrographs were recorded on a Gatan 4k × 4k (Gatan, Inc., Pleasanton, CA) camera at 50,000× magnification, with a pixel size of 2.2 Å. Both untilted and tilted micrographs were taken at 1.8-μm defocus.
Image Processing and Three-dimensional Reconstruction
All image processing was performed using the SPIDER package, and its graphical interface WEB (Frank et al., 1996), unless otherwise noted. Pairs of tilted and untilted views were identified in the micrographs, and the tilt axis orientation and tilt angle were determined from the particle locations. Particles were boxed out in 160 × 160 pixel boxes, normalized, zero-padded to 240 × 240 pixels, and binned twofold to yield 120 × 120 pixel images with 4.4 Å per pixel. Particles were then centered by correlation with a low-pass–filtered disk.
Untilted particles were subjected to reference-free alignment, and the aligned images were classified by principal component analysis (PCA) and hierarchical clustering. The resulting class averages were used as initial references for several rounds of iterative supervised classification to improve the particle alignments. This process was repeated after further clustering within the initial classes.
Random conical tilt reconstructions were performed on each of the final classes. Euler angles were assigned to each tilted particle by combining the tilt axis orientation (ψ) and tilt angle (θ) with the in-plane rotation of the corresponding untilted particle determined during classification and alignment (φ). An initial volume was calculated by back-projection by using the assigned angles. Image shifts were iteratively refined by aligning each tilted particle to the corresponding projection of the volume, and then recalculating the volume using appropriately shifted images.
The resolution of each volume was calculated from the Fourier shell correlation (FSC) between two volumes, each generated from half the data set (Saxton and Baumeister, 1982). The resolution was taken to be the spatial frequency at which the FSC drops below 0.5 (Bottcher et al., 1997).
The final volumes were low-pass filtered at the resolution of the model, and high-pass filtered at 250 Å with a Gaussian filter. The final volumes were then scaled so that a contour level of 1.0 corresponded to 300 kDa (the expected molecular mass of γ-TuSC) using EMAN (Ludtke et al., 1999). UCSF Chimera (Pettersen et al., 2004) was used to visualize and segment the maps, align maps, and for manual fitting of the γ-tubulin crystal structure. Average maps were generated from aligned segments, weighted for the size of each class.
Gold Labeling
γ-TuSC with an N-terminal 6xHis tag on Tub4p was labeled with nickel-nitrilotriacetic acid (Ni2+-NTA) Nanogold (Nanoprobes, Stony Brook, NY) (Hainfeld et al., 1999). Then, 100 nM γ-TuSC was incubated in HB250 plus 250 nM gold label overnight at 4°C. Samples were prepared for EM, and micrographs were taken as described above, except that images were acquired at 1.2-μm defocus to enhance the contrast between gold and the uranyl formate stain. Particles were boxed out with the EMAN program boxer and classified in SPIDER by reference-free alignment followed by PCA and hierarchical clustering to separate labeled from unlabeled particles.
Fluorescence Resonance Energy Transfer (FRET)
Yeast strains with γ-TuSC components tagged with cyan fluorescent protein (CFP) and yellow fluorescent protein (YFP) were grown and imaged as described in Muller et al. (2005). Approximately 100 images were captured of each strain. The 12-bit images were converted into 16-bit Tiff format by the Java program R3DConverter (Ess, Riffle, and Muller, unpublished). The Tiff images were then analyzed by a custom Matlab program, FretSCal, that selects regions of the image to evaluate based on user-defined criteria, such as local signal strength and decay (Ess, Riffle, and Muller, unpublished). FRET was measured by fluorescence microscopy using the FRETR index, which measures the -fold increase of fluorescence intensity in the FRET channel over a baseline determined from the fluorescence in the CFP and YFP channels (Muller et al., 2005). In the absence of energy transfer, the predicted value of FRETR is 1. The observed standard deviations from the means were ∼10% (Table 1). Using a 0.01 α test for the Tukey–Kramer analysis, mean FRETR values >1.2 were significant (Muller et al., 2005). The Tukey–Kramer analysis was performed with JMP Statistical Discovery software (SAS Institute, Cary, NC).
Table 1.
Relative positions of γ -TuSC components examined by FRET
| Tagged proteins | FRETR | SD | n | Strain | |
|---|---|---|---|---|---|
| Tub4p interactions | |||||
| N:Tub4 | N:Spc97 | 1.06 | 0.12 | 194 | BFY114-1B |
| *N:Tub4 | C:Spc97 | 1.3 | 0.09 | 68 | BFY90-2A |
| C:Tub4 | C:Tub4 | 1.17 | 0.08 | 101 | BFY67 |
| C:Tub4 | N:Spc97 | 1.04 | 0.05 | 122 | BFY106-1C |
| *C:Tub4 | C:Spc97 | 1.58 | 0.11 | 171 | BFY69-8B |
| *C:Tub4 | C:Spc97 | 1.4 | 0.11 | 143 | BFY68-4C |
| C:Tub4 | N:Spc98 | 1.11 | 0.08 | 72 | BFY98-4A |
| C:Tub4 | N:Spc98 | 1.02 | 0.08 | 134 | BFY105-22B |
| *C:Tub4 | N:Spc110 | 1.34 | 0.08 | 109 | BFY109-2A |
| *C:Tub4 | N:Spc110 | 1.25 | 0.08 | 118 | BFY96-1B |
| Spc97p interactions | |||||
| N:Spc97 | N:Tub4 | 1.06 | 0.12 | 194 | BFY114-1B |
| N:Spc97 | C:Tub4 | 1.04 | 0.05 | 122 | BFY106-1C |
| *N:Spc97 | N:Spc98 | 1.41 | 0.11 | 77 | BFY101-7B |
| N-Spc97 | N:Spc110 | 1.17 | 0.08 | 286 | BFY107-2D |
| N:Spc97 | N:Spc110 | 1.14 | 0.12 | 90 | BFY112-9C |
| *C:Spc97 | N:Tub4 | 1.3 | 0.09 | 68 | BFY90-2A |
| *C:Spc97 | C:Tub4 | 1.58 | 0.11 | 171 | BFY69-8B |
| *C:Spc97 | C:Tub4 | 1.4 | 0.11 | 143 | BFY68-4C |
| C:Spc97 | C:Spc97 | 1.01 | 0.08 | 96 | BFY66 |
| C:Spc97 | N:Spc98 | 1.1 | 0.1 | 129 | BFY91-9A |
| *C:Spc97 | C:Spc98 | 1.33 | 0.12 | 84 | BFY83-11C |
| *C:Spc97 | C:Spc98 | 1.26 | 0.12 | 50 | BFY84-1A |
| *C:Spc97 | N:Spc110 | 1.3 | 0.08 | 75 | BFY108-4C |
| *C:Spc97 | N:Spc110 | 1.25 | 0.08 | 149 | BFY94-5C |
| Spc98p interactions | |||||
| N:Spc98 | C:Tub4 | 1.11 | 0.08 | 72 | BFY98-4A |
| N:Spc98 | C:Tub4 | 1.02 | 0.08 | 134 | BFY105-22B |
| *N:Spc98 | N:Spc97 | 1.41 | 0.11 | 77 | BFY101-17B |
| N:Spc98 | C:Spc97 | 1.1 | 0.1 | 129 | BFY91-9A |
| N:Spc98 | N:Spc110 | 1.13 | 0.08 | 116 | BFY92-7B |
| N:Spc98 | N:Spc110 | 1.14 | 0.08 | 161 | BFY115-1B |
| *C:Spc98 | C:Spc97 | 1.26 | 0.12 | 50 | BFY84-1A |
| *C:Spc98 | C:Spc97 | 1.33 | 0.12 | 84 | BFY83-11C |
| *C:Spc98 | N:Spc110 | 1.28 | 0.09 | 112 | BFY93-9A |
| Spc110p interactions | |||||
| *N:Spc110 | C:Tub4 | 1.34 | 0.08 | 109 | BFY109-2A |
| *N:Spc110 | C:Tub4 | 1.25 | 0.08 | 118 | BFY96-1B |
| N:Spc110 | N:Spc97 | 1.14 | 0.12 | 90 | BFY112-9C |
| N:Spc110 | N-Spc97 | 1.17 | 0.08 | 286 | BFY107-2D |
| *N:Spc110 | C:Spc97 | 1.3 | 0.08 | 75 | BFY108-4C |
| *N:Spc110 | C:Spc97 | 1.25 | 0.08 | 149 | BFY94-5C |
| N:Spc110 | N:Spc98 | 1.14 | 0.08 | 161 | BFY115-1B |
| N:Spc110 | N:Spc98 | 1.13 | 0.08 | 116 | BFY92-7B |
| *N:Spc110 | C:Spc98 | 1.28 | 0.09 | 112 | BFY93-9A |
| *N:Spc110 | N:Spc110 | 1.2 | 0.07 | 72 | BFY113 |
N: and C: indicate that the protein was tagged at the N or C terminus, respectively. Bold type indicates a CFP-tagged donor, and italic type indicates a YFP-tagged acceptor. Rows marked with an asterisk (*) rows indicate interactions with FRETR values determined to be significant using the 0.01 α test for the Tukey–Kramer analysis.
Many combinations of tagged Spc98 with tagged Tub4 were lethal or nearly so. Spc98-YFP combined with Tub4-CFP was lethal, and Spc98-YFP combined with CFP-Tub4 produced cells that grew too poorly to image. Heterozygous diploids with Spc98-CFP combined with YFP tags on either end of Tub4 were not successfully made. Cells with YFP-Spc98 and CFP-Tub4 grew too poorly to image. A heterozygous diploid with the tags switched (CFP-Spc98 and YFP-Tub4) could not be isolated.
Construction of a few other combinations was also unsuccessful. Diploids with N-terminally tagged Tub4 combined with C-terminally tagged Tub4 could only be isolated with an extra copy of untagged Tub4. A heterozygous diploid with YFP-Spc97 and Spc98-CFP did not sporulate. A heterozygous diploid with tags switched (CFP-Spc97, Spc98-YFP) was not made. A heterozygous diploid with CFP-Tub4 and YFP-Spc110 produced very few viable progeny. A heterozygous diploid with these tags switched (YFP-Tub4 and CFP-Spc110) could not be isolated.
Finally, several tagged proteins were viable in a haploid but not in a homozygous diploid. The combination of CFP-Tub4 and YFP-Tub4 was lethal in a diploid. A diploid with both copies of Spc98 tagged on the C terminus (Spc98-CFP and Spc98-YFP) could not be isolated. The diploid with both copies of Spc98 tagged on the N terminus (CFP-Spc98 and YFP-Spc98) did not sporulate.
RESULTS
Electron Microscopy and Particle Classification
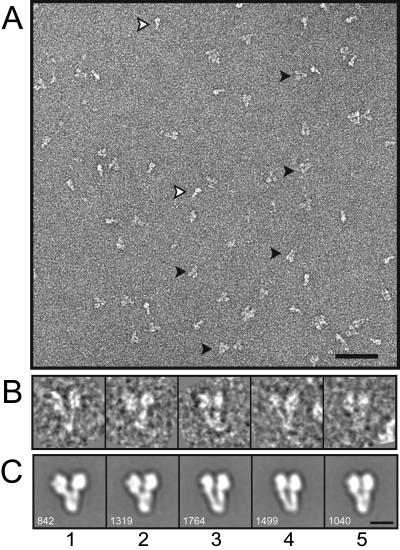
Negatively stained samples of yeast γ-TuSC adopted a preferred orientation on carbon grids, resulting in characteristic Y-shaped projections (Figure 1A, filled arrowheads). The particles are roughly 120 Å wide at the tips of the Y, tapering to 40 Å at the narrow end, and 160 Å long (Figure 1B). A smaller number of side views of the complex were also seen, which are the same length as the predominant Y-shaped view, but only half the width (Figure 1A, empty arrowheads). Random conical tilt (RCT) reconstruction is the method of choice for three-dimensional reconstructions of particles with a limited number of orientations on the grid (Radermacher et al., 1986). RCT makes use of tilted and untilted views of each particle, allowing very accurate determination of its orientation. An additional advantage of RCT is that the untilted particle images can be classified to ensure homogeneous data sets for reconstruction. We acquired 163 micrograph pairs by using the automated conical tilt software of the UCSF Tomo package (Zheng et al., 2007a,b), and 6464 individual particles were picked from the micrograph pairs.
Figure 1.
Negative stain images of γ-TuSC. (A) Section of an untilted micrograph. Y-shaped views (filled arrowheads) predominate, but most images also included i-shaped side views (empty arrowheads). Only Y-shaped views were selected for reconstruction. Bar, 50 nm. (B) Individual untilted particles from the reconstruction data set. (C) Averages of aligned and classified particles, with the indicated number of particles in each class average. Bar, 10 nm (B and C).
An initial reference-free alignment of all of the untilted particles produced a clear average with the expected Y shape. However, the variance map of the aligned particles had strong peaks in the regions around the ends of the arms, indicating heterogeneity in the data set. The globally aligned data set was separated into more homogeneous classes by using PCA and hierarchical clustering. The first round of clustering yielded two distinct classes; the primary difference between the two was the branching angle between the two arms. The alignments were improved using the two class averages as references for several rounds of iterative supervised classification of the entire data set. Further PCA and hierarchical clustering within each of the two reference-based classes resulted in five unique classes, which were used as references for several more rounds of iterative supervised classification. The homogeneity of the classes was evaluated throughout the procedure by inspection of variance maps of the class averages. Further subdivision within each of the five final classes did not yield averages with any appreciable differences, another indication of homogeneity. The five class averages seem to be closely related, and differ primarily in the angle between the two arms of the Y, and in the partial bifurcation of the body in classes 3 and 4 (Figure 1C).
Random Conical Tilt Reconstructions
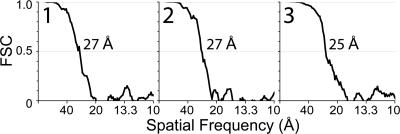
Three-dimensional density maps were generated for each of the five particle classes. Preliminary orientations for each particle were assigned by combining the data collection tilt geometry with the in-plane rotation determined by alignment of the untilted images. An initial volume was generated by back-projection of the particles, and translational shifts were iteratively refined by cross-correlation of each particle with its corresponding projection. The reconstructions have resolutions of 25–27 Å as measured by the Fourier shell correlation by using the 0.5 cutoff criterion (Figure 2).
Figure 2.
FSC resolution measurements of the RCT reconstructions in Figure 3. The resolution of the reconstructions is taken as the spatial frequency at which the FSC drops below 0.5.
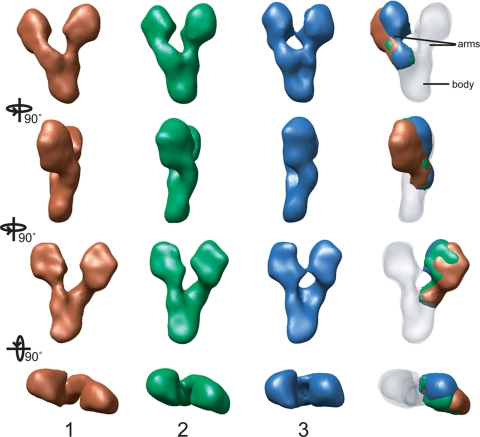
Each of the structures is roughly Y-shaped (Figure 3). The body of the Y is a rough hexahedron 70 Å long × 40 Å wide × 30 Å deep. Each of the arms is ∼100 Å long, and consists of a narrow (roughly 20 Å) constriction near the branch point, and two terminal bulbous lobes roughly 40 Å wide and 60 Å long. The two arms are asymmetric, with one lying flat against the carbon support film and the other arching slightly near the branch point. The branching angle between the arms varies from ∼35° in classes 3, 4, and 5, to 45° in class 2 and 50° in class 1. The branching angle variation leads to differences in the center-to-center distance between the two terminal lobes: 85 Å in class 1, 75 Å in class 2, and 70 Å in classes 3, 4, and 5.
Figure 3.
Three-dimensional reconstructions of γ-TuSC. Volumes were generated with tilted particles corresponding to classes 1, 2, and 3 in Figure 1C. Four orthogonal views of each particle are shown, and the rotations between the views are indicated at left. The aligned structures are superimposed at right, with the constant region used for the alignment rendered semitransparent. The arm on the left in the top view adopts different orientations in the three structures, and it is rotated relative to the arm in class 3 by 8° in class 2 and by 15° in class 1.
Classes 3, 4, and 5, which account for two thirds of the particles, have essentially identical structures related by rotations about the long axis of the molecule, presumably due to small differences in how the particles lay down on the grid. A rotation of 10° brings volume 4 into alignment with volume 3, whereas a rotation of −10° brings volume 5 into alignment with volume 3 (Supplemental Figure S1). It is likely that the particles actually adopt a continuum of orientations, and the classification into these three groups represents the finest division possible at this resolution.
Volumes 1 and 2 are distinguished by rotation of the arched arm away from the other (Figure 3). Rotation around the long axis of these structures—by 10° for volume 2 and 15° for volume 1—brings the body and the fixed arm into alignment with volume 3. When the densities are superimposed, it is clear that rotations about the base of the mobile arm relate the three structures (Figure 3, right-hand column). Relative to volume 3, the mobile arm is rotated 8° in volume 2 and 15° in volume 1. Again, it is likely that the three calculated structures represent points along a continuum, and subdivision into a larger number of classes is limited by the resolution of the images.
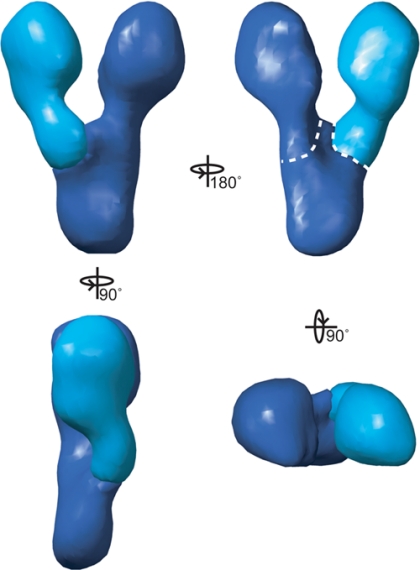
To calculate an average structure, each of the five volumes was segmented into two parts: the mobile arm, and the body and fixed arm (Figure 4). The corresponding segments from each structure were aligned to the segments of volume 3. An average was then calculated for each segment, weighted for the size of the corresponding classes. The approximate mass of each part of the structure is 115 kDa for each arm and 70 kDa for the body. The position of the mobile arm can be altered to generate the states observed in the different reconstructions.
Figure 4.
Average γ-TuSC map. Each of the reconstructed volumes was segmented into the constant region and the mobile arm, as indicated in Figure 3. An average was calculated for each segment, weighted for class size. In this view, the two average maps are aligned to the corresponding segments of structure 3. The dotted white lines indicate the boundaries used for calculating the approximate volumes of the three segments of the map—115 kDa for each arm and 70 kDa for the body.
Effect of Nucleotide State
γ-Tubulin binds GTP and GDP with affinities similar to those for the exchangeable site of β-tubulin (Aldaz et al., 2005). We investigated the possibility that the nucleotide state of Tub4p may alter the conformation of γ-TuSC. Images of 2321 particles of γ-TuSC incubated with 1 mM GTPγS, a nonhydrolyzable GTP analog, were acquired with the conical tilt data setup. There were no obvious differences between the two-dimensional averages of GDP- and GTPγS–γ-TuSC, and the class distribution was similar with either nucleotide. The three-dimensional structures are also very similar, as measured by FSC. We conclude that nucleotide state does not induce any large-scale conformational changes in γ-TuSC. This result is not surprising, in light of crystal structures of human γ-tubulin with nearly identical conformations with either nucleotide bound (Aldaz et al., 2005; Rice, Montabana, and Agard, personal communication).
Position of Tub4p Determined by Gold Labeling
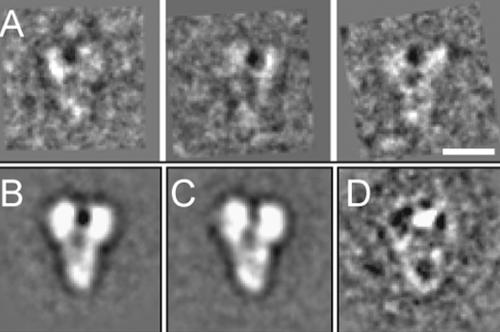
To determine the location of Tub4p within γ-TuSC, complexes with N-terminally His-tagged Tub4p were labeled with Ni2+-NTA-Nanogold, and a data set of 612 particles was collected. The presence of gold label in a fraction of the data set was immediately obvious from a variance map of the aligned images. PCA and clustering of the aligned images yielded a class of 68 labeled particles (Figure 5A). The class average of labeled γ-TuSC clearly shows the 18-Å nanogold particle bound between the two bulbous lobes at the end of each arm (Figure 5B). The location of the gold label was confirmed by a difference map calculated between labeled and unlabeled particles, with a 9.3σ peak at the location of the gold particle (Figure 5D). The presence of a single gold label (rather than the 2 that might be expected for labeling of each Tub4p subunit) is explained by both of the His-tags in the complex binding the same multivalent Ni2+-NTA-Nanogold. In keeping with this explanation, it proved impossible to subclassify the labeled particles into the different classes found in the unlabeled data set (Figure 1, classes 1, 2, and 3), likely due to the label constraining the distance between the two heads.
Figure 5.
Labeling of the Tub4p N-terminus. (A) Individual particles of γ-TuSC with an N-terminal 6xHis-tag on Tub4p incubated with Ni2+-Nanogold. (B) Average of 68 labeled particles. (C) Average of 68 unlabeled particles. (D) Difference map generated by subtracting the labeled average from the unlabeled average. The prominent peak corresponding to the location of the gold label is 9.3σ above the mean. Bar, 10 nm.
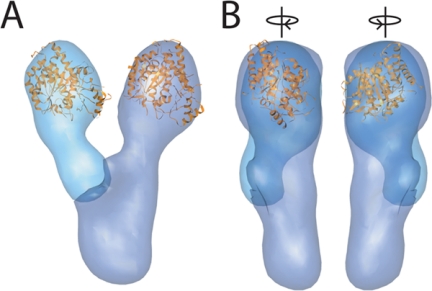
Based on the gold localization, we manually docked the crystal structure of γ-tubulin, the human Tub4p orthologue, into the average EM density (Figure 6). The size and shape of the arm density allows an excellent fit of the crystal structure, which accounts for roughly two third of the density of the terminal lobes.
Figure 6.
Docking γ-tubulin in the average γ-TuSC structure. (A) The crystal structure of γ-tubulin (gold), the human Tub4p homologue, was manually fit into the lobes at the ends of the arms. (B) Side views, rotated 90° relative to A in the directions indicated by the arrows.
Relative Orientations of Spc97p and Spc98p N and C Termini Determined by FRET
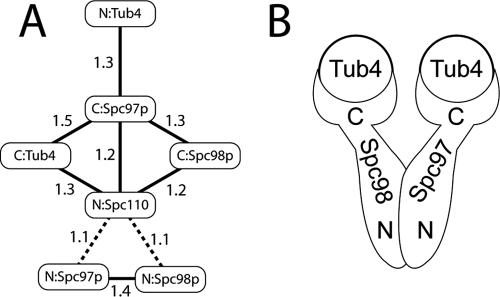
The relative positions of the γ-TuSC components were examined by FRET, with various combinations of CFP- and YFP-tagged proteins used as donors and acceptors (Table 1). FRET was measured in vivo, and in all cases cell viability depended on the tagged proteins being functional. The FRET interactions are summarized in Figure 7A. In the absence of energy transfer, the predicted value of FRETR is 1, and statistical analysis of the γ-TuSC data (see Materials and Methods; Muller et al., 2005) shows that values greater than 1.2 are significant. Although the linkers and large size of the fluorescent protein tags make it difficult to convert the FRETR signals into absolute distances, for our purposes it is sufficient to correlate stronger FRETR with shorter distances.
Figure 7.
FRET relationships and the overall architecture of γ-TuSC. (A) The average FRETR values for the CFP- and YFP-tagged proteins presented in Table 1. The lines connect the protein pairs that showed significant FRET, and they are not meant to correspond to distances. The dotted lines indicate that the 1.1 FRETR value is just at the limit of detection, and it is considered tentative. (B) The arrangement of Tub4p, Spc97p, and Spc98p within γ-TuSC. The N-terminal regions of Spc97p and Spc98p constitute a dimerization interface in the body, whereas C-terminal regions form the bases of the arms and bind Tub4p.
The FRET measurements indicate that the C termini of Spc97p and Spc98p are in proximity to each other, and that the C terminus of Spc97p is near both termini of Tub4p. Despite the homology of Spc97p and Spc98p, the C terminus of Spc98p could not tolerate a fluorescent protein tag when Tub4p was also tagged at either terminus. Whether this synthetic lethality is due to a significant structural difference between Spc97p and Spc98p is unclear; however, it is consistent with the asymmetry seen in the EM density. Both the observed FRET and the synthetic lethality imply that Tub4p interacts with the C-terminal regions of Spc97p and Spc98p.
Significant FRET values are also observed between the N-terminally tagged Spc97p and Spc98p, suggesting that the N termini of these two proteins are near each other. The lack of FRET between N-terminally tagged Spc97p and Spc98p and any of the other termini in γ-TuSC suggests that the N-terminal regions of Spc97p and Spc98p are distal to the Tub4p heads. Although these results may be complicated by intermolecular FRET, the simplest interpretation would pair Spc97p and Spc98p with their N termini toward the base of the Y, and their C termini interacting with Tub4p in the arm regions (Figure 7B).
We were also interested in determining which regions of γ-TuSC are involved in binding Spc110p, which anchors γ-TuSC to the SPB via interactions with its N-terminal domain (Knop and Schiebel, 1997; Sundberg and Davis, 1997). N-terminally tagged Spc110p showed significant FRET with the C-termini of all three γ-TuSC components. Although N-terminally tagged Spc97p and Spc98p were significantly different from baseline by Tukey–Kramer statistical analysis, we label these interactions as tentative on the basis of their standard deviations (Table 1). The N-terminal Spc110p FRET values suggest that it binds γ-TuSC near the branch point connecting the two arms to the body.
DISCUSSION
γ-TuSC is the core complex used by all eukaryotes for microtubule nucleation. We have combined the use of three-dimensional single particle EM and in vivo FRET measurements to determine the overall structure of the complex, the position of Tub4p (the yeast γ-tubulin) within the complex, and the relative orientations of Spc97p and Spc98p. Three-dimensional reconstructions of several distinct subpopulations of γ-TuSC particles revealed a striking degree of flexibility in the complex, resulting in different orientations of Tub4p.
γ-TuSC Architecture
The γ-TuSC structure is roughly Y-shaped, consisting of two similar arms of ∼115 kDa each, and a body of ∼70 kDa (Figures 3 and 4). Gold labeling of Tub4p localizes it within the bulbous lobes at the ends of the two arms (Figure 5), and the crystal structure of γ-tubulin fits well into the corresponding density (Figure 6). FRET analysis shows that the N termini of Spc97p and Spc98p are near each other, but not to their C termini nor to Tub4p. The C termini of Spc97p and Spc98p and both termini of Tub4p all show significant levels of FRET, indicating that they are near each other (Table 1; Figure 7A). Synthesis of the EM structure, gold labeling, and FRET data result in the architecture of γ-TuSC presented in Figure 7B. The N-terminal portions of Spc97p and Spc98p form an elongated dimerization domain of ∼35 kDa each, which together comprise the body of γ-TuSC. The roughly 60-kDa C-terminal portions of Spc97p and Spc98p at the base of each arm constitute the Tub4p-binding regions. This arrangement is consistent with the results of previous studies that examined interactions between γ-TuSC components by using yeast-two-hybrid assays and mutant analyses (Geissler et al., 1996; Knop et al., 1997; Nguyen et al., 1998).
There are two conserved motifs, grip1 and grip2, in the C-terminal half of Spc97p and Spc98p and their orthologues, and most of the γ-TuRC–specific proteins. It has been suggested that these motifs may constitute γ-tubulin binding domains (Gunawardane et al., 2000), which is consistent with our proposed architecture. However, we cannot rule out the possibility that these motifs interact with each other to mediate assembly into larger structures or that they serve as binding sites for localization of γ-TuSC and γ-TuRC to microtubule-organizing centers.
Flexibility in the γ-TuSC Structure
One of the advantages of the random conical tilt method of single particle reconstruction is that it provides a very robust and unbiased way to classify the data into homogeneous sets of particles. The γ-TuSC particles fall into five unique classes (Figure 1C). Heterogeneity in the data set can arise from two sources: different orientations of the particles relative to the carbon support, and structural heterogeneity. The differences among classes 3, 4, and 5 seem to arise from slightly different orientations; the three-dimensional reconstructions of these classes are nearly identical, and they are related to each other by rotations of about ±10° (Supplemental Figure S1).
In contrast, the reconstructions of classes 1 and 2 are unique, and they represent altered conformations. The heterogeneity seems to result from a swinging motion of the one mobile arm about a pivot point at its base, rotating 15° in class 1 and 8° in class 2 relative to the configuration in class 3 (Figure 3). The structure was therefore treated as two rigid bodies—the mobile arm, and the fixed arm and body—which were dissected from each of the five maps and independently aligned and averaged (Figure 4). The two average maps can be used to recreate each of the observed configurations by rotation of the mobile arm; the configuration observed in structures 3, 4, and 5 is presented in Figure 4. The flexible attachment of the mobile arm results in variation of the center-to-center distances between the Tub4p lobes: from 85 Å in class 1, 75 Å in class 2, and 70 Å in classes 3, 4, and 5.
Implications of the γ-TuSC Structure for Microtubule Nucleation
In the microtubule, α/β-tubulin makes two kinds of contacts: longitudinal interactions running the length of the microtubule, and lateral contacts running around the circumference. The structural similarity of γ-tubulin to α/β-tubulin argues strongly that γ-tubulins interact with one another via microtubule lattice-like contacts. Indeed, the two models that have been proposed for the mechanism of microtubule nucleation suggest that γ-tubulin acts as an extension of the lattice, but differ in the contacts they predict it makes with α/β-tubulin. The template model proposes that γ-tubulin self-associates laterally and makes longitudinal contacts with α/β-tubulin, whereas the protofilament model requires longitudinal γ-γ contacts and lateral contacts with α/β-tubulin. In the microtubule lattice, the center-to-center distance between tubulins is 53 Å for lateral interactions and 40 Å for longitudinal interactions. Both of these distances are much smaller than the minimum 70 Å distance observed between the Tub4p densities in our structures; in none of the observed structures is Tub4p in a configuration compatible with either of the microtubule lattice-like interactions (Supplemental Figure S2A).
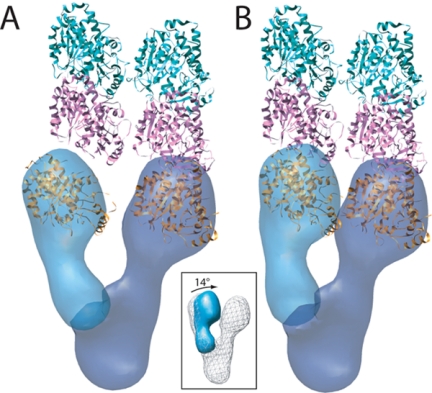
We propose that a conformational change, beyond the inherent flexibility observed in our structures, is required to bring Tub4p into a nucleation-competent configuration compatible with the microtubule lattice. A simple rotation of the mobile arm by 14° relative to its orientation in structure 3 is sufficient to bring the centers of the Tub4p densities to the 53-Å distance required for microtubule-like lateral contacts (Figure 8). Although the necessity of such a conformational change is evident from the observed EM density alone, the modeled change also allows a remarkably good fit of crystal structures of laterally interacting γ-tubulins (Figure 8B). Further rotation of the mobile arm could, in principle, bring the Tub4p densities to 40 Å, as required for longitudinal contacts between γ-tubulins. However, such a motion would result in the significant overlap of the head densities (Supplemental Figure S2B), making such a conformation highly unlikely. Thus, by extension, the size and shape of the observed γ-TuSC density argue against the protofilament model of nucleation.
Figure 8.
Model of the conformational changes required to bring Tub4p into a nucleation-competent orientation consistent with the interprotofilament spacing of the microtubule. (A) Two tubulin dimers (pink, α-tubulin; green, β-tubulin) making lateral contacts, and the average γ-TuSC map with the smallest observed distance between the arms are shown. The Tub4p density on the right is aligned at the base of one protofilament, but the separation of the two arms precludes the possibility of both Tub4p densities making protofilament-like contacts simultaneously. (B) A rotation of 14° about the base of the mobile arm (inset) brings the two Tub4p densities into orientations compatible with the microtubule lattice. As a result of this modeled conformation, two γ-tubulin crystal structures making microtubule-like lateral contacts fit remarkably well into the density. The crystal structures were manually fit in the density in B, and this fit was extrapolated in A.
The additional arm movement required to bring γ-TuSC into a nucleation-competent state is similar in magnitude and direction to the variation in the observed structures. However, this seems to be well beyond the range of naturally occurring variation. Using classification methods, each of the observed particles was examined and none was found to have arms significantly closer together than the arms in class 3. This suggests that the structure of the complex actively resists bringing the two Tub4p heads into close apposition, likely serving as an important mechanism for down regulating the activity of isolated γ-TuSC, which is a much worse in vitro nucleator than γ-TuRC (Oegema et al., 1999; Vinh et al., 2002) or purified γ-tubulin (Moritz and Agard, personal communication).
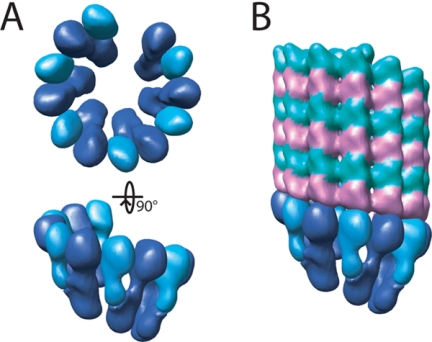
An important consequence of our model is that bringing the two arms of γ-TuSC together positions the density so that the docked γ-tubulins can form lateral interactions both within the complex and between adjacent complexes, with no overlap of density between neighboring γ-TuSCs (Figure 9A). This leads to a model of a higher order oligomer, analogous to the γ-TuRC found in most other eukaryotes, which would be a potent microtubule nucleator (Figure 9B). There is some evidence that γ-TuSC forms larger complexes in yeast (Vinh et al., 2002), and yeast microtubules are capped in vivo in much the same way as microtubules nucleated in vitro by γ-TuRC (Byers et al., 1978; Zheng et al., 1995), although we should note the possibility that the assembly of γ-TuSC into higher order structures may differ between yeast and organisms with the full complement of γ-TuRC subunits. One intriguing question arising from this model is whether the oligomerization of γ-TuSC involves contacts between γ-tubulins alone, or whether Spc97p and Spc98p also play a role in the association.
Figure 9.
Model for the oligomerization of γ-TuSC. (A) Multiple γ-TuSCs with γ- and α/β-tubulin docked as in Figure 7B were aligned with the minus end of a microtubule to indicate a possible arrangement of a higher order, γ-TuRC-like structure that would be competent for microtubule nucleation. (B) The γ-TuSC assembly from A shown making longitudinal contacts with the minus end of a microtubule.
The requirement of a structural rearrangement for nucleating activity by γ-TuSC has a parallel in the nucleation of actin filaments, the other major cytoskeletal element. In the crystal structure of the Arp2/3 branch nucleating complex the actin homologues Arp2 and Arp3 are held in an inactive conformation (Robinson et al., 2001). EM analyses have shown that binding of nucleation-promoting factors induces a large conformational change, bringing Arp2 and Arp3 together to make filament-like contacts with actin (Volkmann et al., 2001; Rodal et al., 2005). Similarly, the activation of γ-TuSCs could require known γTuSC binding proteins such as Spc110p and Spc72p, or as yet unidentified factors. Alternatively, it is possible that either posttranslational modifications or simply the close packing of γ-TuSCs within the SPB or the γ-TuRC may be sufficient to induce the required conformational change and subsequent activation.
Supplementary Material
ACKNOWLEDGMENTS
We are grateful to Shawn Zheng and Michael Braunfeld for assistance with electron microscopy and to Koji Yonekura for help with three-dimensional alignments. This work was supported by National Institutes of Health grants R01 GM-31627 (to D.A.A.), F32 GM-078790 (to J.M.K.), and R01 GM-040506 and P41 RR-011823 (to T.N.D.) and the Howard Hughes Medical Institute.
Abbreviations used:
- γ-TuRC
γ-tubulin ring complex
- γ-TuSC
γ-tubulin small complex
- FRET
fluorescent resonance energy transfer
- SPB
spindle pole body.
Footnotes
This article was published online ahead of print in MBC in Press (http://www.molbiolcell.org/cgi/doi/10.1091/mbc.E07-09-0879) on October 31, 2007.
REFERENCES
- Aldaz H., Rice L. M., Stearns T., Agard D. A. Insights into microtubule nucleation from the crystal structure of human gamma-tubulin. Nature. 2005;435:523–527. doi: 10.1038/nature03586. [DOI] [PubMed] [Google Scholar]
- Bottcher B., Wynne S. A., Crowther R. A. Determination of the fold of the core protein of hepatitis B virus by electron cryomicroscopy. Nature. 1997;386:88–91. doi: 10.1038/386088a0. [DOI] [PubMed] [Google Scholar]
- Byers B., Shriver K., Goetsch L. The role of spindle pole bodies and modified microtubule ends in the initiation of microtubule assembly in Saccharomyces cerevisiae. J. Cell Sci. 1978;30:331–352. doi: 10.1242/jcs.30.1.331. [DOI] [PubMed] [Google Scholar]
- Erickson H. P. Gamma-tubulin nucleation: template or protofilament? Nat. Cell Biol. 2000;2:E93–E96. doi: 10.1038/35014084. [DOI] [PubMed] [Google Scholar]
- Frank J., Radermacher M., Penczek P., Zhu J., Li Y., Ladjadj M., Leith A. SPIDER and WEB: processing and visualization of images in 3D electron microscopy and related fields. J. Struct. Biol. 1996;116:190–199. doi: 10.1006/jsbi.1996.0030. [DOI] [PubMed] [Google Scholar]
- Geissler S., Pereira G., Spang A., Knop M., Soues S., Kilmartin J., Schiebel E. The spindle pole body component Spc98p interacts with the gamma-tubulin-like Tub4p of Saccharomyces cerevisiae at the sites of microtubule attachment. EMBO J. 1996;15:3899–3911. [PMC free article] [PubMed] [Google Scholar]
- Gunawardane R. N., Martin O. C., Cao K., Zhang L., Dej K., Iwamatsu A., Zheng Y. Characterization and reconstitution of Drosophila gamma-tubulin ring complex subunits. J. Cell Biol. 2000;151:1513–1524. doi: 10.1083/jcb.151.7.1513. [DOI] [PMC free article] [PubMed] [Google Scholar]
- Hainfeld J. F., Liu W., Halsey C. M., Freimuth P., Powell R. D. Ni-NTA-gold clusters target His-tagged proteins. J. Struct. Biol. 1999;127:185–198. doi: 10.1006/jsbi.1999.4149. [DOI] [PubMed] [Google Scholar]
- Keating T. J., Borisy G. G. Immunostructural evidence for the template mechanism of microtubule nucleation. Nat. Cell Biol. 2000;2:352–357. doi: 10.1038/35014045. [DOI] [PubMed] [Google Scholar]
- Knop M., Pereira G., Geissler S., Grein K., Schiebel E. The spindle pole body component Spc97p interacts with the gamma-tubulin of Saccharomyces cerevisiae and functions in microtubule organization and spindle pole body duplication. EMBO J. 1997;16:1550–1564. doi: 10.1093/emboj/16.7.1550. [DOI] [PMC free article] [PubMed] [Google Scholar]
- Knop M., Schiebel E. Spc98p and Spc97p of the yeast gamma-tubulin complex mediate binding to the spindle pole body via their interaction with Spc110p. EMBO J. 1997;16:6985–6995. doi: 10.1093/emboj/16.23.6985. [DOI] [PMC free article] [PubMed] [Google Scholar]
- Leguy R., Melki R., Pantaloni D., Carlier M. F. Monomeric gamma-tubulin nucleates microtubules. J. Biol. Chem. 2000;275:21975–21980. doi: 10.1074/jbc.M000688200. [DOI] [PubMed] [Google Scholar]
- Ludtke S. J., Baldwin P. R., Chiu W. EMAN: semiautomated software for high-resolution single-particle reconstructions. J. Struct. Biol. 1999;128:82–97. doi: 10.1006/jsbi.1999.4174. [DOI] [PubMed] [Google Scholar]
- Moritz M., Braunfeld M. B., Guenebaut V., Heuser J., Agard D. A. Structure of the gamma-tubulin ring complex: a template for microtubule nucleation. Nat. Cell Biol. 2000;2:365–370. doi: 10.1038/35014058. [DOI] [PubMed] [Google Scholar]
- Moritz M., Braunfeld M. B., Sedat J. W., Alberts B., Agard D. A. Microtubule nucleation by gamma-tubulin-containing rings in the centrosome. Nature. 1995;378:638–640. doi: 10.1038/378638a0. [DOI] [PubMed] [Google Scholar]
- Muller E. G., et al. The organization of the core proteins of the yeast spindle pole body. Mol. Biol. Cell. 2005;16:3341–3352. doi: 10.1091/mbc.E05-03-0214. [DOI] [PMC free article] [PubMed] [Google Scholar]
- Nguyen T., Vinh D. B., Crawford D. K., Davis T. N. A genetic analysis of interactions with Spc110p reveals distinct functions of Spc97p and Spc98p, components of the yeast gamma-tubulin complex. Mol. Biol. Cell. 1998;9:2201–2216. doi: 10.1091/mbc.9.8.2201. [DOI] [PMC free article] [PubMed] [Google Scholar]
- Oakley B. R., Akkari Y. N. Gamma-tubulin at ten: progress and prospects. Cell Struct. Funct. 1999;24:365–372. doi: 10.1247/csf.24.365. [DOI] [PubMed] [Google Scholar]
- Oakley C. E., Oakley B. R. Identification of gamma-tubulin, a new member of the tubulin superfamily encoded by mipA gene of Aspergillus nidulans. Nature. 1989;338:662–664. doi: 10.1038/338662a0. [DOI] [PubMed] [Google Scholar]
- Oegema K., Wiese C., Martin O. C., Milligan R. A., Iwamatsu A., Mitchison T. J., Zheng Y. Characterization of two related Drosophila gamma-tubulin complexes that differ in their ability to nucleate microtubules. J. Cell Biol. 1999;144:721–733. doi: 10.1083/jcb.144.4.721. [DOI] [PMC free article] [PubMed] [Google Scholar]
- Ohi M., Li Y., Cheng Y., Walz T. Negative staining and image classification—powerful tools in modern electron microscopy. Biol. Proced. Online. 2004;6:23–34. doi: 10.1251/bpo70. [DOI] [PMC free article] [PubMed] [Google Scholar]
- Pettersen E. F., Goddard T. D., Huang C. C., Couch G. S., Greenblatt D. M., Meng E. C., Ferrin T. E. UCSF Chimera–a visualization system for exploratory research and analysis. J. Comput. Chem. 2004;25:1605–1612. doi: 10.1002/jcc.20084. [DOI] [PubMed] [Google Scholar]
- Radermacher M., Wagenknecht T., Verschoor A., Frank J. A new 3-D reconstruction scheme applied to the 50S ribosomal subunit of E. coli. J. Microsc. 1986;141:RP1–RP2. doi: 10.1111/j.1365-2818.1986.tb02693.x. [DOI] [PubMed] [Google Scholar]
- Robinson R. C., Turbedsky K., Kaiser D. A., Marchand J. B., Higgs H. N., Choe S., Pollard T. D. Crystal structure of Arp2/3 complex. Science. 2001;294:1679–1684. doi: 10.1126/science.1066333. [DOI] [PubMed] [Google Scholar]
- Rodal A. A., Sokolova O., Robins D. B., Daugherty K. M., Hippenmeyer S., Riezman H., Grigorieff N., Goode B. L. Conformational changes in the Arp2/3 complex leading to actin nucleation. Nat. Struct. Mol. Biol. 2005;12:26–31. doi: 10.1038/nsmb870. [DOI] [PubMed] [Google Scholar]
- Saxton W. O., Baumeister W. The correlation averaging of a regularly arranged bacterial cell envelope protein. J. Microsc. 1982;127:127–138. doi: 10.1111/j.1365-2818.1982.tb00405.x. [DOI] [PubMed] [Google Scholar]
- Sundberg H. A., Davis T. N. A mutational analysis identifies three functional regions of the spindle pole component Spc110p in Saccharomyces cerevisiae. Mol. Biol. Cell. 1997;8:2575–2590. doi: 10.1091/mbc.8.12.2575. [DOI] [PMC free article] [PubMed] [Google Scholar]
- Vinh D. B., Kern J. W., Hancock W. O., Howard J., Davis T. N. Reconstitution and characterization of budding yeast gamma-tubulin complex. Mol. Biol. Cell. 2002;13:1144–1157. doi: 10.1091/mbc.02-01-0607. [DOI] [PMC free article] [PubMed] [Google Scholar]
- Volkmann N., Amann K. J., Stoilova-McPhie S., Egile C., Winter D. C., Hazelwood L., Heuser J. E., Li R., Pollard T. D., Hanein D. Structure of Arp2/3 complex in its activated state and in actin filament branch junctions. Science. 2001;293:2456–2459. doi: 10.1126/science.1063025. [DOI] [PubMed] [Google Scholar]
- Wiese C., Zheng Y. A new function for the gamma-tubulin ring complex as a microtubule minus-end cap. Nat. Cell Biol. 2000;2:358–364. doi: 10.1038/35014051. [DOI] [PubMed] [Google Scholar]
- Zheng S. Q., Keszthelyi B., Branlund E., Lyle J. M., Braunfeld M. B., Sedat J. W., Agard D. A. UCSF tomography: an integrated software suite for real-time electron microscopic tomographic data collection, alignment, and reconstruction. J. Struct. Biol. 2007a;157:138–147. doi: 10.1016/j.jsb.2006.06.005. [DOI] [PubMed] [Google Scholar]
- Zheng S. Q., Kollman J. M., Braunfeld M. B., Sedat J. W., Agard D. A. Automated acquisition of electron microscopic random conical tilt sets. J. Struct. Biol. 2007b;157:148–155. doi: 10.1016/j.jsb.2006.10.026. [DOI] [PMC free article] [PubMed] [Google Scholar]
- Zheng Y., Wong M. L., Alberts B., Mitchison T. Nucleation of microtubule assembly by a gamma-tubulin-containing ring complex. Nature. 1995;378:578–583. doi: 10.1038/378578a0. [DOI] [PubMed] [Google Scholar]
Associated Data
This section collects any data citations, data availability statements, or supplementary materials included in this article.


