

SUMMARY
An overactive renin angiotensin system is associated with obesity and the metabolic syndrome. However, mechanisms behind it are unclear. Cleaving angiotensinogen to angiotensin I by renin is a rate-limiting step of angiotensin II production, but renin is suggested to have angiotensin-independent effects. We generated mice lacking renin (Ren1c) using embryonic stem cells from C57BL/6 mouse, a strain prone to diet-induced obesity. Ren1c-/- mice are lean, insulin sensitive, and resistant to diet-induced obesity without changes in food intake and physical activity. The lean phenotype is likely due to a higher metabolic rate, and gastrointestinal loss of dietary fat. Most of the metabolic changes in Ren1c-/- mice were reversed by angiotensin II administration. These results support a role for angiotensin II in the pathogenesis of diet-induced obesity and insulin resistance.
INTRODUCTION
The metabolic syndrome is characterized by central obesity, hypertension, dyslipidemia, and impaired glucose tolerance. It increases the risks of coronary artery disease and type 2 diabetes, and is increasingly prevalent (Farmer, 2004). Unifying theories of causality point to primary defects in insulin action. Alternatively, an overactive renin angiotensin system (RAS) has also been implicated in inducing the metabolic syndrome. Clinical trials have demonstrated that pharmacological inhibition of the RAS, using an angiotensin converting enzyme (ACE) inhibitor or a selective angiotensin receptor AT1 blocker (ARB), improves insulin sensitivity and decreases the incidence of type 2 diabetes (Scheen, 2004). Mice lacking angiotensinogen, the renin substrate, are lean and resistant to diet-induced obesity- effects proposed to reflect increased locomotor activity (Massiera et al., 2001).
Renin catalyzes the rate-limiting step of angiotensin II (Ang II) production, but it has the potential for Ang II-independent effects (Nguyen, 2006). We have previously described the generation of mice lacking renin (Ren1c) using embryonic stem cells from C57BL/6 mouse (Takahashi et al., 2005). [C57BL/6 mice, like humans, have only one renin gene, Ren1c (Sigmund and Gross, 1991), and are prone to diet-induced obesity (Surwit, 1988).] As expected, the Ren1c-/- mice have lower blood pressures, and their plasma levels of renin, Ang I, and Ang II were undetectable (Takahashi et al., 2005). Here, we report that mice lacking renin are lean, insulin sensitive, and resistant to diet-induced obesity largely due to lack of Ang II, and that Ang II-independent direct effects of renin on metabolism are minimal.
RESULTS
The Ren1c-/- mice are lean and resistant to diet-induced obesity, but not lipodystrophic
Compared to wildtype (WT) controls the Ren1c-/- mice weighed significantly less, and the difference increased with age (Figure 1A). The difference in body weight became more pronounced on a high fat diet (Table S1 in Supplemental Data, Figure 1B). The weights of the knockouts did not increase with the diet despite their food intake was not lower than that of WT mice (Figures 1B, 1C, Table S1). The nose-to-rump lengths indicate that the general linear body growth of the Ren1c-/- mice was not compromised (Table S1). Their total and percentage body fat masses were nonetheless less than WT, and did not increase by a high fat diet (Figure 1D). The Ren1c-/- mice had less fat mass than WT controls in all adipose tissue depots tested (Table S1), and they had smaller adipocytes than WT mice (Figure 1E). Unlike lipodystrophic mice the Ren1c-/-mice had decreased fat in the liver (Table S1, Figure 1E). Thus, mice lacking renin are lean and resistant to diet-induced obesity, but are not lipodystrophic.
Figure 1. Ren1c-/- mice are lean and resistant to diet-induced obesity, and store less triacylglycerol in adipocytes and liver.
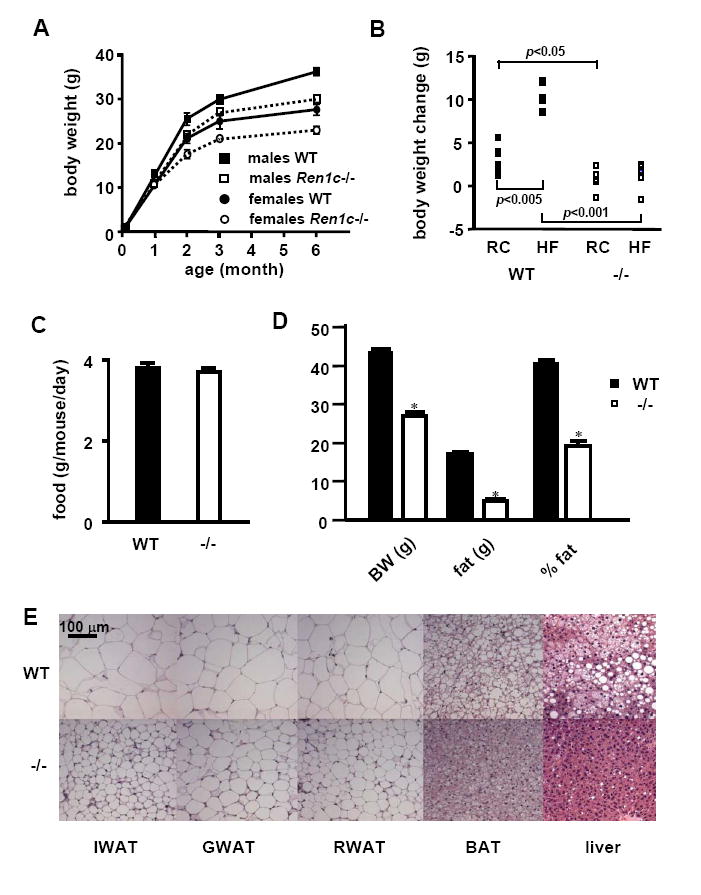
(A) Growth curves of animals on regular chow (RC). WT: wild type. Error bars represent ± SEM in all panels of this figure. (B) Changes in the body weight and (C) food intake of male WT or Ren1c-/- mice induced by 2 month feeding of RC or a high fat diet (HF) starting at 3 months of age. All data are from n=6~9 each group. (D) Body composition and (E) histology of adipose tissues and livers from mice fed a high fat diet for 8 months starting at 2 months old. n≥6. *p<0.0001 compared to WT. IWAT: inguinal white adipose tissue; GWAT: gonadal WAT; RWAT: retroperitoneal WAT; BAT: interscapular brown adipose tissue. Haematoxylin-eosin staining.
Increased basal metabolism in mice lacking renin
Possible mechanisms accounting for the leanness of the Ren1c-/- mice and their resistance to diet-induced obesity include: increased activity-related energy expenditure, increased basal metabolism, and impaired nutrient absorption. To test the differences in energy balance between the Ren1c-/- and WT mice, we fed 3~5 month-old mice a high fat diet for 2 weeks and housed individual mice in Oxymax cages for 5 days. The food consumption and activities of the Ren1c-/- and WT mice were indistinguishable (Figures 2A, 2B). The total and resting oxygen consumption and heat generation of the Ren1c-/- mice, normalized to lean body mass (LBM), were significantly higher than WT (Figure 2C, Table S2). Total heat generation of the Ren1c-/- mice was 107 kcal/kg LBM/day higher than that of WT mice, which corresponds to 1.26 kcal/mouse/day. Consistent with increased heat generation, expressions of uncoupling proteins (UCPs) in adipose tissues and the skeletal muscle of these Ren1c-/- mice were significantly higher than those of WT (Table S3). A more than 10% lower respiratory quotient (RQ) in the Ren1c-/- mice (Figure 2D) suggests that they have increased fat combustion. This suggestion is further supported by higher plasma β-hydroxybutyrate (338.9 ± 29.5 μM in Ren1c-/- and 257.4 ± 18.0 μM in WT, p<0.05) and elevated mRNA expression of liver mitochondrial HMGCoA synthase 2 (215 ± 16 % in Ren1c-/- and 100 ± 19 % in WT, p<0.01). Although the Ren1c-/- mice had higher heat generation than WT, the core body temperatures of the Ren1c-/- and WT mice were indistinguishable (38.3 ± 0.2°C in Ren1c-/-, 38.4 ± 0.1 in WT, n=9 each, p=0.42). We conclude that increased fatty acid oxidation leads to increased basal metabolism, which contributes to the resistance to diet-induced obesity observed in mice lacking renin, and that mice can maintain core body temperature without renin.
Figure 2. Ren1c-/- mice generate more heat, excrete more fat in feces, and express less pancreatic lipase, colipase, and adipose tissue Dgat1.
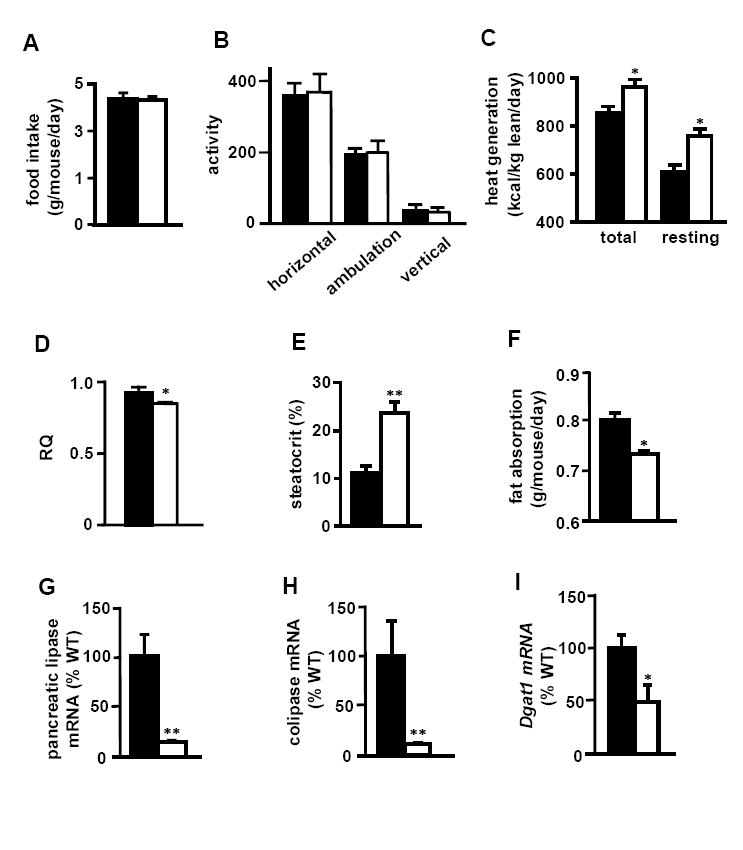
(A) food intake, (B) activity, (C) heat generation, (D) respiratory quotient, (E) fecal acid steatocrit, and (F) dietary fat absorption of 3~5 month-old males fed a high fat diet for two weeks. All data are from n=9 each group. Error bars represent ± SEM in all panels of this figure. mRNA expression of (G) pancreatic lipase, (H) pancreatic colipase, and (I) Dgat1 in GWAT of 3-month-old males fed regular chow. Closed bars: WT. Open bars: Ren1c-/-. All data are from n=6~9 each group. *p<0.05, **p<0.005 compared to WT.
Possible mechanisms accounting for the increased basal metabolism include increased sympathetic nerve activity, hyperthyroidism and hyperadiponectinemia (Bays, 2004). The Ren1c-/- mice have 30 mmHg lower tail-cuff blood pressures than WT mice (Takahashi et al., 2005). This could stimulate the sympathetic nervous system, but norepinephrine synthesis in adipose tissue depots as well as the plasma concentrations of epinephrine and norepinephrine did not differ (Table S4). Plasma thyroid hormone levels of the Ren1c-/- mice were not higher than those of WT mice (Table S5). In contrast, plasma adiponectin levels of these 3~5-month-old Ren1c-/- mice fed a high fat diet for 4 weeks were almost three times higher than those of WT (58.0 ± 1.9 μg/ml in Ren1c-/- and 21.0 ± 2.0 in WT, n=8 each, p<0.0001). In addition, adiponectin has been shown to increase the expression of UCPs (Masaki et al., 2003), which is consistent with our observation. We conclude that hyperadiponectinemia of the Ren1c-/- mice likely contributes to their increased fatty acid oxidation and metabolic rate.
Dietary fat wasting in mice lacking renin
Although the food intake of the Ren1c-/- and WT mice did not differ (Figure 2A), the amount of lipid in the feces, as estimated by the acid steatocrit was more than 2 times higher in the Ren1c-/- mice (Figure 2E). The dietary fat absorption was 70 mg/mouse/day lower in the Ren1c-/- mice (Figure 2F), which corresponds to a caloric deficit of 0.63 kcal/mouse/day. Dietary lipids are predominantry triacylglycerol, which forms micelles together with bile salts, gets hydrolized by lipases before being absorbed in the small intestine. Bile acid contents in the liver and intestine were indistinguishable between the two genotypes (Table S6). In contrast, the expression levels of pancreatic lipase and colipase of the Ren1c-/- mice were both less than 20% of WT (Figures 2G and 2H). Because one pancreatic lipase molecule requires one colipase molecule to be active (Chaillan et al., 1989), less than 20% expression of both of them most likely leads to substantially less lipase activity than WT. In addition, because Ang II stimulates pancreatic lipase secretion (Tsang et al., 2004), the absence of Ang II in the Ren1c-/- mice is expected to decrease pancreatic lipase secretion. Further studies are required to test whether the decrease in pancreatic lipase and colipase that occurs in the Ren1c-/- mice is the primary cause of steatorrhea.
Decreased Dgat1 expression in the adipose tissue of the Ren1c-/- mice
Ang II stimulates the proliferation and differentiation of preadipocytes in vitro by increasing expressions of adipogenic genes including transcription factors (Crandall, 1999; Kim et al., 2001; Saint-Marc et al., 2001). However, their expressions in the Ren1c-/- mice did not differ from WT (Table S7). Nevertheless, because the adipocytes of the Ren1c-/- mice are small, it is possible that their ability to synthesize fat is impaired. In support of this possibility we found that the expression in the white adipose tissue of the Ren1c-/- mice of diacylglycerol acyltransferase 1 (Dgat1) mRNA, the enzyme catalyzing the last step of triacylglycerol synthesis, was about half of WT (Figure 2I). The decreased Dgat1 expression was not compensated by Dgat2 (Table S7). Because Dgat1 heterozygous knockout mice have 40% body fat of WT controls, and because transplantation of white adipose tissue from the Dgat1-/- mice to WT mice decreases adiposity (Chen et al., 2003), we conclude that a decrease in Dgat1 expression in the adipose tissue contributes significantly to the lean phenotype of the Ren1c-/- mice.
Ren1c-/- mice are insulin sensitive
Consistent with the previous findings that the decrease in Dgat1 is associated with an increase in adiponectin, and that adiponectin improves insulin sensitivity (Chen et al., 2003; Chen et al., 2002; Smith et al., 2000), the Ren1c-/- mice had increased plasma adiponectin, decreased plasma fasting glucose and insulin compared to WT mice especially on a high fat diet (Table S8). They also required less insulin to maintain similar levels of plasma glucose compared to WT mice assessed by glucose tolerance test (Figure 3). Because the animals for glucose tolerance test were 4 months old and on normal chow, they had similar fasting blood glucose levels, and did not have a large difference in body weight, suggesting that the absence of renin (and Ang II) increases insulin sensitivity rather than WT mice developing insulin resistance secondary to obesity. Together these observations lead to the conclusion that increased plasma adiponectin in the Ren1c-/- mice probably contributes to their improved insulin sensitivity.
Figure 3. Ren1c-/- mice have improved insulin sensitivity.
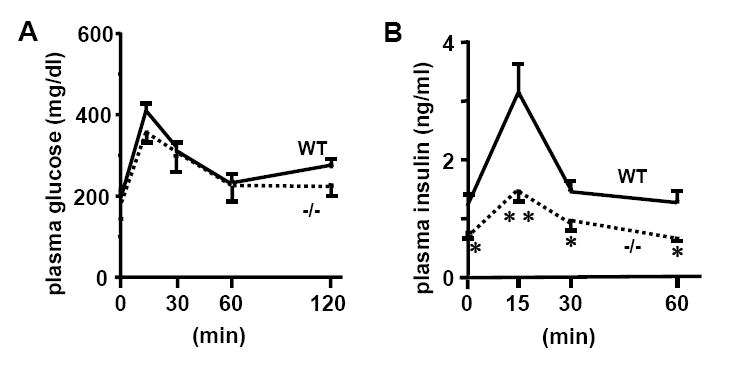
Plasma glucose (A) and insulin (B) levels during glucose tolerance test. Mice were 4-month-old males on regular chow. All data are from n=6 each group. *p<0.05, **p<0.001 compared to WT. Error bars represent ± SEM in both panels of this figure.
The metabolic phenotype of mice lacking renin is largely explained by lack of Ang II
To determine whether the metabolic phenotype of the Ren1c-/- mice is due to lack of Ang II caused by the absence of renin or due to Ang II-independent direct effects of renin, we infused the Ren1c-/- mice with low dose Ang II (1.5 μg/day) and maintained them on a high fat diet for 4 weeks. Ang II increased body weight, body fat and plasma insulin, and decreased steatocrit and plasma adiponectin of the Ren1c-/- mice to similar levels of WT without affecting blood pressure, food intake, blood glucose, and plasma creatinine (Figure 4). Ang II-treated Ren1c-/- mice also had hydronephrosis similar to untreated knockouts (data not shown).
Figure 4. Low dose Ang II abrogates the metabolic phenotype of Ren1c-/- mice.
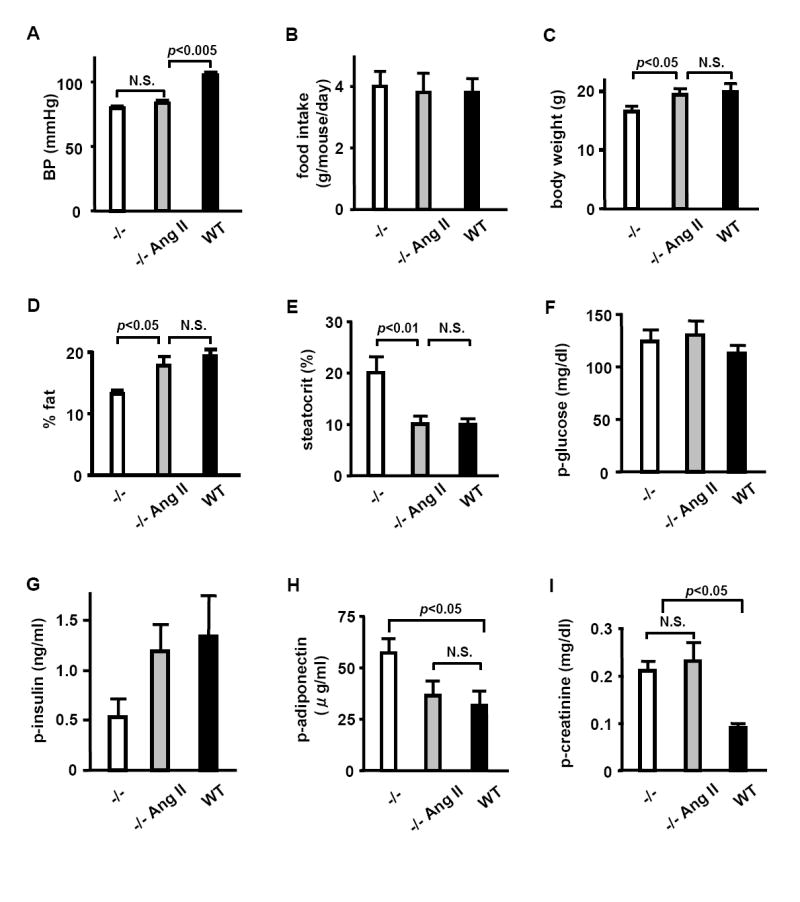
(A) blood pressure, (B) food intake, (C) body weight, (D) body fat (% body weight), (E) fecal acid steatocrit, (F) plasma glucose, (G) plasma insulin, (H) plasma adiponectin, (I) plasma creatinine of Ren1c-/- mice implanted with placebo pellets, Ren1c-/- mice implanted with pellets that release Ang II (1.5 μg/day), and WT control mice implanted with placebo pellets. All mice were maintained on a high fat diet started at pellet implantation, and the data were obtained 4 weeks after the treatment. n≥5 each. Error bars represent ± SEM in all panels of this figure.
Next, to test whether the low blood pressure of renin knockout mice could explain the altered metabolic phenotype, we administered WT mice a high fat diet with an angiotensin receptor blocker losartan, a Ca channel blocker amlodipine, or a diuretic furosemide for two weeks to decrease blood pressure to levels similar to those of the Ren1c-/- mice (Figure S1A). The losartan group showed less of an increase in body weight on a high fat diet, less body fat gain, lower plasma glucose, and higher plasma adiponectin without changing the food intake and plasma insulin, indicating losartan makes the animals resistant to diet-induced obesity and insulin sensitive (Figure S1). Amlodipine and furosemide groups showed similar food intake, body fat, steatocrit, and insulin sensitivity compared to untreated WT mice on a high fat diet (Figure S1).
We conclude from these results that the absence of Ang II is sufficient to explain the metabolic phenotype of the Ren1c-/- mice, that Ang II-independent direct effects of renin are minimal, and that decreased blood pressure and abnormal kidney function do not contribute to their metabolic phenotype.
DISCUSSION
To establish the role of renin on the metabolic phenotype in vivo, we have generated mice lacking renin (Ren1c) using embryonic stem cells from C57BL/6 mouse, a strain prone to diet-induced obesity. The Ren1c-/- mice are lean, insulin sensitive, and resistant to diet-induced obesity without changes in food intake and physical activity. The Ren1c-/- mice lose dietary fat in the feces, which is likely due to decreased expressions of pancreatic lipase and colipase. They also have high metabolic rate, and increased fatty acid oxidation, which is associated with decreased expression of Dgat1, and increased adiponectin. Because the adiposity, insulin sensitivity, and expression levels of Dgat1 of the Ren1c-/- mice are similar to those of the heterozygous Dgat1+/- mice (Chen et al., 2003), the decreased Dgat1 expression likely explains the metabolic phenotype of the Ren1c-/- mice. Increased adiponectin is likely at least partly responsible for high energy expenditure and improved insulin sensitivity of the Ren1c-/- mice. However, factors other than adiponectin could be also involved in high energy expenditure and improved insulin sensitivity of the Ren1c-/- mice.
Renin catalyzes the rate-limiting step of Ang II production, but it has the potential for Ang II-independent effects (Nguyen, 2006). Mice lacking angiotensinogen (Agt), the renin substrate, are also lean, and resistant to diet-induced obesity (Massiera et al., 2001). However, different from the Ren1c-/- mice the Agt-/- mice have higher physical activity and similar metabolic rate compared to WT, and they did not show dietary lipid wasting (Massiera et al., 2001). Because the Agt-/- mice have very high levels of renin (Tanimoto et al., 1994), Ang II-independent direct effects of renin could be responsible for the difference in the phenotype between mice lacking renin and mice lacking angiotensinogen. However, Ang II reverses the metabolic phenotype of the Ren1c-/-mice without affecting blood pressure, plasma creatinine and hydronephrosis. In addition, losartan treated wild type mice fed a high fat diet show qualitatively similar phenotype as the Ren1c-/- mice, whereas amlodipine and furosemide that decreased blood pressure of WT mice similar to the levels of the Ren1c-/- mice did not replicate the metabolic phenotype of the knockout mice. These results indicate that lack of Ang II is sufficient to explain the metabolic phenotype of mice lacking renin, and Ang II-independent direct metabolic effects of renin are minimal. Moreover, the developmental defect of their kidney and low blood pressure per se do not affect the metabolic phenotype of the Ren1c-/- mice.
Because much of the metabolic phenotype of the Ren1c-/- mice is replicated by losartan, it is expected that the metabolic phenotype of the Ren1c-/- mice is similar to that of the mice lacking type 1a Ang II receptor (Agtr1a-/-). Indeed the Agtr1a-/- mice are also lean, resistant to diet-induced obesity, and show high metabolic rate (Kouyama et al., 2005). Interestingly, heterozygous Agtr1a+/- mice are also resistant to diet-induce obesity, whereas heterozygous Ren1c+/- mice are indistinguishable from WT in every parameter measured (data not shown). This is probably because the plasma and kidney renin levels of the heterozygous Ren1c+/- mice are indistinguishable from those of WT due to the tight feedback regulation of renin (Takahashi et al., 2005), whereas the Agtr1a+/- mice express 50% WT level of its gene product (Ito et al., 1995). However, this does not exclude the possibility that mild increase in the expression of renin, which we expect in human population, causes obesity and insulin resistance, which is currently under investigation using our renin overexpressing mice.
Apparent absence of dietary fat wasting in the Agt-/- mice could be because the Soxhlet extraction method using petroleum benzene they used (Massiera et al., 2001) was not sensitive enough compared to our acid steatocrit method in quantifying fecal lipid, and was not able to detect the increase in fecal fat of the Agt-/- mice. Another possibility that could explain the difference is the difference in genetic backgrounds. Our Ren1c-/- mice were generated using C57BL/6 embryonic stem cells and maintained on the same strain (coisogenic), whereas the Agt-/- mice were generated using F1 embryonic stem cells between C57BL/6 and CBA, and backcrossed to ICR stain of mice (Tanimoto et al., 1994). The difference in the genetic background possibly introduces differences in gene expressions that modify and obscure the phenotype. The difference in the genetic background also likely explains why the Agt-/- mice have higher physical activity and similar metabolic rate compared to WT mice.
Our study demonstrates that mice lacking renin are lean, resistant to diet-induced obesity, and more insulin sensitive. This metabolically favorable state results partly from increased metabolic rate, and partly from gastrointestinal loss of dietary fat, but not from increased physical activity or decreased food intake. Lack of Ang II is sufficient to explain the metabolic phenotype of mice lacking renin, and Ang II-independent direct effects of renin on metabolism are minimal. Our finding is particularly relevant since it suggests that renin inhibitors recently approved or under development for the treatment of hypertension likely have favorable effects on obesity and insulin sensitivity and their associated metabolic and cardiovascular consequences.
EXPERIMENTAL PROCEDURES
Mice
The generation of the Ren1c-/- has previously been described (Takahashi et al., 2005). Mice were housed in standard cages, on a 12 hr light/dark cycle, and allowed free access to regular chow and water, and handled in accordance with the NIH guidelines for the use and care of experimental animals, as approved by the IACUC of UNC-CH. In some experiments, a high fat diet (TD.88137, Harlan Tekald) was used. Fat content of the regular chow is 17% of calories and that of the high fat diet is 42% of calories.
DEXA
A Lunar PIXImus dual-energy X-ray absorptiometry (DEXA) scanner (Lunar PIXImus Inc.) was used to estimate the amount of body fat and lean body mass (Brommage, 2003; Nagy and Clair, 2000).
MRI
In some experiments, body composition of mice was evaluated using EchoMRI-100 (Echo Medical Systems) according to manufacturer’s instruction.
Metabolic studies
Mice were placed in chamber individually of an Oxymax system (Columbus Instruments) for 96 hrs, and readings were taken 24 hrs after acclimation. Measures of food and water intake, O2 consumption, CO2 production, respiratory quotient (RQ), and activity were obtained. Data were collected and analyzed with the Oxymax Windows V2.3 software. Measurement and settle times were set at 60 and 120 seconds, respectively.
Acid steatocrit
Acid steatocrit was measured as previously described with minor modification (Tran et al., 1994). In short, 0.05 g of powdered specimen was mixed in 200 μl of 1N perchloric acid. One drop of 0.5% oil red O was added and mixed. The specimens were placed in nonheparinized capillary tubes, and spun. Steatocrit was calculated as the 100 × length of fatty layer÷(length of solid layer + length of fatty layer).
β-hydroxybutyrate, insulin, leptin, adiponectin, T3, T4, and glucose tolerance test
Mice were fasted 4 hrs before blood was drawn. Plasma β-hydroxybutyrate was determined using a reagent kit (Wako or Sigma-Aldrich). Plasma levels of insulin, leptin and adiponectin were determined by ELISA kits (Crystal Chem Inc. for insulin and leptin, B-Bridge International Inc. for adiponectin). T3 and T4 were determined using Coat-A-COUNT (Diagnostic Products Corporation). Glucose tolerance test was carried out as previously described (Tsai et al., 2004)
Bile acids
Bile acids were extracted from livers and intestines as previously described (Dawson et al., 2003; Locket and Gallaher, 1989) and measured using a kit (Wako).
Catecholamine
Norepinephrine and epinephrine in the plasma, hearts and adipose tissues were measured using HPLC as previously described (Bowers et al., 2004). Norepinephrine turnover, a measure of its synthesis in the tissue is calculated as previously described (Brodie et al., 1966).
Ang II, losartan, amlodipine, furosemide experiments in vivo
Pellets releasing 1.5 μg/day Ang II or placebo pellets (Innovative Research of America) were subcutaneously implanted in 6-week-old male Ren1c-/- mice, and the animals were maintained on a high fat diet. After 4 weeks blood pressure, body composition, food intake, steatocrit, and plasma glucose, insulin, adiponectin, and creatinine were measured. In another set of experiment 3-month-old male C57BL/6 WT mice were fed a high fat diet with or without 0.45 g/l losartan (Merck & Co., Inc.) in drinking water containing 5% sucrose, amlodipine 60 mg/kg food, or furosemide 0.1 g/l in drinking water. After 2 weeks blood pressure, food intakes, steatocrit, body composition and plasma glucose, insulin and adiponectin were measured.
Quantitative RT-PCR
mRNA expression was quantified with the ABI Prism 7700 Sequence Detection System (Applied Biosystems) as described previously (Takahashi et al., 2005). Primers and probes are listed in Table S9.
Statistical analyses
All values are expressed as mean ± SEM. Data were analyzed by Student’s t test or analysis of variance (ANOVA). A multiple comparison Tukey-Klamer post-hoc test was performed to evaluate differences between groups with JMP software version 6 (SAS Institute Inc.).
Supplementary Material
Acknowledgments
Authors thank Drs. Rosalind A. Coleman, Paul A. Dawson, Nobuyo Maeda and Oliver Smithies, Mr. Longquan Xu and Ms. Shin-Ja Kim and Melissa A. Taylor for their assistance.
This work is supported by grants from the National Institutes of Health (P30DK56350, HL71266, HL49277, DK56350, DK35254), American Heart Association (0435230N), and UNC Department of Pathology and Laboratory Medicine.
Abbreviations
- RAS
renin angiotensin system
- ARB
angiotensin II receptor blocker
- Dgat
diacylglycerol acyltransferase
- RQ
respiratory quotient
- UCP
uncoupling protein
- IWAT
inguinal white adipose tissue
- GWAT
gonadal white adipose tissue
- RWAT
retroperitoneal white adipose tissue
- BAT
brown adipose tissue
Footnotes
Publisher's Disclaimer: This is a PDF file of an unedited manuscript that has been accepted for publication. As a service to our customers we are providing this early version of the manuscript. The manuscript will undergo copyediting, typesetting, and review of the resulting proof before it is published in its final citable form. Please note that during the production process errors may be discovered which could affect the content, and all legal disclaimers that apply to the journal pertain.
References
- Bays HE. Current and investigational antiobesity agents and obesity therapeutic treatment targets. Obes Res. 2004;12:1197–1211. doi: 10.1038/oby.2004.151. [DOI] [PubMed] [Google Scholar]
- Bowers RR, Festuccia WT, Song CK, Shi H, Migliorini RH, Bartness TJ. Sympathetic innervation of white adipose tissue and its regulation of fat cell number. Am J Physiol Regul Integr Comp Physiol. 2004;286 doi: 10.1152/ajpregu.00558.2003. [DOI] [PubMed] [Google Scholar]
- Brodie BB, Costa E, Dlabac A, Neff NH, Smookler HH. Application of steady state kinetics to the estimation of synthesis rate and turnover time of tissue catecholamines. J Pharmacol Exp Ther. 1966;154:493–498. [PubMed] [Google Scholar]
- Brommage R. Validation and calibration of DEXA body composition in mice. American Journal of Physiology - Endocrinology & Metabolism. 2003;285:E454–459. doi: 10.1152/ajpendo.00470.2002. [DOI] [PubMed] [Google Scholar]
- Chaillan C, Rogalska E, Chapus C, Lombardo D. A cross-linked complex between horse pancreatic lipase and colipase. FEBS Lett. 1989;257:443–446. doi: 10.1016/0014-5793(89)81592-3. [DOI] [PubMed] [Google Scholar]
- Chen HC, Jensen DR, Myers HM, Eckel RH, Farese RV., Jr Obesity resistance and enhanced glucose metabolism in mice transplanted with white adipose tissue lacking acyl CoA:diacylglycerol acyltransferase 1. J Clin Invest. 2003;111:1715–1722. doi: 10.1172/JCI15859. [DOI] [PMC free article] [PubMed] [Google Scholar]
- Chen HC, Smith SJ, Ladha Z, Jensen DR, Ferreira LD, Pulawa LK, McGuire JG, Pitas RE, Eckel RH, Farese RV., Jr Increased insulin and leptin sensitivity in mice lacking acyl CoA:diacylglycerol acyltransferase 1. J Clin Invest. 2002;109:1049–1055. doi: 10.1172/JCI14672. [DOI] [PMC free article] [PubMed] [Google Scholar]
- Crandall D, Armellino DC, Busler DE, McHendry-Rinde B, Kral JG. Angiotensin II receptors in human preadipocytes: role in cell cycle regulation. Endocrinology. 1999;140:154–158. doi: 10.1210/endo.140.1.6430. [DOI] [PubMed] [Google Scholar]
- Dawson PA, Haywood J, Craddock AL, Wilson M, Tietjen M, Kluckman K, Maeda N, Parks JS. Targeted deletion of the ileal bile acid transporter eliminates enterohepatic cycling of bile acids in mice. J Biol Chem. 2003;278:33920–33927. doi: 10.1074/jbc.M306370200. [DOI] [PubMed] [Google Scholar]
- Farmer JA. Hypertension and the metabolic syndrome. Curr Cardiol Rep. 2004;6:427–433. doi: 10.1007/s11886-004-0050-7. [DOI] [PubMed] [Google Scholar]
- Ito M, Oliverio MI, Mannon PJ, Best CF, Maeda N, Smithies O, Coffman TM. Regulation of blood pressure by the type 1A angiotensin II receptor gene. Proc Natl Acad Sci U S A. 1995;92:3521–3525. doi: 10.1073/pnas.92.8.3521. [DOI] [PMC free article] [PubMed] [Google Scholar]
- Kim S, Dugail I, Standridge M, Claycombe K, Chun J, Moustaid-Moussa N. Angiotensin II-responsive element is the insulin-responsive element in the adipocyte fatty acid synthase gene: role of adipocyte determination and differentiation factor 1/sterol-regulatory-element-binding protein 1c. Biochem J. 2001;357:899–904. doi: 10.1042/0264-6021:3570899. [DOI] [PMC free article] [PubMed] [Google Scholar]
- Kouyama R, Suganami T, Nishida J, Tanaka M, Toyoda T, Kiso M, Chiwata T, Miyamoto Y, Yoshimasa Y, Fukamizu A, et al. Attenuation of diet-induced weight gain and adiposity through increased energy expenditure in mice lacking angiotensin II type 1a receptor. Endocrinology. 2005;146:3481–3489. doi: 10.1210/en.2005-0003. [DOI] [PubMed] [Google Scholar]
- Locket PL, Gallaher DD. An improved procedure for bile acid extraction and purification and tissue distribution in the rat. Lipids. 1989;24:221–223. doi: 10.1007/BF02535238. [DOI] [PubMed] [Google Scholar]
- Masaki T, Chiba S, Yasuda T, Tsubone T, Kakuma T, Shimomura I, Funahashi T, Matsuzawa Y, Yoshimatsu H. Peripheral, but not central, administration of adiponectin reduces visceral adiposity and upregulates the expression of uncoupling protein in agouti yellow (Ay/a) obese mice. Diabetes. 2003;52:2266–2273. doi: 10.2337/diabetes.52.9.2266. [DOI] [PubMed] [Google Scholar]
- Massiera F, Seydoux J, Geloen A, Quignard-Boulange A, Turban S, Saint-Marc P, Fukamizu A, Negrel R, Ailhaud G, Teboul M. Angiotensinogen-Deficient Mice Exhibit Impairment of Diet-Induced Weight Gain with Alteration in Adipose Tissue Development and Increased Locomotor Activity. Endocrinology. 2001;142:5220–5225. doi: 10.1210/endo.142.12.8556. [DOI] [PubMed] [Google Scholar]
- Nagy TR, Clair AL. Precision and accuracy of dual-energy X-ray absorptiometry for determining in vivo body composition of mice. Obesity Research. 2000;8:392–398. doi: 10.1038/oby.2000.47. [DOI] [PubMed] [Google Scholar]
- Nguyen G. Renin/prorenin receptors. Kidney Int. 2006;69:1503–1506. doi: 10.1038/sj.ki.5000265. [DOI] [PubMed] [Google Scholar]
- Saint-Marc P, Kozak LP, Ailhaud G, Darimont C, Negrel R. Angiotensin II as a Trophic Factor of White Adipose Tissue: Stimulation of Adipose Cell Formation. Endocrinology. 2001;142:487–492. doi: 10.1210/endo.142.1.7883. [DOI] [PubMed] [Google Scholar]
- Scheen AJ. Renin-angiotensin system inhibition prevents type 2 diabetes mellitus. Part 1. A meta-analysis of randomised clinical trials. Diabetes Metab. 2004;30:487–496. doi: 10.1016/s1262-3636(07)70146-5. [DOI] [PubMed] [Google Scholar]
- Sigmund CD, Gross KW. Structure, expression, and regulation of the murine renin genes. Hypertension. 1991;18:446–457. doi: 10.1161/01.hyp.18.4.446. [DOI] [PubMed] [Google Scholar]
- Smith SJ, Cases S, Jensen DR, Chen HC, Sande E, Tow B, Sanan DA, Raber J, Eckel RH, Farese RV., Jr Obesity resistance and multiple mechanisms of triglyceride synthesis in mice lacking Dgat. Nat Genet. 2000;25:87–90. doi: 10.1038/75651. [DOI] [PubMed] [Google Scholar]
- Surwit R, Kuhn CM, Cochrane C, McCubbin JA, Feinglos MN. Diet-induced type II diabetes in C57BL/6J mice. Diabetes. 1988;37:1163–1167. doi: 10.2337/diab.37.9.1163. [DOI] [PubMed] [Google Scholar]
- Takahashi N, Sequeira Lopez MLS, Cowhig JE, Taylor MA, Hatada T, Riggs E, Lee G, Gomez RA, Kim H-S, Smithies O. Ren1c homozygous null mice are hypotensive and polyuric, but heterozygotes are indistinguishable from wild type. J Am Soc Nephrol. 2005;16:125–132. doi: 10.1681/ASN.2004060490. [DOI] [PubMed] [Google Scholar]
- Tanimoto K, Sugiyama F, Goto Y, Ishida J, Takimoto E, Yagami K, Fukamizu A, Murakami K. Angiotensinogen-deficient mice with hypotension. J Biol Chem. 1994;269:31334–31337. [PubMed] [Google Scholar]
- Tran M, Forget P, Van den Neucker A, Strik J, van Kreel B, Kuijten R. The acid steatocrit: a much improved method. J Pediatr Gastroenterol Nutr. 1994;19:299–303. doi: 10.1097/00005176-199410000-00007. [DOI] [PubMed] [Google Scholar]
- Tsai YS, Kim HJ, Takahashi N, Kim HS, Hagaman JR, Kim JK, Maeda N. Hypertension and abnormal fat distribution but not insulin resistance in mice with P465L PPARgamma. J Clin Invest. 2004;114:240–249. doi: 10.1172/JCI20964. [DOI] [PMC free article] [PubMed] [Google Scholar]
- Tsang SW, Cheng CH, Leung PS. The role of the pancreatic renin-angiotensin system in acinar digestive enzyme secretion and in acute pancreatitis. Regul Pept. 2004;119:213–219. doi: 10.1016/j.regpep.2004.02.003. [DOI] [PubMed] [Google Scholar]
Associated Data
This section collects any data citations, data availability statements, or supplementary materials included in this article.