

Abstract
Background
Thioredoxin (TRX) is a powerful disulfide oxido-reductase that catalyzes a wide spectrum of redox reactions in the cell. The aim of this study is to elucidate the role of the TRX system in the oxidative stress response in Lactobacillus plantarum WCFS1.
Results
We have identified the trxB1-encoded thioredoxin reductase (TR) as a key enzyme in the oxidative stress response of Lactobacillus plantarum WCFS1.
Overexpression of the trxB1 gene resulted in a 3-fold higher TR activity in comparison to the wild-type strain. Subsequently, higher TR activity was associated with an increased resistance towards oxidative stress. We further determined the global transcriptional response to hydrogen peroxide stress in the trxB1-overexpression and wild-type strains grown in continuous cultures. Hydrogen peroxide stress and overproduction of TR collectively resulted in the up-regulation of 267 genes. Additionally, gene expression profiling showed significant differential expression of 27 genes in the trxB1-overexpression strain. Over expression of trxB1 was found to activate genes associated with DNA repair and stress mechanisms as well as genes associated with the activity of biosynthetic pathways for purine and sulfur-containing amino acids. A total of 16 genes showed a response to both TR overproduction and hydrogen peroxide stress. These genes are involved in the purine metabolism, energy metabolism (gapB) as well as in stress-response (groEL, npr2), and manganese transport (mntH2).
Conclusion
Based on our findings we propose that overproduction of the trxB1-encoded TR in L. plantarum improves tolerance towards oxidative stress. This response coincides with simultaneous induction of a group of 16 transcripts of genes. Within this group of genes, most are associated with oxidative stress response. The obtained crossover between datasets may explain the phenotype of the trxB1-overexpression strain, which appears to be prepared for encountering oxidative stress. This latter property can be used for engineering robustness towards oxidative stress in industrial strains of L. plantarum.
Background
TRX was first characterized as a sole electron donor for ribonucleotide reductase in Escherichia coli [1]. The catalytic activity of these oxido-reductases can be attributed to the -CXXC- motif found in these proteins. At this cysteine-rich site electrons are transferred from the reduced TRX towards the substrate (proteins, disulfides, etc). The resulting oxidized TRX is regenerated via thioredoxin reductase (TR) using NADPH as a cofactor. Throughout the years, studies on the effect of the ubiquitous and conserved TRX in cellular metabolism have revealed that it plays a significant role in a variety of processes, including oxidative stress, protein repair, and RNA biosynthesis [2-4].
Intensive research on the role of TRX and TR include the use of transcriptomics and proteomics approaches. Studies with Bacillus subtilis and Oenococcus oeni showed that gene trxA was induced under stress conditions like heat and hydrogen peroxide stress [5,6]. In addition, gene expression studies in E. coli elucidated that under hydrogen peroxide stress, OxyR (transcription regulator activated by hydrogen peroxide in the cell) exerts transcription regulation on the TRX system [3]. Proteomic studies in microorganisms have allowed the identification of a range of TRX-targeted proteins via the use of a Tandem Affinity Purification tag. In addition, the in-vivo TRX-interacting proteins in Saccaromyces cerevisiae were identified using yeast two-hybrid systems [7]. Both proteomic approaches revealed possible associations within the complex networks of redox regulation in microorganisms and TRX and underlines the broad impact of the TRX system in the metabolic and regulatory network of the cell.
The reducing power of the TRX system and the glutaredoxin system is essential for all organisms. Furthermore, these two systems are suggested to be the only systems that maintain the cytoplasm of the cell in the reduced state [8]. While glutathione is found in eukaryotes and Gram-negative bacteria, it has been reported that most Gram-positive bacteria lack the ability to synthesize glutathione but rather import it from the environment. This is the case for B. subtilis, Listeria monocytogenes, and Lactobacillus plantarum [9]. In the latter organism the gene gshB which is involved in the second step for the synthesis of glutathione (glutathione synthase), has not been identified in the genome sequence [10]. Hence, it is believed that in L. plantarum the TRX system is the only active thiol-reducing system.
Little is known about the TRX system and its function in L. plantarum. This flexible and versatile bacterium is a member of the human gut microbiota, and is commonly used in fermented foods. The purpose of this study is to characterize the TRX system in L. plantarum WCFS1 pursuing a functional genomics approach where transcriptomics, enzyme activity assays, and bioinformatics studies will be used. This investigation clarifies the suggested roles of TR in the response of L. plantarum WCFS1 to oxidative stress. Finally, this study unveils the role of TRX reductase or the TRX system as a redox sensor in the cell.
Results
In silico analysis of the TRX system
The annotated genome of L. plantarum WCFS1 [10] reveals that the TRX system in this organism is composed by six ORF's (Open Reading Frames). Four genes are annotated as TRX encoding genes: trxA1 (lp_0236), trxA2 (lp_2270), trxA3 (lp_3437), and trxH (lp_2633). The other two genes trxB1 (lp_0761) and trxB2 (lp_2585) are annotated respectively as TR and nucleotide-disulphide oxidoreductase. These six genes are dispersed throughout the genome and are highly conserved within L. plantarum strains regardless of their ecological niche [11].
Bioinformatics tools were used to investigate the evolutionary relationship of the TRX genes in L. plantarum WCFS1. The translated gene sequences for trxA2 and trxB1 from L. plantarum WCFS1 showed the highest homology (pscores higher than e-152) to characterized TRX and TR respectively of different organisms such as L. lactis and B. subtilis. In L. plantarum trxB1 and trxB2 have a 28% similarity at the protein level. The orthologous relation of trxB1 from L. plantarum WCFS1 with trxB of B. subtilis and the similarity in the alignment with other trxB genes (including trxB of E. coli) suggests a molecular function of trxB1 as TR. Interestingly, the sequence of trxB2 does not possess an active center -CACV- which is an essential characteristic of the TR suggesting that this ORF does not have the potential of reducing TRX. By phylogeny analysis it was determined that the trxB2- encoding protein of L. plantarum WFCS1 is orthologous to the B. subtilis protein YUMC suggesting that these two sequences have the same molecular function namely to act as a ferredoxin NAD(P) reductase [12].
In vivo functionality of the TRX system
The in vivo functionality of the complete TRX system was studied by quantitative PCR (q-PCR) of RNA isolated from L. plantarum WCFS1 grown in CDM at 37°C under anaerobic and oxidative stress conditions. The cultures were exposed to different temperatures or redox environments created by the addition of diamide or DTT to the medium. The relative expression expressed in arbitrary units (Au) of the six different transcripts that compose the TRX system is presented in Table 1. We observed that trxA2 and trxB1 were relatively higher expressed under all studied conditions when compared to the other trxA's and trxB2 respectively. Moreover, transcript trxB2 and trxA2 were respectively higher expressed when the bacterium was cultivated at 37°C compared to the other four studied transcripts evaluated at the same incubation temperature. When comparing the effect of different growth conditions within each probe, we observed -with the exception of trxB2- that the highest expression of each studied transcript is observed under diamide exposure compared to when grown with DTT or different temperatures (37°C and 30°C). Our observations suggest a role for both trxA2 and trxB1 genes in the response mechanism of this bacterium towards oxidative stress while the gene, trxB2 together with trxA2 could play a role during a heat shock or reductive stress.
Table 1.
Relative expression levels of trxA1, trxA2, trxA3, trxH, trxB1, and trxB2 in Lactobacillus plantarum grown under different oxidative environments.
| trxA1 | trxA2 | trxA3 | trxH | trxB1 | trxB2 | |||||||
| Sample | AV5 | stdev | AV5 | stdev | AV5 | stdev | AV5 | stdev | AV5 | stdev | AV5 | stdev |
| A1 | 115,95 | 67 | 186,78 | 28 | 128,83 | 33 | 94,80 | 32 | 197,93 | 12 | 151,40 | 27 |
| B2 | 98,18 | 66 | 506,75 | 23 | 122,20 | 7 | 132,15 | 33 | 367,80 | 47 | 392,55 | 14 |
| C3 | 156,50 | 33 | 357,43 | 68 | 152,20 | 41 | 138,13 | 18 | 180,75 | 55 | 304,17 | 69 |
| D4 | 240,25 | 30 | 2104,90 | 124 | 870,00 | 8 | 380,05 | 81 | 1258,68 | 102 | 139,43 | 65 |
1RNA extracted at OD600 = 1.5 from L. plantarum WCFS1 grown at 30°C on CDM with 0.5% Glucose
2RNA extracted from L. plantarum WCFS1 extracted at OD600 = 1.5 when grown at 37°C on CDM containing 0.5% Glucose.
3RNA isolated at OD600 = 1.5 from L. plantarum WCFS1 grown at 37°C in CDM containing 0.5% Glucose until OD600 = 1.0 when diamide was added to a final concentration of 5 mM
4RNA isolated at OD600 = 1.5 from L. plantarum WCFS1 grown at 37°C on CDM with 0.5% Glucose until OD600 = 1.0 when DTT was added to a final concentration of 5 mM
Based on the gene expression data and the in silico sequence analysis; we propose that trxB1 is coding for the main TR in the TRX system in L. plantarum WCFS1. To study the role of this enzyme in more detail, we constructed L. plantarum strains with elevated expression levels of trxB1.
Overproduction of TR
Overproduction of TR was achieved using the NICE expression system [13]. The transformant (L. plantarum NZ7601), carries the gene trxB1 under the control of the nisin promoter. Strain NZ7601 displayed five-fold higher TR activity after induction with 50 ng/ml nisinZ compared to the wild type strain NZ7606 (data not shown). The strain NZ7601 is able to reduce more than 1000 nmol DTNB·(min·mg prot)-1 compared to 300 nmol DTNB·(min·mg prot)-1 when no nisin is added to the medium (Fig. 1). The TR activity of NZ7601 without the addition of nisin corresponded to the TR activity of the control strain NZ7606 with values, both under aerobic and anaerobic growth conditions, of 300 and 320 nmol DTNB·(min·mg prot)-1 respectively. An elevated expression of the trxB1 transcript was also detected in NZ7601 by northern blot analysis (data not shown).
Figure 1.

Thioredoxin reductase enzyme activity measurements showed as nmolDTNB reduced per min per mg protein. The strain NZ7601 was grown (black bars) aerobically and (gray bars) anaerobically at 37°C and was induced with 0 or 50 ng/ml nisinZ. After 5 hours of induction cell free extracts were prepared and TR activity was measured. The data shown above is the result of three independent experiments.
Next, we evaluated the effect of overproduction of the reductase in the oxidative stress response. For this we monitored the growth of the trxB1-overexpressing strain NZ7601 and wild-type NZ7606 in the presence of diamide [5 mM], a known thiol oxidant [14] (Fig. 2). Both tested strains grew with a maximum specific growth rate (μmax) of 0.36 h-1 when no stress factor was present in the medium. In the presence of diamide, both strains were initially similarly affected by the oxidative stress showing a μmax reduction to 0.17 h-1 and 0.15 h-1, respectively. However, later on the growth pattern strain NZ7601 differed from that of the wild-type. While strain NZ7606 after reaching an OD600 of 0.5 stops growing and enters stationary phase, strain NZ7601 continues to grow under oxidative stress and reaches a cell density comparable to that observed in the absence of oxidative stress.
Figure 2.

Growth patterns of nisin inducible L. plantarum NZ7100 strains on MRS supplemented with 10 μg/μl of chloramphenicol with or without diamide after nisin induction. The strain NZ7601 carrying the over expression of gene trxB1 was grown in MRS broth (white circles) and in MRS with 5 mM diamide (black circles) and the wild type strain NZ7606 was grown in MRS broth (white triangles) and in MRS with 5 mM diamide (black triangles). The growth was monitored by turbidity measurements at 600 nm.
This response under oxidative stress of strain NZ7601 was investigated in a quantitative growth-zone inhibition assay (Fig. 3). In this assay, we tested the inhibitory capacity of hydrogen peroxide and diamide on strains NZ7601 and NZ7606. We observed that strain NZ7601 at all studied oxidant concentrations showed a smaller inhibition zone compared to NZ7606.
Figure 3.

Growth-zone inhibition assays. The zone of growth inhibition towards hydrogen peroxide or diamide is showed in centimeters in the y-axis. The different strains are represented in the figure as such: L. plantarum NZ7606 (white bars) and L. plantarum NZ7601 (black bars).
Transcriptome analysis
To analyze the correlation between TR overproduction and oxidative stress we carried out transcriptome analyses of the constructed strains. The mutant and the wild-type strains were grown in chemostats at a dilution rate of 0.1 h-1, and samples for transcriptome analysis were drawn at steady state both prior and 30 min after a hydrogen peroxide pulse. Because the NICE system is not suitable for continuous cultivations due to the instability of nisin in the medium (data not shown), we used a constitutive promoter, PpepN, to drive expression of trxB1. Therefore, two new strains were constructed: strain NZ7602 carrying plasmid pMS040 where trxB1 is under the control of the a constitutive promoter from L. lactis [15], PpepN, and strain NZ7607 as a control strain carrying the empty plasmid pNZ7021. The continuous cultivations were performed in biological triplicates (Table 2). In the chemostat cultivations glucose present in the medium (100 mM) was consumed to undetectable levels (<0.5 mM) and the biomass produced was comparable in both strains. In addition, we found no growth difference between both strains under this cultivation condition.
Table 2.
Summary of parameters retrieved from continuous cultivations of trxB1 over-expression strain L. plantarum NZ7602 and control strain L. plantarum NZ7607.
| Strain | Substrate | Physiological parameters | |
| Glca | Yglc-Xb | GAPDHc | |
| Medium | 100 | ||
| NZ7607 | u.d | 0.12 | 0.623 ± 0.02 |
| NZ7602 | u.d | 0.13 | 1.613 ± 0.12 |
| NZ7607 + perox | u.d | 0.14 | n.d |
| NZ7602 + perox | u.d | 0.15 | n.d |
amM of glucose present in the supernatant
bbiomass yield on glucose (g of biomass/g glucose consumed).
cenzyme activity expressed as nmoles NADPH·(min·mg prot)-1
u.d. < 0.1 mM
n.d not determined
Mean ± SD of two separate chemostat steady states
The overexpression of trxB1 present in strain NZ7602 was in itself a good internal control in the transcriptome analysis. The transcript of this gene was found to be 23-fold more abundant in the trxB1 over-expressing strain compared to the control strain. This increase in transcript level resulted in a doubling of TR activity in strain NZ7602 compared to the wild-type (data not shown). The ANOVA statistical test that summarizes the significant effects due to overexpression of trxB1 showed that there were in total 27 significantly affected transcripts (pvalue < 0.01 and FC ≥1.5) in the trxB1 over-expressing strain when compared to the wild type (Table 3). We observed that 15% of them are predicted to be involved in the purine and pyrimidine biosynthesis. Other affected transcripts are predicted to be involved in stress-related processes (groEL, npr2), transport and binding proteins (mntH2), protein synthesis (tuf), protein fate (lp_1023), and genes involved in the cellular envelope (ica3). It is to be noted that none of the mentioned stress-related genes has a -CXXC- cysteine-rich active center. We also observed a significant up-regulation (1.7 fold) of the gene coding for glyceraldehyde-3-phosphate dehydrogenase, gapB. The GAPDH protein is involved in the energy metabolism of the cell. In L. plantarum WCFS1, gapB, is the only gene annotated as a glyceraldehyde-3-phosphate dehydrogenase. The in vitro activity of GAPDH in strain NZ7602 was analyzed and found to be approximately three-fold higher in comparison with the wild-type (Table 2). Furthermore, a gene related to cysteine amino acid metabolism was also upregulated in strain NZ7602 specifically the gene coding for serine O-acetyltransferase (cysE).
Table 3.
Summary of significant affected genes (27) in the trxB1 over-expression strain, NZ7602, when compared to the wild type (pvalue < 0.01 & FC ≥ 1.5). Predicted gene names, function, fold change induction as well as main functional classes of the significant affected transcripts are displayed in columns. Main functional classes presented in bold are those classes found overrepresented in this study when compared to the total genome of L. plantarum.
| Locus | FC2 trx/wt | Gene | Product | Main Functional Class (%)1 |
| lp_0254 | 1,5 | cysE | serine O-acetyltransferase | Amino acid biosynthesis (4%) |
| lp_3421 | 1,6 | extracellular protein, gamma-D-glutamate-meso-diaminopimelate muropeptidase (putative) | Cell envelope (7%) | |
| lp_2716 | 1,6 | ica3 | glycosyltransferase (putative) | |
| lp_0728 | 0,6 | groEL | GroEL chaperonin | Cellular processes (7%) |
| lp_2544 | 1,6 | npr2 | NADH peroxidase | |
| lp_3020 | 1,6 | tag2 | DNA-3-methyladenine glycosylase I | DNA metabolism (4%) |
| lp_0789 | 1,7 | gapB | glyceraldehyde 3-phosphate dehydrogenase | Energy metabolism (4%) |
| lp_1237 | 1,5 | unknown | Hypothetical proteins (19%) | |
| lp_1081 | 1,6 | unknown | ||
| lp_1611 | 2,1 | unknown | ||
| lp_1708 | 2,3 | unknown | ||
| lp_1880 | 3,9 | unknown | ||
| lp_1023 | 1,8 | type 4 prepilin-like proteins leader peptide processing enzyme (putative) | Protein fate (4%) | |
| lp_2119 | 1,7 | tuf | elongation factor Tu | Protein synthesis(4%) |
| lp_2721 | 1,5 | purN | phosphoribosylglycinamide formyltransferase | Purines, pyrimidines, nucleosides and nucleotides (15%) |
| lp_2722 | 1,6 | purM | phosphoribosylformylglycinamidine cyclo-ligase | |
| lp_2729 | 1,7 | purE | phosphoribosylaminoimidazole carboxylase, catalytic subunit | |
| lp_0761 | 23,5 | trxB1 | thioredoxin reductase (NADPH) | |
| lp_1230 | 1,6 | transcription regulator | Regulatory function (4%) | |
| lp_3278 | 1,8 | amino acid transport protein | Transport and binding proteins (11%) | |
| lp_1087 | 1,8 | cation transport protein | ||
| lp_2992 | 2,6 | mntH2 | manganese transport protein | |
| antilp_3469 | 1,6 | |||
| lp_RNA02 | 2,6 | plasmids (15%) | ||
| lp_p2_01 | 3,1 | |||
| lp_p2_02 | 3,2 | |||
| lp_p3_05 | 1,5 |
1values given in parenthesis correspond to the percentage of the total amount of genes (27) that belong to each depicted functional class.
2FC is fold change or 2M
The transcriptome analysis of cells exposed to a hydrogen peroxide pulse allowed us to analyze the effect of hydrogen peroxide on both the trxB1-overexpressing and wild-type strains. Oxidative stress significantly affected a total of 267 transcripts with a pvalue < 0.01 and FC ≥1.5 (Additional file 1). We observed that most of the up-regulated transcripts (159) are associated with genes related to defense mechanisms against oxidative challenge: hydrogen peroxide detoxification (npr2, kat, trxA2, pox3, pox5), exonucleases (rexA, rexB); stress response (asp1, asp2, groES, groEL); DNA repair (dinP, dnaE, recA); putative DNA helicases (lp_0910, lp_0308, lp_0432) and polymerases (umuC); transcription regulator repressor of the SOS regulon (lexA), ferrous iron transport (feoA, feoB), as well as an uncharacterized transcription regulator (lp_1360), a manganese transporter (mntH2), and the energy metabolism (gapB).
Our data showed that hydrogen peroxide stress also resulted in significant down-regulation of the expression of 108 transcripts (Additional file 1). The down-regulated transcripts correspond to genes involved in glucose catabolic pathways: cellular surface proteins; the mannose PTS; energy metabolism (ndr, nar genes, adhE, fruk); fatty acid biosynthesis (fab genes): acetyl-CoA carboxylases (accb2, accC2, accD2, and accA2); nonribosomal peptide bisoynthesis (nspA, nspB, and nspC); sugar uptake (sacR, ccpA), and 33 prophage genes.
Regulatory networks
In the group of significantly affected genes due to oxidative stress (Additional file 1) the largest group (22%) corresponded to hypothetical proteins. In order to find a functional correlation in the entire group of peroxide-affected transcripts, we looked for regulatory motifs or binding sites in the upstream region of the affected genes. As a result of this analysis, we found two motifs (Additional file 1) in the upstream region of a number of analyzed sequences. The first motif was found in 15 of the affected genes and had the consensus sequence of the lexA-DinR regulator in B. subtilis AGAACGTACGTTCG (Fig. 4) [16]. Within the group that contained this promotor sequence, we found well known stress-induced genes (ruvA, ruvB, lexA, rexA, rexB) [17]. These genes translate into proteins known from literature to be induced under conditions that cause DNA damage or blockage of DNA replication. Also transcripts with hypothetical functions (lp_0091, lp_0270, lp_0030, lp_2224 lp_2939 lp_3141, lp_0981, lp_3022 and lp_1611) contained the lexA-DinR consensus sequence. It is worth mentioning that these hypothetical transcripts are highly induced under hydrogen peroxide stress. For example, transcript lp_1611 was induced 32-fold as compared to the wild-type.
Figure 4.
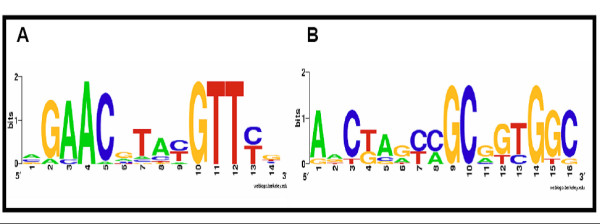
Weblogo representation of conserved promotor regions in peroxide affected genes found using bioinformatics tools A) Regulatory motif lexA-DinR and B) uncharacterized regulatory motif.
A second significant regulatory motif denoted here as the Stress Response element (SRE) was found in 7 genes had the consensus sequence AACTAGCCGCGGTGGC (Fig. 4). The important exonucleases: (rexA, rexB), a DNA polymerase (DNA polymerase III), the transcription regulator rnhB, a glycolytic gene (gapB), a cell envelope protein, and the hypothetical ORF's lp_0145 and lp_1484 contained this second promotor consensus To the best of our knowledge, this motif has not been reported before.
The same approach was applied to the data set containing the genes affected due to trxB1-overexpression. Yet, no significant regulatory motif was found. It can be concluded that genes belonging to the group of hypothetical transcripts (19%) responding to trxB1-overexpression do not share a clear single regulatory motif.
Comparison between oxidative stress response and the effect of trxB1 overproduction
Finally, we explored the crossover between the transcriptional response of TR over production with the transcriptional response obtained following hydrogen peroxide treatment of both wild-type and NZ7602. This exercise resulted in a list of 16 transcripts which are affected in both studied conditions (Table 4). The commonly affected transcripts constitute 59% of the transcripts found affected by a trxB1-overexpression (Table 3) and 6% of the genes affected by hydrogen peroxide stress (Additional file 1). From the 16 affected transcripts 94% of them (15) responded similarly to an over production of trxB1 as well as to a hydrogen peroxide pulse; these 15 transcripts were up regulated in both datasets. The up-regulated transcripts (15) have already been described and correspond to genes involved in stress related processes (npr2), energy metabolism (gapB), protein synthesis (tuf, rplB), manganese uptake (mntH2), purine biosynthesis (trxB1, and pur genes), putative transcript regulators (lp_1360, lp_0126) and unknown transcripts.
Table 4.
Crossover between genotype affected genes and hydrogen peroxide affected genes. Genes presented in this table are the common transcripts (16) between the two studied datasets: genotype and treatment. Further a summary of the regulation pattern for each of the depicted transcripts is given.
| FC1 | Transcript Behavior | ||||||
| Locus | genotype | treatment | Gene | Product | Main Functional Class | up | conflicting |
| lp_2716 | 1,6 | 0,7 | ica3 | glycosyltransferase (putative) | Cell envelope | • | |
| lp_0728 | 0,6 | 1,7 | groEL | GroEL chaperonin | Cellular processes | • | |
| lp_2544 | 1,6 | 5,0 | npr2 | NADH peroxidase | • | ||
| lp_3020 | 1,6 | 0,7 | tag2 | DNA-3-methyladenine glycosylase I | DNA metabolism | • | |
| lp_0789 | 1,7 | 1,8 | gapB | glyceraldehyde 3-phosphate dehydrogenase | Energy metabolism | • | |
| lp_1081 | 1,6 | 0,5 | unknown | Hypothetical proteins | • | ||
| lp_1611 | 2,1 | 32,9 | unknown | • | |||
| lp_1708 | 2,3 | 4,2 | unknown | • | |||
| lp_1880 | 3,9 | 2,9 | unknown | • | |||
| lp_2119 | 1,7 | 1,8 | tuf | elongation factor Tu | Protein synthesis | • | |
| lp_2721 | 1,5 | 3,1 | purN | phosphoribosylglycinamide formyltransferase | Purines, pyrimidines, nucleosides and nucleotides | • | |
| lp_2722 | 1,6 | 3,4 | purM | phosphoribosylformylglycinamidine cyclo-ligase | • | ||
| lp_2729 | 1,7 | 1,8 | purE | phosphoribosylaminoimidazole carboxylase, catalytic subunit | • | ||
| lp_0761 | 23,5 | 1,8 | trxB1 | thioredoxin reductase (NADPH) | • | ||
| lp_1087 | 1,8 | 0,6 | cation transport protein | Transport and binding proteins | • | ||
| lp_2992 | 2,6 | 1,8 | mntH2 | manganese transport protein | • | ||
1 FC is fold change or 2M
The only transcript found in both datasets that does not share the same regulation is groEL. This transcript is 0.6-fold down regulated as a result of the overexpresssion of trxB1 and 1.7-fold upregulated and in response to a hydrogen peroxide pulse.
In order to analyze the effect at the metabolic level, the datasets were superimposed showing they shared two major metabolic pathways: purine metabolism and cysteine biosynthesis.
Discussion
In this study, we have characterized the role of TR in oxidative stress response of Lactobacillus plantarum. We found that overproduction of TR in L. plantarum WCFS1 improved the tolerance of the strain towards an oxidative stress produced by hydrogen peroxide or diamide. Global transcriptome analysis revealed a striking similarity in response towards the overproduction of the oxidoreductase TR and hydrogen peroxide stress. Our observations suggest that overproduction of TR triggers the induction of a specific set of 16 transcripts associated with oxidative stress response. This may explain the phenotype of the trxB1-overexpression strain, which appears to be prepared for encountering oxidative stress. The transcripts correspond to genes involved in purine metabolism, protein synthesis, as well as in cellular and energy metabolism.
The global transcriptome analysis obtained from cultures affected by hydrogen peroxide stress and in the absence of heme, offers complementary information for the characterization of the kat, and pox genes in L. plantarum WCFS1. The catalase gene (kat) of L. plantarum WCFS1 is an ortholog of the well characterized manganese-dependent catalase in L. plantarum CNRZ 1288 [18]. Accordingly, in our dataset the kat transcript and mntH2, which codes for a manganese transporter, where both is significantly upregulated three- and two-fold respectively under hydrogen peroxide.
Hence, our transcriptome analysis only supports the fact that the gene catalase (kat) of L. plantarum WCFS1 may code a pseudocatalase, non-heme dependent catalase, under conditions of hydrogen peroxide stress. Furthermore, under hydrogen peroxide stress the highly upregulated pox transcripts (pox3 and pox5) encoding pyruvate oxidase were at first an intriguing observation. Pyruvate oxidase catalyzes a reaction that utilizes pyruvate, oxygen, phosphate, and water and produces intracellular hydrogen peroxide, carbon dioxide, and acetyl phosphate. Yet, in this study there was no oxygen added because the cultures were grown anaerobically. However, transcripts encoding the genes, catalase (kat) and NADPH peroxidase (npr2) were also found up regulated. If these two latter enzymes were to be active, they would liberate oxygen and water respectively from hydrogen peroxide and therefore explaining the observed behavior of pox3 and pox5 under hydrogen peroxide stress.
Hydrogen peroxide not only provokes up-regulation of genes at the transcriptome level. We also observed down-regulation of genes involved in main metabolic pathways: glycolysis, fatty acid biosynthesis, non ribosomal peptide biosynthesis, and amino acid metabolism. This observation suggests that in the presence of hydrogen peroxide stress, the cell responds to it with a reduction in biomass formation. The transcript data suggest that the pathways mentioned above are being kept temporarily "on hold" until the cell has detoxified form the oxidative stress inducing compounds. This reasoning was supported by metabolite analysis data showing interrupted lactate production after exposure to hydrogen peroxide (data not shown).
This study is the first to observe the impact of overproduction of TR at the transcriptome level in L. plantarum. The overexpression of trxB1 affects the expression level of genes involved in stress related processes, DNA/RNA biosynthesis, and sulfur containing amino acid biosynthesis. The resulting wide spectrum of pathways affected by TR has already been established. Research performed by Vido et al. on aerobic growth of Lactococcus lactis (2005) revealed that in L. lactis, TR is involved not only in oxidative stress but also in carbon and lipid metabolism [19].
Overproduction of TR in L. plantarum WCFS1 resulted in regulation of transcripts encoding heat shock and stress related genes. Especially the stress related gene which was found to be down regulated in strain NZ7602 (groEL) is previously reported to be induced in B. subtilis [20] under stress conditions (heat, salt, and ethanol) together with TRX. In addition, on transcript level trxA1, trxA2, trxA3, and trxH were not found significantly affected. This suggests that the protein TRX is not affected at the transcript level in strain NZ7602. Hence, the transcripts regarded as significantly affected in strain NZ7602 are more likely to be a response to the direct manipulation of the TR level and/or the protein load resulting from TR overproduction and not to the change in the TRX balance of the cell.
We have shown that transcript levels of gapB and glyceraldehyde-3-phosphate dehydrogenase (GAPDH) activity are significantly increased 1.7-fold and 3-fold, respectively, upon overexpression of trxB1 and hydrogen peroxide stress. GAPDH plays an important role and has been considered the key enzyme of glycolysis for its location in the pathway and the number of regulatory interactions associated with this enzyme. A correlation between the GAPDH and TR has already been reported in literature. Vido et al., 2005 [21] suggested that a disruption on the trxB1 gene in L. lactis leads to induction of only one of the two genes that code for the GAPDH protein, specifically gapB. Furthermore, the induced GapB was only present in the reduced form. This functionality prevents the formation of oxidized GapB and sustains formation of the reduced or active form of GAPDH. Interestingly, in our case the observed two-fold higher GAPDH activity is a result of overexpression of trxB1 in contrast to a disruption in trxB1 as reported by Vido et al [19] in L. lactis. Although overexpression of gapB in the strain NZ7602 results in higher reductase activity, the elevated transcript levels under oxidative stress were even more interesting. Studies from Van Niel et al., [22] show that the GAPDH protein is an easy target for oxidative stress (cysteine residues) and together with glucokinase, fructose 1–6 biphosphate, and aldolase has been found to be inhibited by 2.2 mM hydrogen peroxide in L. lactis [22]. Nevertheless, in our studies, we observed elevated GAPDH activity upon exposure to 3.5 mM hydrogen peroxide. Hence, we can suggest that the functionality of GAPDH is organism dependent. We suggest that overproduction of TR in L. plantarum WCFS1 protects the GAPDH under conditions of oxidative stress caused by hydrogen peroxide. However, more studies are needed to understand the role of TR in the regulation of the GAPDH activity.
Using bioinformatics tools we were able to uncover new main stress response ORF's in L. plantarum WCFS1. For example the hypothetical ORF lp_1611 which contains the regulatory motif lexA-dinR. The ORF lp_1611 was found to be up regulated 32-fold under hydrogen peroxide stress. This ORF is located adjacent to the glycine ABC transporter operon just in the opposite direction of the opu genes. The position and direction of lp_1611 may suggest a role as a regulator of transcription; nevertheless, more analysis such as finding the DNA binding region and activity in the protein need to be conducted.
Another group of oxidative-stress-affected genes contains a second regulatory motif that we have termed SRE. In this group we found three genes that had already been defined as lexA-dinR regulated genes (rexA, rexB, recA). Moreover, in the group of genes containing the second motif, we found genes involved in primary energy metabolism (gapB) and protein synthesis (rnhb) implying that there is at least one more regulatory mechanism induced in L. plantarum WCFS1 upon oxidative stress. We did not find a unique regulatory motif or SRE motif element in the group of genes affected by overproduction of TR. This reflects the complexity of the regulatory mechanisms associated with TRX or TR. Perhaps, these up-regulated genes are governed by a complex network of signal transduction events which is initiated by the TRX system. Hence, we suggest the set of 16 genes is part of the TR-specific defense mechanism of L. plantarum WCFS1 against oxidative stress.
In summary, we have presented evidence that TR is a factor in the oxidative stress response in L. plantarum WCFS1. Our transcriptome data suggest that the TRX system (trxA2 and trxB1) is induced under hydrogen peroxide stress in L. plantarum WCFS1. Moreover, the discovery of a crossover-group of genes with a common response under hydrogen peroxide stress, especially DNA-repairing and stress transcripts, including the pur genes, npr2, and gapB, leads to the hypothesis that overproduction of TR results in a "mock-stress-mode." As a result under TR overproduction, 16 transcripts encoding genes involved in purine biosynthesis, cell wall biosynthesis, energy metabolism, cellular envelope biosynthesis, amino acid metabolism are activated. The activation of these genes provides an explanation of why strain L. plantarum NZ7602 is better adapted to a challenge with hydrogen peroxide stress in comparison to the wild-type. The observed crossover between TR overproduction and hydrogen peroxide stress contributes essential information to understand the oxidative stress related signal transduction cascade in L. plantarum. Nevertheless, this study clearly needs to be followed up with experiments showing the effect, on the group of 16 transcripts resulting from an inactivation of trxB1 in L. plantarum. New leads concerning catalase (kat) and the GAPDH protein emerged from our transcriptome dataset. These leads will be further studied. Using regulatory motif searches we identified a known stress regulatory element: lexA-dinR and also a new motif: AACTAGCCGCGGTGGC (Fig. 4). Finally, transcription profiling also revealed new actors such as the uncharacterized ORF lp_1611 which seems to play a role in the oxidative stress response in L. plantarum WCFS1. Current investigations aim at pinpointing the role of TR in the oxidative stress response.
Methods
Bacterial strains, plasmids, media, and culture conditions
The bacterial strains used in this study are summarized in Table 5. E. coli strains were grown at 37°C in TY [23]. Lactococcus lactis was grown in M17 at 30°C and L. plantarum WCFS1 was grown at 37°C in de Man-Rogosa-Sharp (MRS) or in Chemically Defined Medium (CDM) [24].
Table 5.
Bacterial strains and plasmids used in this study.
| Strain and Plasmids | Characteristics | Reference |
| Strains | ||
| E. coli DH5α | ||
| E. coli E10 | ||
| L. lactis NZ9000 | MG1363 pepn::nisRK | [35, 36] |
| L. plantarum WCFS1 | Sequenced wild-type strain single colony isolate of NCIMB8826 form human saliva. | [10] |
| NZ7100 | L. plantarum WCFS1 derivative with chromosomal integration of pEMnisRK plasmid. | This work |
| NZ7606 | CmR, L. plantarum NZ7100 derivative carrying the pNZ8150 plasmid. | This work |
| NZ7601 | CmR, L. plantarum NZ7100 derivative carrying the pMS011 plasmid. | This work |
| NZ7607 | CmR, L. plantarum WCFS1 derivative carrying the pNZ7021 plasmid. | This work |
| NZ7602 | CmR, L. plantarum WCFS1 derivative carrying the pMS040 plasmid. | This work |
| Plasmids | ||
| pUC18Ery | AmpR, EmR | [26] |
| pACYC184 | CmR, TetR | [37] |
| pNZ84 | CmR, pACYC184 derivative with deletion of Tetracycline resistance gene and BamhI site. | [38] |
| pNZ9521 | EmR, nisRK cloned in pIL253, expression of nisRK driven by rep read-through. | [27] |
| pNZ7130 | AmpR, EmR pUC18EM derivative carrying 1.0 kb DNA fragments of both L. plantarum WCFS1 lp_0075 and lp_0077 genes. | This work |
| pNZ7131 | AmpR, EmR, pNZ7130 derivative with extra cloning sites Nsa1 and NsiI. | This work |
| ppNZ7132 | CmR, Em R, pNZ84 derivative carrying 1.0 kb DNA fragments of L. plantarum WCFS1 (lp_0075) and (lp_0077) genes and the EryR resistance marker. | This work |
| pNZ7133 | CmR, Em R p7132 derivative carrying the whole genes nisRK from L. lactis. | This work |
| pNZ8150 | CmR, pNZ8148 derivative lactococcal cloning and expression vector with nisA promoter upstream of a multiple cloning site and Sca1 restriction site. | [39] |
| pMS011 | CmR, pNZ8150 derivative carrying L. plantarum (lp_0761) trxB1 gene, translation fused to the nisA promoter. | This work |
| pNZ7021 | CmR, pNZ8148 derivative carrying nisA::pepN. | [40] |
| pMS040 | CmR, pNZ7021 derivative carrying L. plantarum lp_0761 trxB1 gene, translational fused to the pPEPN promoter. | This work |
DNA Manipulations
All molecular biology techniques were performed following established protocols by Sambrook [23]. DNA was digested according to the conditions recommended by the commercial suppliers of the restriction enzymes (Boehringer, Breda, The Netherlands). In all cases, DNA was eluted from 0.7% agarose gels using the Purification Kits from Promega (Leiden, The Netherlands). For a Polymerase chain reaction (PCR) we used: 1 μl template DNA (10 to 100 ng), 2 μl of each primer combination (50 ng/ml), 1 μl dNTP's (100 nM), 1 μl Pwo-polymerase (5 U/μl) and 10 μl polymerase buffer (5×) (Roche, Woerden, The Netherlands). The reaction mixtures were adjusted to 50 μl with deionized H2O.
Construction of strain L. plantarum NZ7100
Previously it has been established that the nisin controlled expression system can be functionally implemented in L. plantarum, by chromosomal integration of the regulatory module encoding genes nisRK [25]. However, the strain described by Pavan et al. harbors an erythromycin resistance marker. Therefore, a chromosomal lp_0076:::nisRK gene replacement without resistance marker was constructed. For this purpose, lp_0076 upstream and downstream flanking regions were amplified by proofreading PCR using genomic DNA of L. plantarum WCFS1 as template. The primers used to amplify the 5'- and 3'-regions of lp_0075 and lp_0077 respectively were lp_0075-FORW and lp_0075-REV; lp_0077-FORW and lp_0077-REV, shown in Table 6. The PCR amplicons obtained were digested with EcorI-BamhI, and BamhI-XbaI (sites introduced in the primers used are underlined in Table 6) and cloned into a EcoRI-XbaI digested pUC18Em [26]. The genetic organization of the resulting plasmid was verified by PCR and was designated pNZ7130. To introduce additional endonuclease restriction sites in pNZ7130 the multiple cloning sites containing fragment was amplified by PCR using the primers EM1 and EM2 (Table 6). The resulting amplicon (35 bp) was digested with BamhI and BglII and cloned in BamhI digested pNZ7130, yielding pNZ7131. The 2.6 kb HindII fragment of pNZ7131 that contains the lp_0076 flanking regions separated by the multiple cloning site and the erythromycin resistance encoding gene, was subcloned in vector pNZ84, yielding the lp_0076 replacement vector pNZ7132. The lp_0076::nisRK replacement plasmid pNZ7133 was constructed by cloning of the 2.4 kb HpaII-PstI fragment of pNZ9521 [27] into the NsaI-NsiI digested pNZ7132. The plasmid pNZ7133 was introduced into L. plantarum WCFS1 and primary integrants were selected on basis of erythromycin resistance. The anticipated configuration of the pNZ7133 plasmid integration in the lp_0076 locus was confirmed by PCR and Southern blotting (data not shown). One of the integrants was cultured for 140 generations without antibiotic selection. Subsequently, erythromycin sensitive (EmS) colonies were identified by plating on media without erythromycin followed by replication plating on erythromycin containing plates. In the EmS colonies identified, a candidate lp_0076::nisRK replacement mutant was identified by PCR using internal primers in NisK and Orfx (data not shown). In a selected candidate lp_0076::nisRK strain, the anticipated genetic organization of the lp_0076::nisRK locus was further confirmed by additional PCR and Southern blot analyses (data not shown). The lp_0076::nisRK derivative of L. plantarum WCFS1 was designated NZ7100.
Table 6.
Oligonucleotides used in this study. Designed restriction sites in the primers are shown underlined in the table.
| Oligonucleotides (5'-3') | Sequence | References |
| Lp_0075-FORW | ACGTGAATTCCAGTTCAACTAGAACAAGC | |
| Lp_0075-REV | ACGTGGATCCTACAATCCGTTTCATATTG | |
| Lp_0077-FORW | ACGTGGATCCAAGGCGTCATCAAAATAG | |
| Lp-0077-REV | ACGTTCTAGACGCAATTTTCTTCACATTAC | |
| EM1 | GGATCCGTTAACGAATTCGGCGCGCCGGCGCCA | |
| EM2 | AGATCTGGCGCCGGCGCGGCGAATTCGTTAACG | |
| trxB1-FORW | ATGGCAAAGAGTTACGACG | |
| trxB1-REV | GTTGCATGCTCAATTAA ATCAGCTACGC | |
| trxB1-300 | TTC AGA ACC AGT CCC AAT GAC | |
| trxB1-KPN1FORW | CGCCCACGGTACCATGGCAAAGAGTTACGACG | |
| trxB1-XBA1REV | CGCGCCTCTAGACTCAATTAAATCAGCTACGC | |
| trxA1-FORW | ATGATCGAACCAGTCGATAAG | |
| trxA1-REV | TTAGGCAGGCTTC ACTTC | |
| trxA2-FORW | ATGGTCGCAGCAACTACTG | |
| trxA2-REV | TTATAGATA TTGAGCTAAAGTTTG | |
| trxA3-FORW | ATGATTAAAGAAATACATGACC | |
| trxA3-REV | TTAAGCAAGTGCTTTTTTGAGTTC | |
| trxH-FORW | ATGGCAACTGCA ACTTTAAG | |
| trxH-REV | CTACTTTTCAAGTGTATCTAAG | |
| trxB2-FORW | ATGAGTGCAGAATATGATTTAAC | |
| trxB2-REV | CGGGTACCCCGGTTTCTCGTCCTATTTGC | |
| trxB2-truncFORW | ATT CGG ATC CGT AGT CTC TGC AAG TTG C | |
| trxB2-truncREV | TTT GCG GTA CCA CAG AAT ATG ATT TAA CAA TTA |
Construction of trxB1 over-expressing strains NZ7601 and NZ7602
NZ7601
The gene trxB1 in L. plantarum WCFS1 was amplified by Pwo-polymerase using genomic DNA from L. plantarum WCFS1 as template and two primers: trxB1-FORW and trxB1-REV with a SphI restriction site (site introduced in the primer used; underlined Table 6). The amplified DNA fragment was cloned into the linearized vector pNZ8150. The complete plasmid, designated pMS011, was cloned and purified from L. lactis NZ900 cells [28] displaying chloramphenicol resistance (CmR) and introduced into L. plantarum NZ7100. The plasmid isolated form the L. plantarum colonies displaying CmR were checked by restriction and sequencing analysis. One of these transformants containing the L. plantarum trxB1 gene translationally fused to the nisA promoter was denominated NZ7601.
NZ7602
The gene trxB1 in L. plantarum WCFS1 was amplified by Pwo-polymerase using genomic DNA from L. plantarum WCFS1 as template and two primers: trxB1-KPNFORW and trxB1-XBA1REV containing a Kpn1 and Xba1 site, respectively. The amplified fragment was purified from the gel and cloned into the digested vector pNZ7021. The complete plasmid, pMS040, was cloned and isolated from L. lactis NZ9000 colonies displaying CmR From the colonies displaying CmR plasmid was isolated and checked by restriction and PCR analysis. Then, purified plasmid pMS040 was inserted into L. plantarum NZ7100 [29]. These transformants contained the trxB1 gene translationally fused with the constitutive PpepN promoter [15] and one of this colonies was denominated NZ7602.
Control strains NZ7606 and NZ7607
In the experiments with the nisin inducible promoter we used as control strain NZ7606, a L. plantarum NZ1700 strain containing the pNZ8150 vector. On the other hand, for the chemostat studies strain NZ7607 was used as control. Strain NZ7607 is L. plantarum WCFS1 containing the pNZ7021 vector.
Nisin Induction
Nisin induction was done as previously described by Pavan et al [25] using 50 ng/ml nisin for induction.
Quantitative PCR assays
Total RNA was isolated from exponentially growing L. plantarum WCFS1 cultures with the High Pure RNA Isolation Kit (Roche, Woerden, The Netherlands). To eliminate genomic DNA contamination a 60 min DNAse I treatment was included in the isolation procedure. Furthermore, the quality and quantity of the RNA was confirmed using the RNA 6000 Nano Assay (Agilent Technologies, Amstelveen, The Netherlands) using the Agilent 2100 expert Bioanalyzer. Cultures of the bacterium were grown in anaerobic jars on CDM containing 5 mM Diamide at 37°C, or CDM containing 5 mM DTT at 37°C and 30°C. In all cases 0.5% (w/v) glucose was added as carbon source. For the reverse transcription reaction 200 ng RNA was incubated at 65°C for 5 minutes with 270 ng random nonamers, and 1 μl of 10 mM dNTP mixture. After 5 minutes on ice, the following was added: 5 μl 5 × First strand Buffer, 2 μl 0.1 M DTT, 1 μl Superscript III (200 UNITS), 1 μl RNASEout (40 UNITS) (all Invitrogen) and water to a final volume of 20 μl. The reaction was incubated at 25°C for 5 min and then at 50°C for 60 min. The reaction was inactivated by heating at 70°C for 15 min. Generated cDNA samples were stored at -20°C until use. Quantitative PCR amplification was performed in 96-well plate on a 7500 Fast System (Applied Biosystems), using SYBR green for product detection. Each well contained 10 μl SYBR green Master Mix (Applied Biosystems), 200 nM of Reverse and forward primers, and 1 μl of 10-fold or 100-fold diluted RT product as template. The qPCR gene-specific probes of L. plantarum WCFS1 of trxA1 (0.3 kb), trxA2 (0.3 kb), trxA3 (0.3 kb), trxH (0.3 kb), trxB1 (0.3 kb), and trxB2 (0.6 kb) were amplified using specific primer combinations trxA1-FORW and trxA1-REV; trxA2-FORW and trxA2-REV; trxA3-FORW and trxA3-REV; trxH-FORW and trxH-REV; trxB1-FORW and trxB1-300; trxB2-truncFORW and trxB2-truncREV. All primers are specified in Table 6. Amplification was initiated at 95°C for 10 min, followed by 40 cycles of 95°C for 15 sec, 53°C for 30 sec and 60°C for 60 sec for probes trxA1, trxA3 and trxH. For the other probes (trxA2, trxB1, and trxB2) the step of 53°C for 30 sec was changed to 55°C for 30 sec. All samples were measured in duplicate. Control PCRs were included to detect background contamination (no-template control) and remaining chromosomal DNA (RT reactions in which enzyme superscript III was not added). PCR specificity and product detection were checked post amplification by examining the dissociation curves of the PCR products. These melting curve profiles were generated by first heating the samples to 95°C and then cooling them to 60°C and slowly heating then at 2°C/min to 95°C for detection of SYBR green fluorescence. In each run, five standards of the gene of interest were included with appropriate dilutions of the cDNA, to determine the cDNA concentration in the samples. All q-PCRs amplified a single product as determined by the melting curve analysis and the releative expression level is given as arbitrary units (Au).
Growth curves. For the growth experiments, 96-well plates were used. Each well was filled with 200 μl medium and 10 μl growing cells (OD600 of 1.0). The 96-well plates were inoculated at 37°C and cell density was measured by detecting the turbidity of the cultures at 600 nm every 10 min. To study oxidative stress response, either diamide (5 mM) or hydrogen peroxide (3.5 mM) was added to the medium.
Growth-zone inhibition assays
Cultures were grown at 37°C in MRS until OD600 of 0.4. At this point, 2.5 ml of culture was plated by mixing with 50 ml of 0.7% Agarose MRS at 40°C. After the agar/culture plates hardened, perforations of 6 mm diameter were made. In each of these apertures, 30 μl of solution (1 M, 0.5 M, 0.25 M and 0.10 M) of diamide or (1 M, 0.5 M) hydrogen peroxide was added. Plates were incubated overnight at 37°C. The growth inhibition towards the oxidative stress agents was measured as the radius of growth inhibition expressed in centimeters.
Preparation of cell free extracts (CFE)
Cells of a growing culture OD600 of 1.0 (approx. 10 ml) were harvested by centrifugation at 12.000 × g for 10 minutes at 4°C. The pellet was washed twice with 1 M Tris-HCl buffer pH = 7.5. Next, the cells were suspended in 1 ml of 1 M Tris-HCl buffer pH = 7.5 and disrupted by Fastprep (Qbiogene Inc., Illkirch, France) in four treatments of 40 seconds at speed 4.0. The suspension was centrifuged 2 min at maximum speed and the supernatant or CFE was transferred to a new vial and used directly. Protein content of the CFE was determined through the standard BCA Protein Assay kit (Pierce, Etten-Leur, The Netherlands).
Thioredoxin reductase enzyme assays
The reaction mixture (RM) was prepared by mixing (in ice) 200 μl of 1 M Tris-HCl, pH = 7.5, 500 μl of insulin (10 μg/μl), 2.5 μl EDTA pH = 7.5 (0.2M), and 40 μl NADPH (40 mg/ml). For each enzymatic reaction 40 μl RM were used together with 20 μl TRX (60 μM) from E. coli (Sigma), and 80 μl CFE. Each reaction was incubated for 25 minutes at 37°C; after this 500 μl of 6M Guanidine HCl/0.2 M Tris-HCl, pH = 7.5/1 mM DTNB was added. The final absorbance at 412 nm was measured at 25°C. Note that the extinction coefficient of DTNB reduction is 13.6 mM-1 and that there are two molecules of TNB per molecule DTNB being reduded. The background signal in the assay was determined in the absence of TRX in one of the assays. TR activity was expressed as nmol of DTNB·(min·mg protein)-1 and calculated as follows: Δabs412·(0.620)·(protein content)-1·2·(εDTNB)-1·10^6.
Glyceraldehyde-3-phosphate dehydrogenase enzyme assay
The assay mixture contained: triethanolamine-HCl buffer (pH 7.6), 100 mM; ATP, 1 mM; EDTA, 1 mM; MgSO4, 1.5 mM; NADH, 0.15 mM; phosphoglycerate kinase 22.5 U (Boehringer, Breda, The Netherlands); and CFE. The reaction was started with 5 mM 3-phosphoglycerate. The absorption of the assay mixture was monitor at 340 nm (E340 nm of reduced pyridine-dinucleotide cofactors is 6.3 mM-1). Enzyme activity is expressed as μM of amount of NADH converted per (min·mg protein)-1. All assays were performed with two concentrations of cell extract to confirm that reaction rates were proportional to the amount of cell extract added. Protein content of the CFE was determined through the standard BCA Protein Assay kit.
Continuous cultivations
Cultures were grown at 37°C in CDM [24] which was supplemented with 100 mM glucose and 10 μg/ml of chloramphenicol. A 1 Liter bioreactor (Applikon Dependable Instruments) was inoculated with cells from an overnight culture to an initial OD600 of 0.1 in 500 ml medium. A pH of 5.5 was maintained by the addition of 5 M NaOH and the stirrer speed was set at 200 rotations per minute (rpm). The headspace of the fermentors and medium vessel were full at all times with nitrogen gas at a flow rate of 520 ml·min-1. The cultures were kept at the dilution rate of 0.1 h-1 and steady state was assumed after 5 volume changes. At steady state or (t0), samples were taken for transcriptomics, HPLC analysis, dry weight, and enzyme samples. In addition, at steady state, 50 ml of hydrogen peroxide was added to the fermentors resulting in a final concentration of 3.5 mM in the fermentor. After 30 min (t30), samples were taken for transcriptomics, HPCL analysis, and enzymatic analysis.
Microarrays
RNA isolation
A 40 ml L. plantarum WCFS1 culture at steady state was added to 160 ml of quenching buffer [30] (60% methanol, 66.7 mM HEPES; pH 6.5; 40°C). Following quenching, the cells were immediately pelleted by centrifugation at 18.000 × g for 10 min at 20°C. The pellet was resuspended in a screw cap tube containing in 0.4 ml TE, 250 μl acidic phenol, 250 μl chloroform, 30 μl 3 M sodium acetate pH 5.2, 30 μl 10% sodium dodecyl sulphate, and 1 gram glass beads. The tube was immediately frozen in liquid nitrogen and samples were stored at -80°C. The cells were disrupted with three subsequent 40 second treatments separated by 1 min on ice in a Fastprep (Qbiogene Inc., Illkirch, France). After disruption, 0.5 ml of the aqueous phase was used for RNA isolation with a High Pure kit, which included 1 h of treatment with DNase I (Roche Diagnostics, Mannheim; Germany). The isolated RNA was eluted in 50 μl of elution supplied in the kit.
cDNA synthesis and purification
Before first-strand cDNA synthesis, the absence of genomic DNA and RNA degradation in the RNA samples was confirmed using the RNA 6000 Nano Assay (Agilent Technologies, Amstelveen, The Netherlands) using the Agilent 2100 expert Bioanalyzer. First-strand cDNA synthesis was carried out by the CyScribe Post-Labelling and Purification kit (Amersham Biosciences, Buckinghamshire, UK) following the manufacturer's instructions with two modifications. The starting amount of mRNA used per sample was 25 μg and the synthesis reactions were incubated for 3 h at 42°C.
Data acquisition and processing
Two independent chemostat cultivations were performed for both wild type and trxB1 over-expression strain. Three hybridization experiments, all with the same hybridization scheme (see below), were performed with samples obtained from these chemostats before and after treatment with hydrogen peroxide. Two of these experiments used samples obtained from the same fermentation. In each experiment three arrays were used. Per array two cDNA labeled targets were hybridized on custom designed L. plantarum WCFS1 11 K Agilent oligo microarrays (GEO Acc. Nr. GPL4318) using the Agilent 60-mer oligo microarray processing protocol version 4.1. These microarrays contained an average of three probes per gene. The hybridization scheme contained the following cDNA comparisons (1) wildtype with trxB1 over-expression mutant; (2) wildtype with wildtype treated with hydrogen peroxide; and (3) wildtype treated with hydrogen peroxide with trxB1 over-expression mutant treated with hydrogen peroxide. Dried slides were scanned in the Scan Array Express (PerkinElmer Life Sciences; Packard Bioscience) at 10 microns. Spot intensity data was quantified (average intensity) in ImaGene version 5.0 (BioDiscovery, Inc., El Segundo, CA). Signal intensities of all probes were corrected against background and normalized by fitting a plot of M (= 2log [cy5 intensity/cy3 intensity]) against A (= 0.5·2log [cy5 intensity·cy3 intensity]) using the lowess algorithm in BASE [31]. The normalized data has been made available with GEO Acc. Nr. GSE8348. The fold change (FC) is defined as 2M. For the statistical analysis we used microarray analysis of variation (R/maanova) [32]. In this maanova test we used three variables: fermentation, treatment, and genotype. Moreover we tested the model taking into consideration the interaction between genotype and treatment. The maanova test resulted only in two sets of interesting data because the interaction effect did not reveal significant changes in transcript levels. One dataset representing the transcripts affected as a result of the overproduction of TR and another set representing the transcripts affected due to oxidative stress. These two datasets were denominated genotype and hydrogen peroxide datasets respectively. Significantly regulated genes within each dataset were defined as genes whose nominal pvalues were less than 1% and had a fold change equal or higher than 1.5.
Regulatory Motifs
Determination of regulatory motifs from a list of genes was based on predictions of upstream transcriptional units (TU's) made using an in-house Python program, alignments of these TU's using the MEME [33] and determining of nucleotide sequences using the MAST software [34] tools. The MEME software determines through alignments small motifs which are present in the analyzed sequences and assigns a significant value, Evalue, and score per position. This significant value represents how well preserved the motif is, the number of TU's that this motif has, and the conserved position of the motif in the analyzed TU's. The MAST software allows searching for the motif in the genome of interest.
Competing interests
The authors(s) declare that they have no competing interests.
Authors' contributions
The presented experimental work was performed by LMS, a PhD scholar working under the supervision of ES and WdV. PB constructed strain NZ7100. DM performed the statistical analysis of the microarrays. Regulatory Motif search was done by MW. For the visualization of transcriptome data we used the genome scale model of L. plantarum WCFS developed by BT. All authors read and approved the final manuscript.
Supplementary Material
Global transcriptome response towards hydrogen peroxide stress in L. plantarum strains NZ7607 and NZ7602. Significantly affected genes (267) due to hydrogen peroxide stress both in strains NZ7607 and NZ7602 (pvalue < 0.01 & FC ≥ 1.5). Predicted gene names, function, fold change induction as well as main class of the genes are displayed in column one and three respectively. Main functional classes presented in bold are those classes found overrepresented in this study when compared to the total genome of L. plantarum.
Contributor Information
L Mariela Serrano, Email: mariela.hebben@nizo.nl.
Douwe Molenaar, Email: douwe.molenaar@nizo.nl.
Michiel Wels, Email: michiel.wels@nizo.nl.
Bas Teusink, Email: bas.teusink@nizo.nl.
Peter A Bron, Email: pdebintheusa@hotmail.com.
Willem M de Vos, Email: devos@tifn.nl.
Eddy J Smid, Email: eddy.smid@nizo.nl.
References
- Laurent TC, Moore EC, Reichard P. Enzymatic Synthesis of Deoxyribonucleotides. Iv. Isolation and Characterization of Thioredoxin, the Hydrogen Donor from Escherichia Coli B. J Biol Chem. 1964;239:3436–3444. [PubMed] [Google Scholar]
- Arner ES, Holmgren A. Physiological functions of thioredoxin and thioredoxin reductase. Eur J Biochem. 2000;267:6102–6109. doi: 10.1046/j.1432-1327.2000.01701.x. [DOI] [PubMed] [Google Scholar]
- Prieto-Alamo MJ, Jurado J, Gallardo-Madueno R, Monje-Casas F, Holmgren A, Pueyo C. Transcriptional regulation of glutaredoxin and thioredoxin pathways and related enzymes in response to oxidative stress. J Biol Chem. 2000;275:13398–13405. doi: 10.1074/jbc.275.18.13398. [DOI] [PubMed] [Google Scholar]
- Stoyanovsky DA, Tyurina YY, Tyurin VA, Anand D, Mandavia DN, Gius D, Ivanova J, Pitt B, Billiar TR, Kagan VE. Thioredoxin and lipoic acid catalyze the denitrosation of low molecular weight and protein S-nitrosothiols. J Am Chem Soc. 2005;127:15815–15823. doi: 10.1021/ja0529135. [DOI] [PubMed] [Google Scholar]
- Jobin MP, Garmyn D, Divies C, Guzzo J. Expression of the Oenococcus oeni trxA gene is induced by hydrogen peroxide and heat shock. Microbiology. 1999;145:1245–1251. doi: 10.1099/13500872-145-5-1245. [DOI] [PubMed] [Google Scholar]
- Scharf C, Riethdorf S, Ernst H, Engelmann S, Volker U, Hecker M. Thioredoxin is an essential protein induced by multiple stresses in Bacillus subtilis. J Bacteriol. 1998;180:1869–1877. doi: 10.1128/jb.180.7.1869-1877.1998. [DOI] [PMC free article] [PubMed] [Google Scholar]
- Vignols F, Brehelin C, Surdin-Kerjan Y, Thomas D, Meyer Y. A yeast two-hybrid knockout strain to explore thioredoxin-interacting proteins in vivo. Proc Natl Acad Sci USA. 2005;102:16729–16734. doi: 10.1073/pnas.0506880102. [DOI] [PMC free article] [PubMed] [Google Scholar]
- Holmgren A. Thioredoxin. Annu Rev Biochem. 1985;54:237–271. doi: 10.1146/annurev.bi.54.070185.001321. [DOI] [PubMed] [Google Scholar]
- Li Y, Hugenholtz J, Sybesma W, Abee T, Molenaar D. Using Lactococcus lactis for glutathione overproduction. Appl Microbiol Biotechnol. 2005;67:83–90. doi: 10.1007/s00253-004-1762-8. [DOI] [PubMed] [Google Scholar]
- Kleerebezem M, Boekhorst J, van Kranenburg R, Molenaar D, Kuipers OP, Leer R, Tarchini R, Peters SA, Sandbrink HM, Fiers MW, et al. Complete genome sequence of Lactobacillus plantarum WCFS1. Proc Natl Acad Sci USA. 2003;100:1990–1995. doi: 10.1073/pnas.0337704100. [DOI] [PMC free article] [PubMed] [Google Scholar]
- Molenaar D, Bringel F, Schuren FH, de Vos WM, Siezen RJ, Kleerebezem M. Exploring Lactobacillus plantarum genome diversity by using microarrays. J Bacteriol. 2005;187:6119–6127. doi: 10.1128/JB.187.17.6119-6127.2005. [DOI] [PMC free article] [PubMed] [Google Scholar]
- Seo D, Kamino K, Inoue K, Sakurai H. Purification and characterization of ferredoxin-NADP+ reductase encoded by Bacillus subtilis yumC. Arch Microbiol. 2004;182:80–89. doi: 10.1007/s00203-004-0701-5. [DOI] [PubMed] [Google Scholar]
- de Ruyter PG, Kuipers OP, de Vos WM. Controlled gene expression systems for Lactococcus lactis with the food-grade inducer nisin. Appl Environ Microbiol. 1996;62:3662–3667. doi: 10.1128/aem.62.10.3662-3667.1996. [DOI] [PMC free article] [PubMed] [Google Scholar]
- Leichert LI, Scharf C, Hecker M. Global characterization of disulfide stress in Bacillus subtilis. J Bacteriol. 2003;185:1967–1975. doi: 10.1128/JB.185.6.1967-1975.2003. [DOI] [PMC free article] [PubMed] [Google Scholar]
- Tan PS, van Alen-Boerrigter IJ, Poolman B, Siezen RJ, de Vos WM, Konings WN. Characterization of the Lactococcus lactis pepN gene encoding an aminopeptidase homologous to mammalian aminopeptidase N. FEBS Lett. 1992;306:9–16. doi: 10.1016/0014-5793(92)80827-4. [DOI] [PubMed] [Google Scholar]
- Winterling KW, Chafin D, Hayes JJ, Sun J, Levine AS, Yasbin RE, Woodgate R. The Bacillus subtilis DinR binding site: redefinition of the consensus sequence. J Bacteriol. 1998;180:2201–2211. doi: 10.1128/jb.180.8.2201-2211.1998. [DOI] [PMC free article] [PubMed] [Google Scholar]
- Winterling KW, Levine AS, Yasbin RE, Woodgate R. Characterization of DinR, the Bacillus subtilis SOS repressor. J Bacteriol. 1997;179:1698–1703. doi: 10.1128/jb.179.5.1698-1703.1997. [DOI] [PMC free article] [PubMed] [Google Scholar]
- Abriouel H, Herrmann A, Starke J, Yousif NM, Wijaya A, Tauscher B, Holzapfel W, Franz CM. Cloning and heterologous expression of hematin-dependent catalase produced by Lactobacillus plantarum CNRZ 1228. Appl Environ Microbiol. 2004;70:603–606. doi: 10.1128/AEM.70.1.603-606.2004. [DOI] [PMC free article] [PubMed] [Google Scholar]
- Vido K, Diemer H, Dorsselaer AV, Leize E, Juilard V, Gruss A, Gaudu P. Roles of Thioredoxin Reductase during the Aerobic Life of Lactococcus lactis. Journal of Bacteriology. 2005;187:601–610. doi: 10.1128/JB.187.2.601-610.2005. [DOI] [PMC free article] [PubMed] [Google Scholar]
- Scharf C, Riethdorf S, Ernst H, Engelmann S, Volker U, Hecker M. Thioredoxin is an essential protein induced by multiple stresses in Bacillus subtilis. J Bacteriol. 1998;180:1869–1877. doi: 10.1128/jb.180.7.1869-1877.1998. [DOI] [PMC free article] [PubMed] [Google Scholar]
- Vido K, Diemer H, Van Dorsselaer A, Leize E, Juillard V, Gruss A, Gaudu P. Roles of thioredoxin reductase during the aerobic life of Lactococcus lactis. J Bacteriol. 2005;187:601–610. doi: 10.1128/JB.187.2.601-610.2005. [DOI] [PMC free article] [PubMed] [Google Scholar]
- van Niel EW, Hofvendahl K, Hahn-Hagerdal B. Formation and conversion of oxygen metabolites by Lactococcus lactis subsp. lactis ATCC 19435 under different growth conditions. Appl Environ Microbiol. 2002;68:4350–4356. doi: 10.1128/AEM.68.9.4350-4356.2002. [DOI] [PMC free article] [PubMed] [Google Scholar]
- Sambrook JF, EF , Maniatis T. Molecular Cloning: A Laboratory manual. 2. 1–3. Cold Spring Harbor, New York: Cold Spring Harbor Laboratory Press; 1989. [Google Scholar]
- Teusink B, van Enckevort FH, Francke C, Wiersma A, Wegkamp A, Smid EJ, Siezen RJ. In silico reconstruction of the metabolic pathways of Lactobacillus plantarum: comparing predictions of nutrient requirements with those from growth experiments. Appl Environ Microbiol. 2005;71:7253–7262. doi: 10.1128/AEM.71.11.7253-7262.2005. [DOI] [PMC free article] [PubMed] [Google Scholar]
- Pavan S, Hols P, Delcour J, Geoffroy MC, Grangette C, Kleerebezem M, Mercenier A. Adaptation of the nisin-controlled expression system in Lactobacillus plantarum: a tool to study in vivo biological effects. Appl Environ Microbiol. 2000;66:4427–4432. doi: 10.1128/AEM.66.10.4427-4432.2000. [DOI] [PMC free article] [PubMed] [Google Scholar]
- van Kranenburg R, Marugg JD, van S, II, Willem NJ, de Vos WM. Molecular characterization of the plasmid-encoded eps gene cluster essential for exopolysaccharide biosynthesis in Lactococcus lactis. Mol Microbiol. 1997;24:387–397. doi: 10.1046/j.1365-2958.1997.3521720.x. [DOI] [PubMed] [Google Scholar]
- Kleerebezem M, Beerthuyzen MM, Vaughan EE, de Vos WM, Kuipers OP. Controlled gene expression systems for lactic acid bacteria: transferable nisin-inducible expression cassettes for Lactococcus, Leuconostoc, and Lactobacillus spp. Appl Environ Microbiol. 1997;63:4581–4584. doi: 10.1128/aem.63.11.4581-4584.1997. [DOI] [PMC free article] [PubMed] [Google Scholar]
- Holo H, Nes IF. High-Frequency Transformation, by Electroporation, of Lactococcus lactis subsp. cremoris Grown with Glycine in Osmotically Stabilized Media. Appl Environ Microbiol. 1989;55:3119–3123. doi: 10.1128/aem.55.12.3119-3123.1989. [DOI] [PMC free article] [PubMed] [Google Scholar]
- Josson K, Scheirlinck T, Michiels F, Platteeuw C, Stanssens P, Joos H, Dhaese P, Zabeau M, Mahillon J. Characterization of a gram-positive broad-host-range plasmid isolated from Lactobacillus hilgardii. Plasmid. 1989;21:9–20. doi: 10.1016/0147-619X(89)90082-6. [DOI] [PubMed] [Google Scholar]
- Pieterse B, Jellema RH, van der Werf MJ. Quenching of microbial samples for increased reliability of microarray data. J Microbiol Methods. 2006;64:207–216. doi: 10.1016/j.mimet.2005.04.035. [DOI] [PubMed] [Google Scholar]
- Saal LHTC, Vallon-Christersson J, Gruvberger S, Borg A, Peterson C. "BioArray Software Environment (BASE): a platform for comprehensive management and analysis of microarray data.". Genome Biol. 2002;3:SOFTWARE0003. doi: 10.1186/gb-2002-3-8-software0003. [DOI] [PMC free article] [PubMed] [Google Scholar]
- Cui X, Churchill GA. Statistical tests for differential expression in cDNA microarray experiments. Genome Biol. 2003;4:210. doi: 10.1186/gb-2003-4-4-210. [DOI] [PMC free article] [PubMed] [Google Scholar]
- Elkan TLBaC. Proceedings of the Second International Conference on Intelligent Systems for Molecular Biology. AAAI Press, Menlo Park, California; 1994. "Fitting a mixture model by expectation maximization to discover motifs in bioploymers"; pp. 28–36. [PubMed] [Google Scholar]
- Gribskov TLBaM. "Combining evidence using p-values:application to sequence homology searches". Bioinformatics. 1998;14:48–54. doi: 10.1093/bioinformatics/14.1.48. [DOI] [PubMed] [Google Scholar]
- Bolotin A, Wincker P, Mauger S, Jaillon O, Malarme K, Weissenbach J, Ehrlich SD, Sorokin A. The complete genome sequence of the lactic acid bacterium Lactococcus lactis ssp. lactis IL1403. Genome Res. 2001;11:731–753. doi: 10.1101/gr.GR-1697R. [DOI] [PMC free article] [PubMed] [Google Scholar]
- Gasson MJ. Plasmid complements of Streptococcus lactis NCDO 712 and other lactic streptococci after protoplast-induced curing. J Bacteriol. 1983;154:1–9. doi: 10.1128/jb.154.1.1-9.1983. [DOI] [PMC free article] [PubMed] [Google Scholar]
- Chang AC, Cohen SN. Construction and characterization of amplifiable multicopy DNA cloning vehicles derived from the P15A cryptic miniplasmid. J Bacteriol. 1978;134:1141–1156. doi: 10.1128/jb.134.3.1141-1156.1978. [DOI] [PMC free article] [PubMed] [Google Scholar]
- van Alen-Boerrigter IJ, Baankreis R, de Vos WM. Characterization and overexpression of the Lactococcus lactis pepN gene and localization of its product, aminopeptidase N. Appl Environ Microbiol. 1991;57:2555–2561. doi: 10.1128/aem.57.9.2555-2561.1991. [DOI] [PMC free article] [PubMed] [Google Scholar]
- Mierau I, Kleerebezem M. 10 years of the nisin-controlled gene expression system (NICE) in Lactococcus lactis. Appl Microbiol Biotechnol. 2005;68:705–717. doi: 10.1007/s00253-005-0107-6. [DOI] [PubMed] [Google Scholar]
- Wegkamp A, van Oorschot W, de Vos WM, Smid EJ. Characterization of the role of para-aminobenzoic acid biosynthesis in folate production by Lactococcus lactis. Appl Environ Microbiol. 2007;73:2673–2681. doi: 10.1128/AEM.02174-06. [DOI] [PMC free article] [PubMed] [Google Scholar]
Associated Data
This section collects any data citations, data availability statements, or supplementary materials included in this article.
Supplementary Materials
Global transcriptome response towards hydrogen peroxide stress in L. plantarum strains NZ7607 and NZ7602. Significantly affected genes (267) due to hydrogen peroxide stress both in strains NZ7607 and NZ7602 (pvalue < 0.01 & FC ≥ 1.5). Predicted gene names, function, fold change induction as well as main class of the genes are displayed in column one and three respectively. Main functional classes presented in bold are those classes found overrepresented in this study when compared to the total genome of L. plantarum.