Abstract
Hemichannels in the overlapping regions of apposing cells plasma membranes join to form gap junctions and provide an intercellular communication pathway. Hemichannels are also present in the nonjunctional regions of individual cells and their activity is gated by several agents, including calcium. However, their physiological roles are unknown. Using techniques of atomic force microscopy (AFM), fluorescent dye uptake assay, and laser confocal immunofluorescence imaging, we have examined the extracellular calcium-dependent modulation of cell volume. In response to a change in the extracellular physiological calcium concentration (1.8 to ≤1.6 mM) in an otherwise isosmotic condition, real-time AFM imaging revealed a significant and reversible increase in the volume of cells expressing gap-junctional proteins (connexins). Volume change did not occur in cells that were not expressing connexins. However, after the transient or stable transfection of connexin43, volume change did occur. The volume increase was accompanied by cytochalasin D-sensitive higher cell stiffness, which helped maintain cell integrity. These cellular physical changes were prevented by gap-junctional blockers, oleamide and β-glycyrrhetinic acid, or were reversed by returning extracellular calcium to the normal level. We conclude that nongap-junctional hemichannels regulate cell volume in response to the change in extracellular physiological calcium in an otherwise isosmotic situation.
Keywords: cell–cell communication, atomic force microscopy, scanning probe microscopy, connexin43, connexons
Introduction
Gap junctions, as specialized plasma membrane structures, allow the diffusion driven transfer of small cytoplasmic molecules and ions between interconnected cells which, in turn, influence cellular growth and differentiation, metabolic homeostasis, and the synchronization of electrical activity (Bennett et al. 1991; Kumar and Gilula 1996). Existing models of the gap junction structure suggest that plasma membranes of the apposing cells that form gap junctions contain hemichannels (connexons). Hemichannels consisting of multimeric gap-junctional proteins (connexins) are preassembled in cytoplasmic membranes and transported to the cell plasma membrane by vesicle trafficking (Musil and Goodenough 1993; Rahman et al. 1993; Lampe 1994; Laird 1996; Falk et al. 1997). Some of these hemichannels interact with their counterparts from the apposing cells to form whole gap junction channels and others remain in nonjunctional regions. The presence of nonjunctional hemichannels is supported by several studies, including electrophysiological measurements (DeVries and Schwartz 1992; Li et al. 1996), ion channel reconstitution (Buehler et al. 1995; Rhee et al. 1996), functional expression in Xenopus oocytes (Dahl et al. 1992; Ebihara 1996; Trexler et al. 1996), as well as recent structural analyses (Lal et al. 1995b; Li et al. 1996; Hulser et al. 1997; Zampighi et al. 1999). The physiological function of these nonjunctional hemichannels is unknown, although hemichannel activity is reported to be gated by extracellular free calcium (Ca2+; Pfahnl and Dahl 1999), by metabolic inhibition (see Cotrina et al. 1998; John et al. 1999), and by membrane depolarization (DeVries and Schwartz 1992).
Extracellular Ca2+ level ([Ca2+]o) undergoes regional and rhythmic fluctuations under normal physiological conditions (1–1.3 mM and 1.3–1.8 mM, for whole mammals and for cells in culture, respectively; Parfitt and Kleerekofer 1980; Stewart and Broadus 1987). Such calcium fluctuations serve several important physiological roles (for review see Brown 1991), but their underlying mechanisms are poorly understood. Gap-junctional hemichannels could be opened in a Ca2+-free medium (Pfahnl and Dahl 1999), however, it is unknown whether the normal physiological fluctuations in the extracellular [Ca2+] modulate hemichannel activity and whether such altered hemichannel activity serves any physiological functions.
Hemichannels, when opened in a reduced calcium environment, because of its large nonselective ion pores, would allow flow of free ions along their concentration gradients, for example, Na+, Cl−, and Ca2+ into the cytoplasm and K+ out of the cytoplasm. Since the cytoplasm contains excess of negatively charged large macromolecules which cannot leave the cytoplasm, the increased Cl− concentration would require water uptake via aquaporins (if they are present in the cell membrane), hemichannels, or both to maintain isosmotic condition. Subsequent closing of hemichannels would thus establish a higher steady-state cell volume. Such hemichannel-mediated cell volume change could serve as a direct mechanism for the poorly understood isosmotic volume change that is closely linked to cell growth and metabolism (for a recent review, see O'Neill 1999).
In the present study, using multimodal atomic force microscopy (AFM; for review, see Lal and John 1994; Lal and Proksch 1997), confocal laser immunofluorescence imaging, and fluorescent dye uptake assay, we examined the change in cell volume due to the opening of hemichannels in a variety of cells expressing or not expressing connexins. Hemichannels opened when the extracellular free calcium ([Ca2+]o) changed only slightly, from normal 1.8 mM to ≤1.6 mM. Open hemichannels induced flow of water and altered the cell volume. The volume change was reversed by returning the extracellular calcium to the normal level and was blocked by gap junction channel blockers, β-glycyrrhetinic acid (βGCA) and oleamide. In cells with no connexins, no volume change occurred. However, after transient or stable transfection with connexin43 (Cx43), cell volume change was observed. The volume change was accompanied by an increase in the cell stiffness, which was abolished by a cytoskeletal disrupter, cytochalasin D. Moreover, the volume change and the cell viability were significantly restricted in the presence of metabolic inhibitors (MIs). Thus, hemichannels regulate cell volume in an isosmotic environment.
Materials and Methods
Reagents
DME and OptiMEM without calcium and supplemented calf serum were obtained from GIBCO BRL and Gemini Bioproducts, respectively. Lucifer yellow (LY)-CH (MW 457 D) and LY-conjugated dextran (mol wt, 10,000 D) were obtained from Molecular Probes. Anti-Cx43 antibodies (a rabbit polyclonal and a monoclonal against a segment near the COOH terminus) were from Zymed Labs. We also used a site-directed antibody against the cytoplasmic domain CT360-82 (Laird and Revel 1990; Lal et al. 1993, Lal et al. 1995b). Cy3- and fluorescein-conjugated goat anti–rabbit IgG antibodies were from Chemicon International, Inc. βGCA, cytochalasin D, and 2-deoxyglucose (dOG) were from Sigma Chemical Co. and oleamide was from Bachem Bioscience Inc. The MIs, carbonyl cyanide 4-(trifluoromethoxy) phenylhydrazine (FCCP) and iodoacetate (John et al. 1999), were obtained from Aldrich Chemical Co.
Cell Culture
BICR–M1Rk cell line (epithelial cells from rat mammary tumor) was obtained from Dr. D. Hulser (Stuttgart Univ., Germany; Rajewsky and Gruneisen 1972). KOM-1 (bovine aortic endothelial) cells were a gift from Dr. Peter Davies (University of Pennsylvania, Philadelphia, PA). N2A (neuroblastoma) cells and GM04260 (fibroblast) cells were obtained from American Type Tissue Collection (ATTC) and Coriell Repository, respectively, and HeLa cells were obtained from Dr. Mary Ann Jordan (University of California, Santa Barbara). N2A cells stably transfected with Cx43 were obtained from Dr. Paul Lampe (Fred Hutchinson Cancer Research Center, Seattle, WA). BICR cells were cultured by the protocol from Drs. Dirk Suhr and Dieter Hulser (Stuttgart Univ., Germany), with minor modifications (Laird et al. 1995), and KOM-1 cells were cultured by the protocol from Dr. Davies. N2A and fibroblast cells were cultured by the protocols from ATTC and Coriell, respectively, and HeLa cells were cultured by a previously published method (Jordan et al. 1996). In brief, cells were cultured in 60-mm petri dishes, with or without sterilized round glass coverslips, in DME supplemented with 10% calf serum and 100 U/ml penicillin–streptomycin. Cells were maintained in 5% CO2 at 37°C and used for experiments 2–3 d after subculturing.
Cx43 Transfection in N2A Cells
We used both N2A cells stably transfected with Cx43, as well as N2A cells transiently transfected with Cx43. The stably transfected cells were obtained from Dr. Paul Lampe at Fred Hutchinson Cancer Research Center, Seattle, WA.
For transient transfection, the clone G2A (Beyer et al. 1987) was cut with EcoRI and the insert containing the entire Cx43 coding sequence with 5′ and 3′ noncoding sequences was inserted into the mammalian expression vector pCDNA3. The gene is under the control of the CMV promotor for high level constitutive expression. The pCDNA3–Cx43 DNA was transfected into N2A cells using lipofectamine (Life Technologies, Inc.) as per the manufacturer's protocol: DNA–lipid complexes were formed by gently mixing 1 μg DNA (in 100 μl OptiMEM) with 2 μl lipofectamine (also in 100 μl OptiMEM), and leaving the mixture for 45 min at room temperature. N2A cells were plated 24 h before transfection, and washed with OptiMEM just before transfection. Just before transfection, 800 μl OptiMEM was added to the DNA–lipid mixture, resulting in 1 ml transfection medium. The cells were incubated with transfection medium for 20 h, after which 1 ml of N2A growth medium was added for each ml transfection medium. Another 4 h later, the medium was exchanged completely to fresh growth medium. Transfected cells were used for dye transfer and AFM experiments after 1–2 d of incubation in growth medium.
Cytoplasmic Dye Uptake Assay
Dye uptake was assayed as described (Lal et al. 1993). In brief, cells grown on coverslips were incubated directly with 5% LY in the reduced calcium medium for 3–15 min and then washed with the medium with normal calcium to close hemichannels and to prevent extrusion of stored dyes. LY uptake was imaged using an Olympus inverted fluorescence microscope.
Immunofluorescent Microscopy
Immunolabeling was performed as described (Laird and Revel 1990). In brief, cells cultured on coverslips were fixed with 4% paraformaldehyde for 30 min, were blocked and permeabilized with 3% BSA + 0.1% Triton X-100 in PBS for 30 min, and were then incubated with ∼1–5 μg/ml anti-Cx43 polyclonal (CT-360) or mAbs (Zymed) for 2 h. Coverslips were then washed with PBS and incubated with goat anti–rabbit or mouse anti–donkey secondary antibody conjugated to fluorescein or Cy3 (200× dilution; Chemicon International, Inc.) for 2 h. Coverslips were then washed with PBS, dried, and sealed on glass slides. Immunolabeling was viewed on a BioRad MRC1024 confocal laser scanning microscope or on an Olympus inverted microscope. To localize immunolabeled regions with a higher height resolution, only confocal microscopy images are shown. For cell identification, however, the phase-contrast images of the immunolabeled cells were also collected (data not shown).
AFM Imaging
AFM imaging was performed with an integrated AFM-inverted microscope (Lal et al. 1995a; a prototype of Bioscope, Digital Instruments). Cells cultured in petri dishes or on coverslips were washed with, and then imaged in, OptiMEM+20 mM Hepes with varying levels of Ca2+ (1.8, 1.6, 1.5, 1.3, and 1.0 mM, <10 μM). The petri dish was glued to a specially designed microscope stage and left there for 30 min for conditioning. For imaging cells on glass coverslips, coverslips were first glued on to a specially designed steel holder which was then glued to the stage. Images were obtained with oxide-sharpened silicon nitride tips with a nominal spring constant of ∼0.06 N/m, scan rate 0.1–2 Hz. Both the regular contact-mode and tapping-mode of AFM imaging were used.
All imaging was performed at ∼25–27°C room temperature. Imaging parameters were optimized so that no imaging force-induced cytoskeletal reorganization or retraction of cellular processes was observed (Lal et al. 1995a). Cells were imaged for as long as they retained their viability (≤5 h). In BICR and N2A cells, due to their larger initial heights compared with the maximum z range of the AFM scanner (J scanner, Digital Instruments) used, some portion of the height information is saturated and therefore reflects underestimates of the actual height. When the medium was changed to one without calcium, the cells swelled and the height became even more saturated. As the three dimensional morphology could not be imaged for the whole cell in the height-mode, for all further experiments we concentrated on the relatively thinner and more peripheral regions.
Visual inspection with the light microscope (40× objective) integrated with the AFM, showed a qualitative volume increase in the majority of connexin-expressing cells. Since the cultured cells were present both as isolated, as well as clusters of interconnected cells, the role of the intercellular gap-juctional communication in volume homeostasis in a population of interconnected cells is also implicated.
For treatment with βGCA, oleamide, molecular inhibitors, and cytochalasin, the reagents were first mixed into OptiMEM and the original medium was replaced on-line with the one containing reagents. In some cases, cells were pretreated with βGCA or oleamide for 10–20 min, and then the effect of extracellular calcium was assayed.
Cell Volume Measurement
Cell volume was imaged in both regular height- and force volume-mode (Rhee et al. 1998) at 64 × 64 pixels. In force volume-mode, the force-induced indentation can be monitored and minimized and thus the height and volume measurements are more accurate. Unless otherwise stated, all volume data are presented from the force volume imaging. Height-mode images were obtained at 512 × 512 pixels and provided higher lateral resolution images.
Cell volume was measured using the bearing analysis of the AFM software. For all pixels that show height data above the substrate plane, the pixel area times pixel height is integrated, leading to the volume of the cell fraction in the given image scan size. As the real x, y, and z coordinates of each image point are stored to construct the images, both local, as well as global, volume measurements can be computed. The same region of the cell was imaged in real time while changing the medium with defined experimental perturbations (e.g., different [Ca2+]) on-line, to estimate the relative volume changes as a function of the perturbation. In general, an AFM image of any volume change was examined for one cell per petri dish only. Complete sets of AFM data on volume increase were recorded in 9–11 single cells of each cell types.
Force Mapping and Viscoelasticity Analysis
A map of sample viscoelastic properties was computed from the force volume plots, in which the AFM tip moves up and down (z-movement) over a point on the sample surface, probing the elastic and adhesive properties of materials. Force maps are obtained for each points on the sample surface as described (Rhee et al. 1998). In addition, the amount of z-movement needed at each point to reach the preset deflection of the cantilever (usually corresponding to the lowest imaging force) is used to obtain a topographical plot of the surface. The height information is used to measure structural changes (e.g., volume change) during the measurements. For each pixel in the topographical map, a force curve can be recalled, from which physical properties, such as the elasticity, can be derived quantitatively. We compared the elastic properties of cells under different experimental conditions by changing the medium on-line. Elasticity was calculated from the force volume imaging data as described (Rhee et al. 1998; Parbhu et al. 1999). To compare the viscoelastic properties of the cells, the slopes of the extending force curves were compared by fitting linear functions to several regions of the force curves, and by simulating the tip–surface system as a cone–plane system.
Results
Lowering Extracellular Calcium Concentration ([Ca2+]o) Raises Cell Volume
We used a combined light fluorescence and atomic force microscope (AFM) to examine the change in cell volume and associated mechanical properties resulting from the modulation of hemichannel activity. We selected several cell types, including those expressing connexins and those expressing very little or no connexins. The focus of the present study was to determine physiological roles of the nonjunctional hemichannels. Accordingly, volume measurements, Cx43 immunolabeling, and dye uptake assays were performed primarily in single cells, although some cells were present in clusters and interconnected, and thus the role of the intercellular juctional communication in modulating dye uptake and volume homeostasis is also implicated.
Real-time AFM images of the hemichannel-induced cell volume changes are shown in Fig. 1 Fig. 2 Fig. 3 Fig. 4 Fig. 5. Fig. 1 shows a reversible increase in the volume of an epithelial cell as a function of [Ca2+]o in an otherwise isosmotic condition. Fig. 1 B shows the cell volume in the control medium with 1.8 mM [Ca2+]o. Nine minutes after reducing [Ca2+]o to <10 μM, the cell volume increased significantly (Fig. 1 C). When [Ca2+]o was returned to the control level (1.8 mM), the cell volume began to recover and the full recovery of the cell volume was reached in ∼60 min (compare Fig. 1E and Fig. F).
Figure 1.
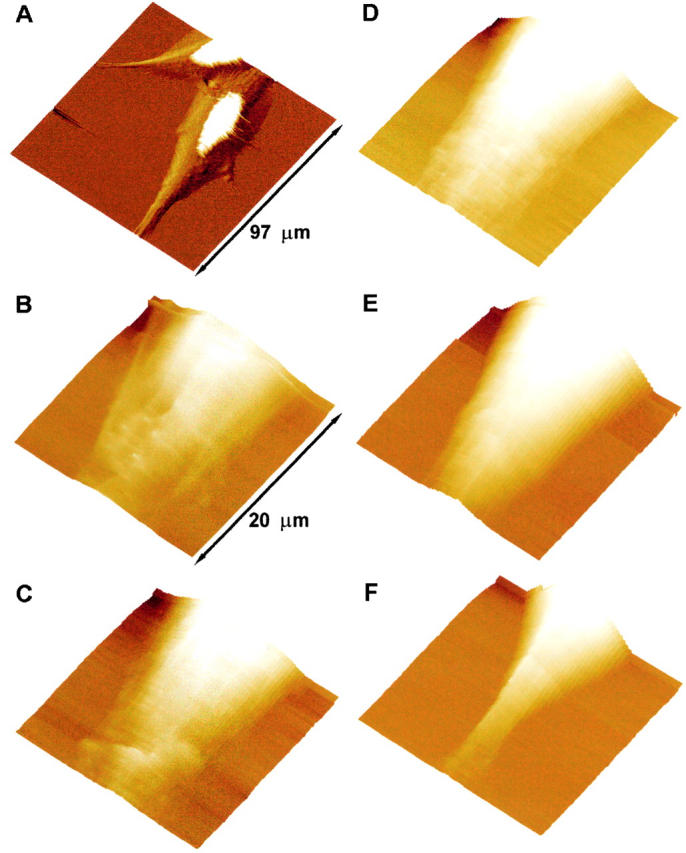
Volume changes of a BICR–M1Rk epithelial cell induced by the removal of extracellular calcium. Real-time AFM images of the volume change and morphological reorganization in a BICR–M1Rk cell. A is an error-mode image of cells incubated in OptiMEM medium with normal calcium (1.8 mM). The white part in the image is due to height saturation. B shows the volume of a portion of the cell when incubated in the OptiMEM medium with normal calcium. C, D, and E show a gradual increase in the cell volume after the extracellular medium was changed to OptiMEM without calcium. Imaging for these panels began 9, 27, and 36 min after changing the medium. When the extracellular medium was changed back to OptiMEM with normal calcium, the cell volume began to decrease and returned to its original value in ∼60 min (F). The z range of the piezo scanner is too small to image the complete height of the cell in these regions. After changing the medium with normal calcium to the calcium-free medium, the saturated portion of the image increases considerably, indicating an overall volume increase of the cell (not shown). To avoid underestimation of the measured volume due to the scanner z-range limit, we selected cell portions that show no saturation in the height data for further study. All images are shown as surface plots, with the cell height color-coded, brighter being higher. The acquisition time for each image is 9 min. As discussed in Materials and Methods, spatial resolution in force plots is very low and hence no cytoskeletal reorganization is apparent. For such study, error-mode height images were taken at regular intervals (data not shown).
Figure 2.
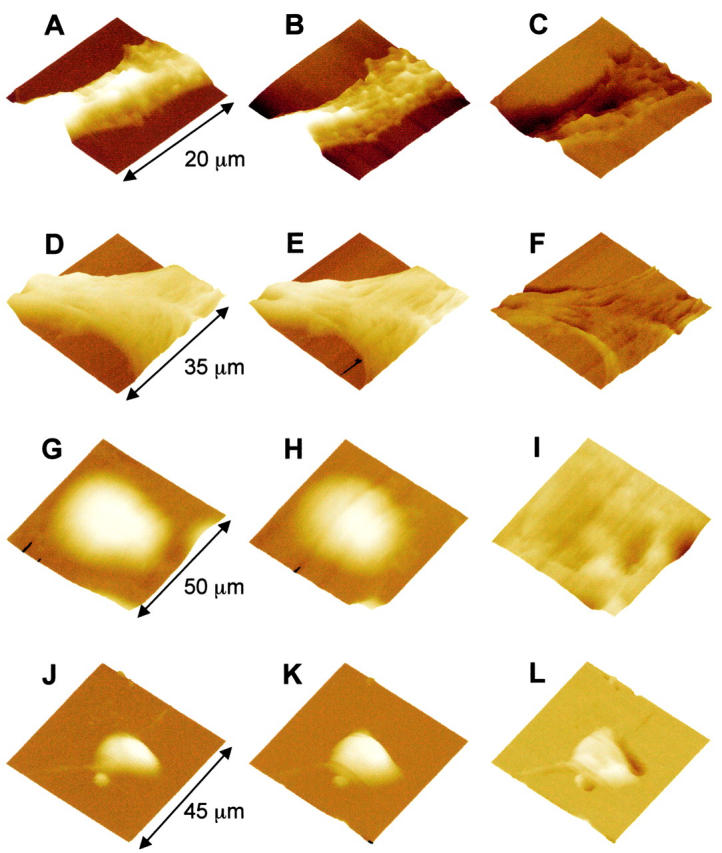
Hemichannel-specific cell volume increase. A and B show real-time AFM images of a BICR–M1Rk epithelial cell taken in normal OptiMEM medium (A) and after changing to a nominally calcium-free OptiMEM medium in the presence of 10 μM βGCA, a gap-junctional channel antagonist (B). The cell height profile is color- and intensity-coded, brighter being higher in height. No significant change in the cell volume was observed. C shows the net volume change (i.e., C = B − A); darker regions show volume decrease and brighter regions show the volume increase. These changes are not significantly different from the background level. D and E show AFM images of another BICR–M1Rk cell in normal OptiMEM and in calcium-free OptiMEM containing 50 μM oleamide. No significant change in the cell volume was observed (F = E − D). G–I show volume profiles of a nonconnexin expressing normal N2A cell and J–L show volume profiles of a N2A cell with transient Cx43 transfection. G and J show images in OptiMEM with normal calcium (1.8 mM) and H and K show images of the same cells 20 min after changing to nominally calcium-free OptiMEM. Removal of extracellular calcium induces a significant volume increase in Cx43-transfected cells (L), but not in nonconnexin expressing normal N2A cell (I).
Figure 3.
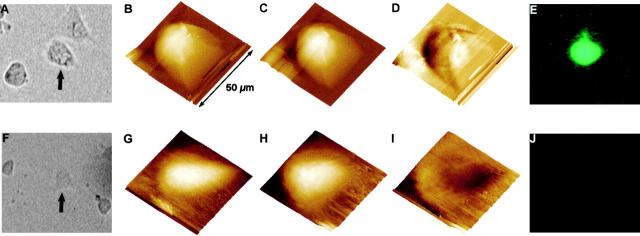
Simultaneous imaging of Cx43-specific LY uptake and volume increase, in response to a reduction in the extracellular calcium concentration. A–E show a N2A cell stably transfected with Cx43, and F–J show a N2A cell transfected with expression vector only. A and F show optical phase-contrast images and E and J show LY uptake fluorescence images of the same cells (arrows in A and F); only Cx43-transfected cells took up LY. The volume changes were also measured for the same cells. B and G show volume profiles in normal OptiMEM, C and H show volume profiles after calcium removal. D and I show the net cell volume change (i.e., D = C − B and I = H − G. The volume of the Cx43-transfected cell changed significantly (D), whereas the cell transfected with expression vector only did not show any increase in cell volume (I). These data also show the unique feature of a combined AFM and optical microscopy system for multimodal imaging in living cells. All images are shown as surface plots, with the cell height color-coded, brighter being higher.
Figure 4.
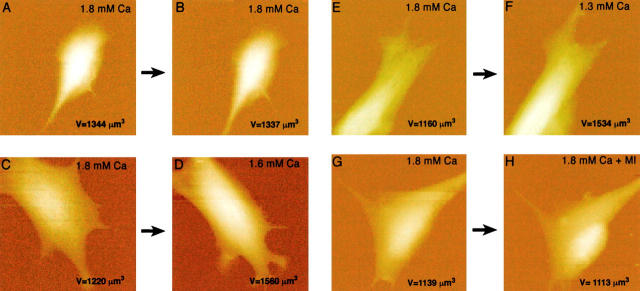
A change in physiological calcium level induces a volume change. A, C, and E show three endothelial cells in control medium (1.8 mM Ca2+). B shows the same cell as in A after exchanging medium with the same calcium level (a positive control). No volume change occurred due to the exchange of media alone. Reducing the extracellular Ca2+ from 1.8 mM to 1.6 mM, the volume increased by 28% (compare D with C). Reducing the extracellular Ca2+ from 1.8 mM to 1.3 mM, the volume increased by 32% (compare F with E). These data show that the changes of extracellular calcium level in physiological range induce cell volume increase. Scan size: (A and B) 60 μm; (C–H) 50 μm. Effect of MIs on cell volume: images of endothelial cells before (G) and after (H) the addition of MIs, FCCP (10 μM) and dOG (10 mM), in control medium. No volume increase was observed within 10–20 min.
Figure 5.
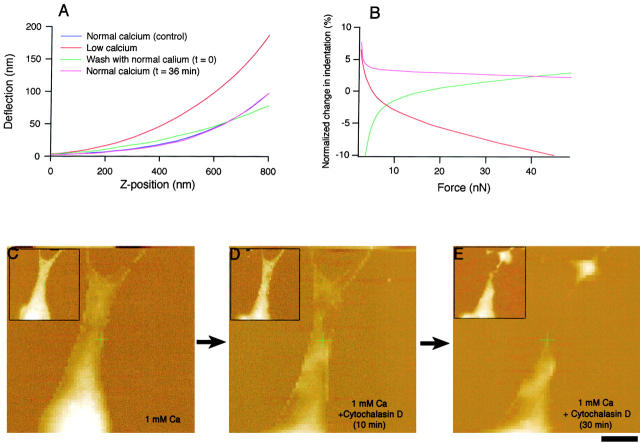
Effects of extracellular calcium removal on cell elasticity and effect of cytochalasin D on cell volume and structure. Force–distance curves measured at the peripheral region of the same BICR–M1Rk epithelial cell as shown in Fig. 1. A shows force curves at the same location on the cell in normal OptiMEM (black), after calcium removal (red), and after calcium was added back (pink). Removal of extracellular calcium increased cell stiffness (elastic modulus) by ∼50%, as indicated by the larger slope of the curve (compare black and red curves). 36 min after the extracellular calcium returned to normal level, cell stiffness fully recovered as indicated by the overlapped force curves (black and pink curves). All curves are offset to make the point of contact overlap. B shows the change in indentation normalized to the initial normal force curve. In the low calcium medium, applying the same force results in less indentation (negative change; red), indicating a stiffer cell with higher Young's Modulus. After returning the extracellular Ca2+ back to the normal level, the change in the indentation relative to the initial curve was smaller (green curve asymptotically reaches pink curve to the control level). C–E, Effect of cytochalasin D on cell volume and morphology. C–E show that for a KOM-1 endothelial cell, cytochalasin D (1 mM), which degrades the filamentous actin network, caused a rapid decrease in volume and the loss of cell morphology. As discussed in Materials and Methods, the spatial resolution in force volume plots is very low and hence no cytoskeletal disruption is apparent. To examine the cytoskeletal reorganization and disruption, error-mode height images were also taken (data not shown). The insets show simultaneously obtained force volume maps. Bar, 8 μm.
The volume of fibroblast and endothelial cells also increased significantly when [Ca2+]o was reduced and the volume change was restored after calcium was restored to the normal level (1.8 mM). The volume increase was most significant in epithelial cells. For example, in the epithelial cell shown in Fig. 1, the cell volume increased by more than threefold. In endothelial cells, volume increased by up to 75%, and in fibroblasts, the volume increase ranged from 40 to 70%. On the other hand, removal of Ca2+ did not induce any significant volume change in HeLa cells and N2A cells that express no to low levels of connexins (Table ). In general, an AFM image of any volume change was examined for one cell per petri dish only. Complete sets of AFM data on volume increase were recorded in 9–11 single cells of each cell type, each cell serving as its own internal control. Since the size of these cells, as well as the number of functional hemichannels, could differ considerably, the rate of volume change would differ significantly. For the population statistics, it would require a considerably larger data set to obtain reliable means with a small standard deviation, and thus, only the ranges of volume changes for each cell type and each experimental condition are reported.
Table 1.
Cell Type-specific Relative Volume Change
| Cell type | Volume increase |
|---|---|
| % | |
| BICR–M1Rk epithelial (Marshall) | 200–350 |
| KOM-1 endothelial | 60–75 |
| GM04260 fibroblasts | 40–70 |
| HeLa | 0 |
| N2A neuroblastoma | 0 |
| Cx42-transfected N2A | 40–65 |
All connexin-expressing cells show a volume increase in response to lowering of external free calcium. Nonconnexin-expressing cells do not show any appreciable volume increase. Complete sets of AFM data on volume increase was recorded in 9–11 single cells of each cell type, each cell serving as its own internal control. Since the size of these cells, as well as the number of functional hemichannels, could differ considerably, the rate of volume change would differ considerably. For the population statistics, it would require a considerably large data set to obtain reliable means with a small standard deviation and thus, only the ranges of volume changes for each cell type are reported.
In all cell types examined, the volume changes induced by the reduction of extracellular calcium were reversible and the cell volume could be imaged following alteration of [Ca2+]o from control level to near zero and back to control. The reversibility of volume change is consistent with the elastic nature of the normally folded cell plasma membrane invaginations.
Volume Change Is Connexin-specific
We examined the effect of gap-junctional hemichannel-specific blockers on the cell volume change induced by the reduction in [Ca2+]o. Ca2+-dependent volume change was prevented by two of the relatively specific hemichannel blockers, βGCA and oleamide (Goldberg 1996; Guan et al. 1996, Guan et al. 1997; Rose and Ransom 1997; Davidson and Baumgarten 1988). In the present study, the presence of 10 μM βGCA or 50 μM oleamide, a reduced [Ca2+]o, did not induce any significant change in the volume of epithelial, endothelial, and fibroblast cells (Fig. 2, A–F).
The direct correlation of the connexin-dependent modulation of the cell volume was examined in N2A neuroblastoma cells. For N2A cells, which do not express any detectable level of Cx43 or any other connexins, a reduced [Ca2+]o did not induce any increase in the cell volume (Fig. 2, G–I). In contrast, when N2A cells were transfected with Cx43, either stably or transiently, a reduced [Ca2+]o induced an elevation in the cell volume by 50–70% (Fig. 2, J–L and Fig. 3, A–E). Such volume change was not observed in N2A cells transfected with the expression vector alone (Fig. 3, F–J). Moreover, the Ca2+-dependent volume change in the Cx43-transfected N2A cells was also inhibited by both βGCA and oleamide, respectively (data not shown). These results indicate that the volume increase due to a reduced [Ca2+]o, in an otherwise isosmotic condition, requires the presence of functional (open) hemichannels in the cell plasma membrane.
The opening of these functional hemichannels in response to the lowering of [Ca2+]o was further demonstrated by the cellular uptake of LY. Using a combined fluorescence microscope and AFM, we show that a reduction of [Ca2+]o induced both LY uptake and cell volume increase in Cx43-transfected N2A cells (Fig. 3, A–E). In contrast, N2A cells transfected with the expression vector alone did not show LY uptake or volume increase (Fig. 3, F–J).
Physiological Fluctuations of Extracellular Ca2+ Alter Cell Volume
To ascertain the physiological relevance of extracellular Ca2+-mediated volume increase, we further examined cell volume changes in response to changes in [Ca2+]o in the normal physiological range. The physiological range of [Ca2+]o in mammals is ∼1–1.3 mM and for cells in culture it is 1.3–1.8 mM (Parfitt and Kleerekofer 1980; Stewart and Broadus 1987). In the present study, [Ca2+]o was reduced from 1.8 mM to 1.6, 1.5, 1.3, 1, 0.5, and 10 μM, respectively. The cell volume was altered, even for a reduction in [Ca2+]o by as little as 0.2 mM (from 1.8 to 1.6 mM; Fig. 4). The volume change was observed only in cells which express connexins and was completely inhibited by gap-junctional channel blockers, oleamide, and βGCA, consistent with the characteristics of the hemichannel-induced volume regulation. LY uptake was also observed after a small reduction of [Ca2+]o in the physiological range (∼1.6 mM), and such dye uptake was prevented in the presence of βGCA or oleamide (data not shown).
Hemichannels are also reported to be opened by MIs and have been proposed to provide a mechanism for the destabilization of the ionic homeostasis and eventual cell death under several pathophysiological conditions, such as ischemia, hypoxia, and other forms of metabolic inhibition (John et al. 1999). We examined if MIs would also induce an increase in the cell volume. At normal [Ca2+]o (1.8 mM), the MIs, FCCP (10 μM) and dOG (10 mM), inhibitors of oxidative and glycolytic metabolisms, respectively, did not induce any significant increase in cell volume within 10–20 min (Fig. 4). FCCP and dOG were previously reported to open hemichannels only after ∼15 min of incubation (John et al. 1999). In the present study, FCCP and dOG caused rapid cellular degeneration and the dissociation of cells from the substrate after 20 min, which made prolonged imaging difficult. We did not test milder MIs, which could have ensured a longer cell survival and could have allowed volume change to occur. A recent study by Cotrina et al. 1998 has shown that the opening of hemichannels by metabolic inhibition led to calcium influx, altered ionic homeostasis, and loss of cell viability.
Cell Stiffness Is Increased during the Volume Increase
An increase in the cell volume could induce membrane disruption and cell lysis unless prevented by an elevated cell stiffness and an appropriate cytoskeletal reorganization. We evaluated cell stiffness from the force–distance curves in the presence or absence of calcium. Ca2+-dependent cell volume increase was accompanied by an increase in the stiffness of connexins expressing epithelial, endothelial, fibroblast, and Cx43-transfected N2A cells. Fig. 5 shows the change in the elastic modulus (stiffness) in an epithelial cell. A reduction of [Ca2+]o increased the elastic modulus by ∼50%. The elastic modulus varied regionally within a cell, between ∼10–30 kPa, which could reflect the inhomogeneous cytoskeletal structure. Regional difference in the elastic modulus was previously reported in cardiac myocytes (Shroff et al. 1995).
The change in cell stiffness is also reversible, similar to cell volume changes. An example of such reversibility is shown in Fig. 5A and Fig. B: after restoring [Ca2+]o to a normal level (1.8 mM), the force modulation curve nearly overlapped with the force curve before calcium reduction and the corresponding normalized change in the tip indentations induced by the same imaging force also returned to its original level. The change in cell stiffness most likely results from the reorganization of apical cytoskeleton. In the present study, a disrupter of cytoskeletal structures, cytochalasin D (1 mM), caused a significant loss in cell volume and stiffness (Fig. 5, C–E).
Discussion
In response to the extracellular physiological Ca2+ modulation (1.8 to ≤1.6 mM) in an otherwise isosmotic condition, we observed a reversible increase in the volume of cells expressing gap-junctional proteins (connexins), but not in cells that do not express connexins. In Cx43-transfected cells, however, the cell volume change occurred in response to lowering the extracellular calcium level. An increased volume was accompanied by elevated cell stiffness, which helped maintain cell integrity. These cellular physical changes were prevented by oleamide and βGCA, or were reversed by returning extracellular calcium to the normal level.
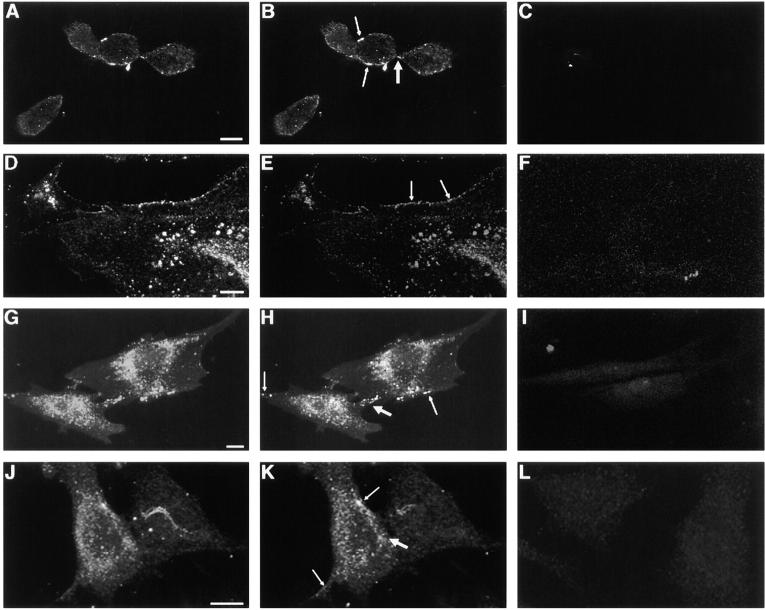
The presence of functional hemichannels in the nonjunctional regions of the cell plasma membrane is evident in immunofluorescence labeling and dye uptake studies. Anti-Cx43 immunolabeling was observed in both gap-junctional and nonjunctional regions of Cx43-expressing BICR cells, KOM-1 cells, and GM04260 cells, as well as in Cx43-transfected N2A cells by confocal laser scanning microscopy (Fig. 6). In contrast, in cells incubated with only the secondary antibody without preincubation with the primary antibody, and in Cx43-transfected N2A cells incubated with normal mouse IgG, no immunostaining was observed (Fig. 6). Significantly, anti-Cx43 immunolabeling was observed even in single slices representing the most peripheral regions of the cells, where only the apposing plasma membranes of individual cells and no cellular organelles were visible under phase-contrast microscopy. In the absence of any apposing cells, immunolabeling is assumed to be in the nonjunctional plasma membrane regions. Connexin immunolabeling has been reported in several cell types (Laird et al. 1995; Toyofuku et al. 1998; Zampighi et al. 1999). In our study, although immunolabeling was observed in all Cx43-expressing cell types examined, the level of staining varied. The evidence that they represent hemichannels comes from earlier reports for the presence of a pool of oligomeric structures of Cx43 and Cx50 in the plasma membrane of NRK cells and Xenopus oocytes, respectively (Musil and Goodenough 1991; Zampighi et al. 1999). Hemijunctional plaques were also reported in AFM imaging of isolated heart gap junction preparation (Lal et al. 1995b).
Figure 6.
Immunofluorescence localization of Cx43 in BICR–M1Rk cells (A–C), KOM-1 bovine aortic endothelial cells (D–F), GM04260 fibroblast cells (G–I), and Cx43-transfected N2A neuroblastoma cells (J–L) by confocal laser scanning microscopy. A, D, G, and J show integrated labelings from all slices (20) of the confocal images across the whole cell thickness. B, E, H, and K show immunolabeling in single slices representing the most peripheral regions of the cells, where only the apposing plasma membranes and no cellular organelles were visible under phase-contrast microscopy. Significant immunostaining was observed in both gap-junctional (thin arrow) and nonjunctional (thick arrow) regions. Such immunolabeling was observed in all cells examined for BICR–M1Rk cells, endothelial cells, and fibroblast cells, though the level of staining varied. For the Cx43-transfected N2A cells, immunostaining was observed for 30–50% of the cells. In cells incubated with only the secondary antibody without preincubation with the primary antibody, no immunostaining was observed and the level of background fluorescence varied between cell types (C, F, and I). Also, in Cx43-transfected N2A cells incubated with normal mouse IgG, no immunostaining was observed (L). Bars: (A–F) 10 μm; (G–L) 50 μm.
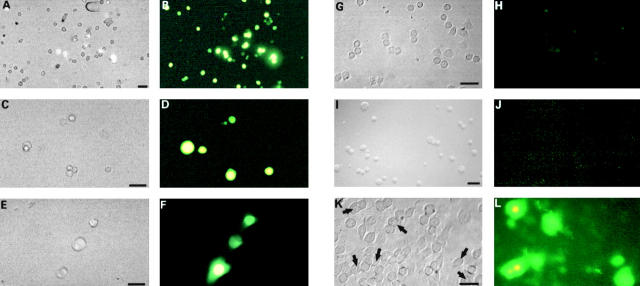
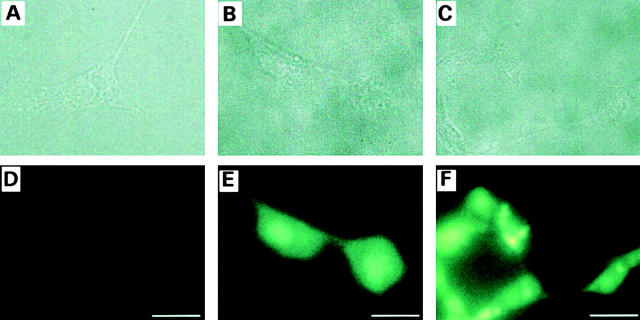
The functional state of the hemichannels was examined by the extent of LY uptake. LY uptake was observed in connexin-expressing BICR, KOM-1, GM04260, and Cx43-transfected N2A cells, but was absent in nonconnexin-expressing HeLa cells and N2A cells (Fig. 7; also see Li et al. 1996). Moreover, LY uptake was inhibited by both βGCA and oleamide. Consistent with the size limit for permeability through the gap-junctional channels (Yancey et al. 1989; Lal et al. 1993), a medium with low [Ca2+]o did not allow LY-conjugated dextran (10,000 D) uptake. The level of LY uptake showed a qualitative dose dependence on [Ca2+]o. At normal [Ca2+]o (1.8 mM), no LY uptake was observed for all cell types examined. At 1.6 mM [Ca2+]o, LY uptake was observed, and increased further at 1.3 mM (Fig. 3 and Fig. 8).
Figure 7.
Dye uptake properties of hemichannels in BICR–M1Rk epithelial cells (A and B), KOM-1 endothelial cells (C and D), GM04260 fibroblast cells (E and F), HeLa cells (G and H), N2A neuroblastoma cells (I and J), and Cx43-transfected N2A cells (K and L). Cytoplasmic uptake of LY from the extracellular medium was tested in OptiMEM containing reduced calcium. A, C, E, G, I, and K are phase-contrast images and B, D, F, H, J, and L are the corresponding fluorescence images. A large amount of LY uptake was observed for epithelial and endothelial cells, and a somewhat smaller amount for fibroblasts. HeLa cells, which express a very low level of connexins, showed no LY uptake (H). Similarly, N2A cells do not show any LY uptake (J). In contrast, 40–45% of Cx43-transfected cells show LY uptake (L). The arrows in K denote individual cells and cell clusters with prominent fluorescent signals. Images of dye uptake in BICR, KOM-1, GM04260, and N2A cells were taken when the cells were in suspension, although similar effects were observed for cells attached to the glass coverslip. HeLa cells and Cx43-transfected N2A cells were attached to the coverslips for the LY uptake assay. Bars: (A–H, K, and L) 50 μm; (I and J) 20 μm.
Figure 8.
A qualitative relationship between dye uptake and the extracellular Ca2+ level. An example for such relationship is shown for Cx43-expressing KOM-1 endothelial cells. Cytoplasmic uptake of LY from the extracellular medium was tested in OptiMEM containing 1.8 mM calcium (A and D), 1.6 mM calcium (B and E), and 1.3 mM calcium (C and F). At 1.8 mM, no dye uptake was observed (D). At 1.6 mM, significant dye uptake was observed (E) and at 1.3 mM, a higher level of dye uptake was observed (F). The LY uptake suggests open hemichannels at these calcium levels. Bars, 25 μm.
A wild-type connexin (Cx46), when expressed in Xenopus oocytes, was reported to form open hemichannels at normal [Ca2+]o and to induce oocyte swelling and rupture in 8–12 h, unless the osmotic stress was counteracted with Ficoll and thus suggesting a finite open probability of Cx46 hemichannels at normal [Ca2+]o. In contrast, no cell lysis occurred after the expression of Cx32 or Cx43 (Paul et al. 1991). Subsequent studies showed that Cx46 hemichannels open at the normal [Ca2+]o only when the oocytes are depolarized (Ebihara and Steiner 1993; Pfahnl and Dahl 1999). Thus, although Cx46 hemichannels could have a finite open probability at the normal extracellular calcium, after the membrane depolarization, no such evidence exists for Cx43 or other connexins.
Our data show that a normal physiological reduction in [Ca2+]o opens hemichannels in an isosmotic condition. In our study, the osmotic balance was maintained, except for a small change in the [Ca2+]o (from 1.8 mM to ≤1.6 mM). Open hemichannels would act as a nonselective leak pathway and permit flow of ions and small molecules, thus creating a sufficient osmotic gradient (due to excess of Cl− in the cytoplasm), favoring water flow from the extracellular region to the cytoplasm. Water flow could be via one or all of several pathways, including aquaporins, hemichannels, and the lipid bilayer. The rate of water movement across a pure lipid membrane would be insufficient to account for the rapid volume flux of water in the present study. Aquaporins have sufficient water permeability to mediate the flow of water, however, we did not examine their presence in the cell types used in the present study. Also, aquaporins do not allow passage of ions or large molecules (e.g., LY), as observed simultaneously with the volume increase in the present study. Moreover, the volume change was inhibited by hemichannel blockers, oleamide and βGCA, and showed two additional gap junction-specific features: reversibility in response to returning [Ca2+]o to the normal level and connexin specificity (only Cx43-expressing cells show any volume change). A detailed analysis of the rate of water flow and permeability coefficients via these pathways (aquaporins, lipid bilayer, and hemichannels), though important, is beyond the scope of this study. Assuming a finite water permeability for hemichannels, as deduced indirectly from osmotically driven volume increase in Cx46-expressing Xenopus oocytes (Paul et al. 1991) and other previous studies, water flow through hemichannels would provide a direct pathway for the isosmotic volume increase in cells that express connexins, but do not express sufficient number of aquaporins. In the aquaporin-expressing cells, although hemichannels could induce cell volume increase, water flow could be mainly through aquaporin channels.
We present a simplified model for hemichannel-induced volume regulation in an isosmotic environment (Fig. 9). A lowering of the physiological [Ca2+]o will open hemichannels. Open hemichannels would allow ion transfer and induce cell volume increase. A subsequent elevation of [Ca2+]o (as would occur during a regular rhythmic oscillation) alone, or in combination with an elevation of intracellular [Ca2+]i (open hemichannel-mediated Ca2+ uptake) in conjunction with other factors (such as pH, membrane potential, etc.), would close hemichannels (DeVries and Schwartz 1992; Bruzzone et al. 1996; Li et al. 1996; Trexler et al. 1996; Cotrina et al. 1998; Toyofuku et al. 1998; Pfahnl and Dahl 1999). If the cell is metabolically active, both [Ca2+]i and the cell volume would return to the normal level (Fig. 1) by activating regulated volume decrease mechanisms involving calcium ATPase, Na-Ca antiporter, and other cell volume regulatory mechanisms.
Figure 9.
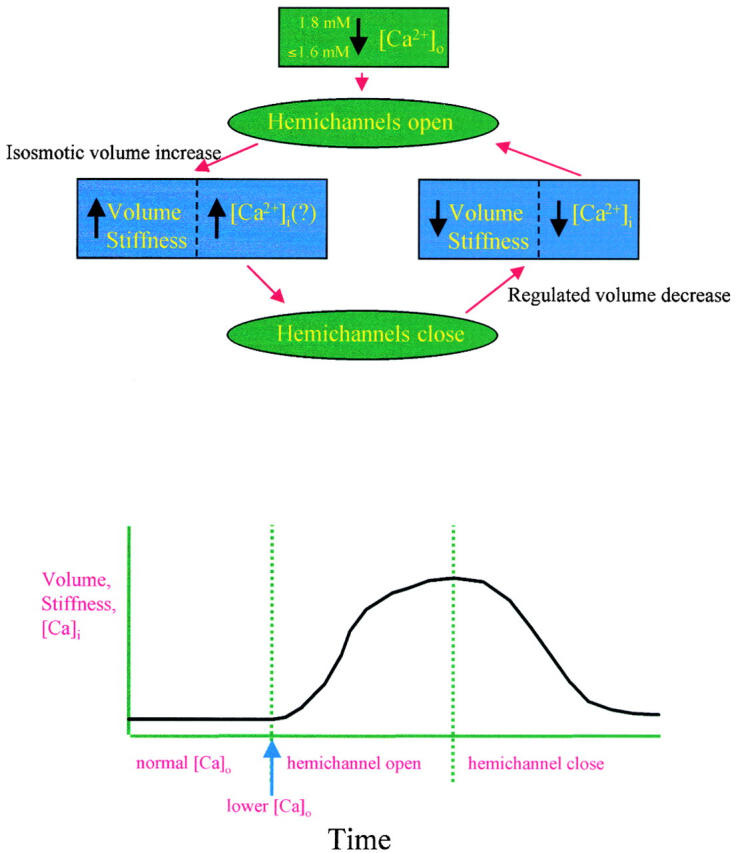
Model of hemichannel-induced cell volume regulation. A small reduction of extracellular free calcium ([Ca2+]o) in the physiological range opens hemichannels. Open hemichannels allow flow of ions (primarily Na+ and Cl−) into the cytoplasm, which creates sufficient osmotic gradient for the water flow into the cytoplasm (directly via hemichannels and/or indirectly via aquaporins and diffusion through lipid bilayer). Such water flow raises the cell volume. The subsequent closure of hemichannels leads to a new steady-state cell volume and prevents cell lysis. For a healthy cell, the elevated cell volume triggers regulated volume decrease mechanisms, which restores the original cell volume and ionic concentrations. For abnormal or apoptotic cells, no return to the normal volume and ionic concentration will occur.
The model predicts that the cell volume would undergo repetitive changes due to the fluctuation in [Ca2+]o (Quist, A.P., H. Lin, R. Lal, unpublished observation). The extent, duration, and latency of repetitive changes would depend on several factors, including cell and tissue type, expression pattern of connexins, number of open hemichannels, the gradient between [Ca2+]o and [Ca2+]i, and on the efficacy of the intercellular communication via gap junctions (for interconnected cells, gap-junctional communication could buffer the effect of volume increase in any individual cells by spreading the volume changes to the neighboring cells and thus lead to an average increase in the tissue volume). For individual cells, the activity of nonjunctional hemichannels and gap junctions would be opposite; for example, open hemichannels could lead to the closing of gap junctions via altered [Ca2+]i and pH and the number of available nonjunctional hemichannels would depend on the extent of their incorporation into whole gap junctions when cells are in contact. Moreover, many cell types express multiple types of connexins, which could functionally complement, and thus compensate for, the loss of functions of each other.
The regulation of cell volume and its associated mechanical properties is a fundamental physiological property of mammalian cells. There is a close relationship between cell volume and cell growth and metabolism. Consistent with such a relationship, there appeared to be a permanent reorganization of the cytoskeletal network, although the extracellular calcium-induced changes in the volume and stiffness were reversible (preliminary observation). Thus, by modulating cell volume in response to normal calcium fluctuations, hemichannels may serve critical physiological functions. Hemichannels may also play a significant role in pathological situations where there is a loss of calcium, such as in hypocalcemia-associated pathophysiological conditions.
Acknowledgments
We thank Dr. Lisa Moore for assistance in immunolabeling, Dr. Scott John for providing Cx43 cDNA and transfection vectors, Drs. Dirk Suhr and Dieter Hulser for providing Marshall cells and tissue culture protocols, Dr. Peter Davies for providing KOM-1 cells, Paul Lampe for providing N2A cell stably transfected with Cx43, and Dr. Paul Hansma for usage of the prototype Bioscope AFM. We are grateful to Dr. Andrew Harris, Dr. Scott John, and Dr. Peter Davies for helpful discussions and critical evaluation of the manuscript, and to Ms. Maura Jess for computer graphics and image processing. We also acknowledge useful and pertinent suggestions and advice of anonymous reviewers and several external colleagues with expertise in the fields of gap junctions and hemichannels, cell volume regulations, and the extracellular calcium signaling.
This work was supported by a joint award from the National Institute on Aging and National Institute of General Medical Sciences (GM056290), American Heart Association, Western States Affiliates. Dr. Rhee was partially supported by a grant from the Korean Ministry of Education (GE 97-124).
Footnotes
Drs. Quist, Rhee, and Lin contributed equally to this work.
Abbreviations used in this paper: βGCA, β-glycyrrhetinic acid; AFM, atomic force microscopy; Cx43, connexin43; dOG, 2-deoxyglucose; FCCP, carbonyl cyanide 4-(trifluoromethoxy) phenylhydrazine; LY, Lucifer yellow dye; MI, metabolic inhibitor.
References
- Bennett M.V.L., Barrio L.C., Bargiello T.A., Spray D.C. Gap junctionsnew tools, new answers, new questions. Neuron. 1991;6:305–320. doi: 10.1016/0896-6273(91)90241-q. [DOI] [PubMed] [Google Scholar]
- Beyer E.C., Paul D.L., Goodenough D.A. Connexin 43a protein from rat heart homologous to a gap junction protein from liver. J. Cell Biol. 1987;105:2621–2629. doi: 10.1083/jcb.105.6.2621. [DOI] [PMC free article] [PubMed] [Google Scholar]
- Brown E.M. Extracellular Ca2+ sensing, regulation of parathyroid cell function, and role of Ca2+ as extracellular (first) messengers. Physiol. Rev. 1991;71:371–411. doi: 10.1152/physrev.1991.71.2.371. [DOI] [PubMed] [Google Scholar]
- Bruzzone R., White T.W., Paul D.L. Connections with connexinsthe molecular basis of direct intercellular signaling. Eur. J. Biochem. 1996;238:1–27. doi: 10.1111/j.1432-1033.1996.0001q.x. [DOI] [PubMed] [Google Scholar]
- Buehler L.K., Stauffer K.A., Gilula N.B., Kumar N.M. Single channel behavior of recombinant β2 gap junction connexons reconstituted into planar lipid bilayers. Biophys. J. 1995;68:1767–1775. doi: 10.1016/S0006-3495(95)80353-X. [DOI] [PMC free article] [PubMed] [Google Scholar]
- Cotrina M.L., Kang J., Lin J.H.-C., Bueno E., Hansen T.W., He L., Liu Y., Nedergaard M. Astrocytic gap junctions remain open during ischemic conditions. J. Neurosci. 1998;18:2520–2537. doi: 10.1523/JNEUROSCI.18-07-02520.1998. [DOI] [PMC free article] [PubMed] [Google Scholar]
- Dahl G., Werner R., Levine E., Rabdan-Diehl C. Mutational analysis of gap junction formation. Biophys. J. 1992;62:172–182. doi: 10.1016/S0006-3495(92)81803-9. [DOI] [PMC free article] [PubMed] [Google Scholar]
- Davidson J.S., Baumgarten S. Glycyrrhetinic acid derivativesa novel class of inhibitors of gap-junctional intercellular communication. Structure-activity relationships. J. Pharmacol. Exp. Ther. 1988;246:1104–1107. [PubMed] [Google Scholar]
- DeVries S.H., Schwartz E.A. Hemi-gap-junction channels in solitary horizontal cells of the catfish retina. J. Physiol. 1992;445:201–230. doi: 10.1113/jphysiol.1992.sp018920. [DOI] [PMC free article] [PubMed] [Google Scholar]
- Ebihara L. Xenopus connexin38 forms hemi-gap-junctional channels in the nonjunctional plasma membrane of Xenopus oocytes. Biophys. J. 1996;71:742–748. doi: 10.1016/S0006-3495(96)79273-1. [DOI] [PMC free article] [PubMed] [Google Scholar]
- Ebihara L., Steiner E. Properties of a nonjunctional current expressed from a rat connexin46 cDNA in Xenopus oocytes. J. Gen. Physiol. 1993;102:59–74. doi: 10.1085/jgp.102.1.59. [DOI] [PMC free article] [PubMed] [Google Scholar]
- Falk M., Buehler L.K., Kumar N., Gilula N.B. Cell-free synthesis and assembly of connexins into functional gap junction membrane channels. EMBO (Eur. Mol. Biol. Organ.) J. 1997;16:2703–2716. doi: 10.1093/emboj/16.10.2703. [DOI] [PMC free article] [PubMed] [Google Scholar]
- Goldberg G.S. Evidence that disruption of connexon particle arrangements in gap junction plaques is associated with inhibition of gap junctional communication by a glycyrrhetinic acid derivatives. Exp. Cell Res. 1996;222:48–53. doi: 10.1006/excr.1996.0006. [DOI] [PubMed] [Google Scholar]
- Guan X., Wilson S., Schlender K., Ruch R. Gap-junction disassembly and CX43 dephosphorylation induced by beta-GCA. Mol. Carcinog. 1996;16:157–164. doi: 10.1002/(SICI)1098-2744(199607)16:3<157::AID-MC6>3.0.CO;2-E. [DOI] [PubMed] [Google Scholar]
- Guan X., Cravatt B.F., Ehring G.R., Hall J.E., Boger D.L., Lerner R.A., Gilula N.B. The sleep-inducing lipid oleamide deconvolutes gap junction communication and calcium wave transmission in glial cells. J. Cell Biol. 1997;139:1785–1792. doi: 10.1083/jcb.139.7.1785. [DOI] [PMC free article] [PubMed] [Google Scholar]
- Hulser D.F., Rehkopf B., Traub O. Dispersed and aggregated gap junction channels identified by immunogold labeling of freeze-fractured membranes. Exp. Cell Res. 1997;233:240–251. doi: 10.1006/excr.1997.3568. [DOI] [PubMed] [Google Scholar]
- John S.A., Kondo R., Wang S.-Y., Goldhaber J.I., Weiss J.N. Connexin-43 hemichannels opened by metabolic inhibition. J. Biol. Chem. 1999;274:236–240. doi: 10.1074/jbc.274.1.236. [DOI] [PubMed] [Google Scholar]
- Jordan M.A., Wendell K.L., Gardiner S., Derry W.B., Wilson L. Mitotic block induced in HeLa cells by low concentrations of paclitaxel results in abnormal mitotic exit and apoptotic cell death. Cancer Res. 1996;56:816–825. [PubMed] [Google Scholar]
- Kumar N., Gilula N.B. The gap junction communication channel. Cell. 1996;84:381–388. doi: 10.1016/s0092-8674(00)81282-9. [DOI] [PubMed] [Google Scholar]
- Laird D.W. The life cycle of a connexingap junction formation, removal, and degradation. J. Bioenerg. Biomembr. 1996;28:311–318. doi: 10.1007/BF02110107. [DOI] [PubMed] [Google Scholar]
- Laird D.W., Revel J.-P. Biochemical and immunochemical analysis of the arrangement of connexin43 in heart gap junction membranes. J. Cell Sci. 1990;97:109–117. doi: 10.1242/jcs.97.1.109. [DOI] [PubMed] [Google Scholar]
- Laird D.W., Castillo M., Kasprzak L. Gap junction turnover, intracellular trafficking and phosphorylation of Cx43 in brefeldin A-treated rat mammary tumor cells. J. Cell Biol. 1995;131:1193–1203. doi: 10.1083/jcb.131.5.1193. [DOI] [PMC free article] [PubMed] [Google Scholar]
- Lal R., John S.A. Biological application of atomic force microscopy. Am. J. Physiol. 1994;256:C1–C21. doi: 10.1152/ajpcell.1994.266.1.C1. [DOI] [PubMed] [Google Scholar]
- Lal R., Proksch R. Multimodal imaging with AFMcombined atomic force, light fluorescence and laser confocal microscopy and electrophysiological recordings of biological membranes. Int. J. Imaging Syst. Technol. 1997;8:293–300. [Google Scholar]
- Lal R., Laird D.W., Revel J.-P. Antibody perturbation analysis of gap junction permeability in rat cardiac myocytes. Pfulger's Arch. 1993;422:449–457. doi: 10.1007/BF00375070. [DOI] [PubMed] [Google Scholar]
- Lal R., Drake B., Blumberg D., Saner D., Hansma P.K., Feinstein S. Imaging neurite outgrowth and cytoskeletal reorganization with an atomic force microscopestudies on PC12 and NIH3T3 cells Am. J. Physiol. 269 1995. C275 C285a [DOI] [PubMed] [Google Scholar]
- Lal R., John S.A., Laird D.W., Arnsdorf M.F. Heart gap junction preparations reveal hemiplaques by atomic force microscopy Am. J. Physiol. 268 1995. C968 C977b [DOI] [PubMed] [Google Scholar]
- Lampe P.D. Analyzing phorbol ester effects on gap junction communicationa dramatic inhibition of assembly. J. Cell Biol. 1994;127:1895–1905. doi: 10.1083/jcb.127.6.1895. [DOI] [PMC free article] [PubMed] [Google Scholar]
- Li H., Liu T., Lazarak A., Peracchia C., Goldberg G.S., Lampe P.D., Johnson R.G. Properties and regulation of gap junctional hemichannels in the plasma membranes of cultured cells. J. Cell Biol. 1996;134:1019–1030. doi: 10.1083/jcb.134.4.1019. [DOI] [PMC free article] [PubMed] [Google Scholar]
- Musil L.S., Goodenough D.A. Biochemical analysis of connexin43 intra-cellular transport and assembly into gap junctional plaques. J. Cell Biol. 1991;115:1357–1374. doi: 10.1083/jcb.115.5.1357. [DOI] [PMC free article] [PubMed] [Google Scholar]
- Musil L.S., Goodenough D.A. Multisubunit assembly of an integral plasma membrane channel protein, gap junction connexin43, occurs after exit from the ER. Cell. 1993;74:1065–1077. doi: 10.1016/0092-8674(93)90728-9. [DOI] [PubMed] [Google Scholar]
- O'Neill W.C. Physiological significance of volume-regulatory transporters. Am. J. Physiol. 1999;276:C995–C1011. doi: 10.1152/ajpcell.1999.276.5.C995. [DOI] [PubMed] [Google Scholar]
- Parbhu A.N., Bryson W.G., Lal R. Disulfide bonds in the outer layer of keratin fibers confer higher mechanical rigiditynano-indentation and elasticity measurement with an AFM. Biochemistry. 1999;38:11755–11761. doi: 10.1021/bi990746d. [DOI] [PubMed] [Google Scholar]
- Parfitt A.M., Kleerekofer M. The divalent ion homeostasis systemphysiology and metabolism of calcium, phosphorus, magnesium, and bone. In: Maxwell M.H., Kleeman C.R., editors. Clinical Disorders of Fluid and Electrolyte Metabolism. McGraw Hill; NY: 1980. pp. 269–398. [Google Scholar]
- Paul D.L., Ebihara L., Takemoto L.J., Swenson K.I., Goodenough D.A. Connexin46, a novel lens gap junction protein, induces voltage-gated currents in nonjunctional plasma membrane of Xenopus oocytes. J. Cell Biol. 1991;115:1077–1089. doi: 10.1083/jcb.115.4.1077. [DOI] [PMC free article] [PubMed] [Google Scholar]
- Pfahnl A., Dahl G. Gating of Cx46 gap junctional hemichannels by calcium and voltage. Pfluger's Arch. 1999;437:345–353. doi: 10.1007/s004240050788. [DOI] [PubMed] [Google Scholar]
- Rahman S., Carlile G., Evans W.H. Assembly of hepatic gap junctions. J. Biol. Chem. 1993;268:1260–1265. [PubMed] [Google Scholar]
- Rajewsky M.F., Gruneisen A. Cell proliferation in transplanted rat tumorsinfluence of the host immune system. Eur. J. Immunol. 1972;2:445–447. doi: 10.1002/eji.1830020512. [DOI] [PubMed] [Google Scholar]
- Rhee S.K., Bevans C.G., Harris A.L. Channel-forming activity of immunoaffinity-purified connexin32 in single phospholipid membranes. Biochemistry. 1996;35:9212–9223. doi: 10.1021/bi960295m. [DOI] [PubMed] [Google Scholar]
- Rhee S.K., Quist A.P., Lal R. Amyloid beta protein (1–42) forms calcium permeable, Zn2+-sensitive channel. J. Biol. Chem. 1998;273:13379–13382. doi: 10.1074/jbc.273.22.13379. [DOI] [PubMed] [Google Scholar]
- Rose C.R., Ransom B.R. Gap junctions equalize intracellular Na+ concentration in astrocyte. Glia. 1997;20:299–307. doi: 10.1002/(sici)1098-1136(199708)20:4<299::aid-glia3>3.0.co;2-1. [DOI] [PubMed] [Google Scholar]
- Shroff S.G., Saner D.R., Lal R. Dynamic micromechanical properties of cultured rat atrial myocytes measured by AFM. Am. J. Physiol. 1995;269:C286–C292. doi: 10.1152/ajpcell.1995.269.1.C286. [DOI] [PubMed] [Google Scholar]
- Stewart A.F., Broadus E. Mineral metabolism. In: Felig P., Baxter J.D., Broadus A.E., Frohman L.A., editors. Endocrinology and Metabolism. McGraw Hill; NY: 1987. pp. 1317–1453. [Google Scholar]
- Toyofuku T., Yabuki M., Otsu K., Kuzuya T., Hori M., Tada M. Intercellular calcium signaling via gap junction in connexin-43 transfected cells. J. Biol. Chem. 1998;273:1519–1528. doi: 10.1074/jbc.273.3.1519. [DOI] [PubMed] [Google Scholar]
- Trexler E.B., Bennett M.V.L., Bargiello T.A., Verselis V.K. Voltage gating and permeation in a gap junction hemichannel. Proc. Natl. Acad. Sci. USA. 1996;93:5836–5841. doi: 10.1073/pnas.93.12.5836. [DOI] [PMC free article] [PubMed] [Google Scholar]
- Yancey B., John S., Lal R., Austin B., Revel J.-P. The 43-kD polypeptide of heart gap junctionsimmunolocalization, topology, and functional domains. J. Cell Biol. 1989;108:2241–2254. doi: 10.1083/jcb.108.6.2241. [DOI] [PMC free article] [PubMed] [Google Scholar]
- Zampighi G.A., Loo D.F.D., Kremin M., Eskandari S., Wright E.M. Functional and morphological correlates of connexin50 expressed in Xenopus laevis oocytes. J. Gen. Physiol. 1999;113:507–523. doi: 10.1085/jgp.113.4.507. [DOI] [PMC free article] [PubMed] [Google Scholar]


