

Abstract
Class I major histocompatibility complex (class I MHC) molecules, known to be important for immune responses to antigen, are expressed also by neurons that undergo activity-dependent, long-term structural and synaptic modifications. Here, we show that in mice genetically deficient for cell surface class I MHC or for a class I MHC receptor component, CD3ζ, refinement of connections between retina and central targets during development is incomplete. In the hippocampus of adult mutants, N-methyl-D-aspartate receptor–dependent long-term potentiation (LTP) is enhanced, and long-term depression (LTD) is absent. Specific class I MHC messenger RNAs are expressed by distinct mosaics of neurons, reflecting a potential for diverse neuronal functions. These results demonstrate an important role for these molecules in the activity-dependent remodeling and plasticity of connections in the developing and mature mammalian central nervous system (CNS).
The development of precise connections in the CNS is critically dependent on neural activity, which drives the elimination of inappropriate connections and the stabilization of appropriate ones. In the visual system of higher mammals, the refinement of initially imprecise axonal connections requires spontaneously generated activity early in development and visually driven activity later (1–4). Fine-tuning of neural connectivity is thought to result from changes in synaptic strength, driven by patterned impulse activity (1, 2, 5, 6).
To identify molecules critical for activity-dependent structural remodeling, we previously conducted an unbiased screen for mRNAs selectively regulated by blocking spontaneously generated activity in the developing cat visual system. This manipulation prevents the remodeling of retinal axons from each eye into layers within the lateral geniculate nucleus (LGN) (7–9). Although many known neural genes were not detectably regulated by activity blockade, this screen revealed to our surprise that members of the class I MHC protein family are expressed by neurons and are regulated by spontaneous and evoked neural activity (10). Neuronal class I MHC expression corresponds to well-characterized times and regions of activity-dependent development and plasticity of CNS connections, including retina, LGN, and hippocampus. Furthermore, the mRNA for CD3ζ [a class I MHC receptor subunit in the immune system (11)] is also expressed by neurons (10), consistent with its interaction with class I MHC during activity-dependent remodeling and plasticity. Although class I MHC is primarily known for its function in cell-mediated immune recognition, the above findings from our differential screen suggest that class I MHC molecules may play roles in structural and synaptic remodeling in the developing and mature CNS.
To explore these possibilities by genetic means, we first confirmed by in situ hybridization that class I MHC and CD3ζ were expressed in the developing mouse CNS. Because numerous class I MHC genes exist in the mouse genome (12), we used a pan-specific cDNA probe expected to detect many class I MHC molecules (13). This probe detected elevated amounts of mRNAs in the dorsal LGN (dLGN) during the first two postnatal weeks, exactly when ganglion cell axons sort into eye-specific layers in the mouse (14); mRNA levels declined at later ages (Fig. 1A, compare postnatal days P6 and P40). Expression was also evident in the ganglion cell layer of the retina (Fig. 1A, P6 eye), in neocortex (in layer 4 at early ages and in deeper layers later; Fig. 1A), and in granule and pyramidal cell layers of the hippocampus (Fig. 1A, P40, and Fig. 2). CD3ζ mRNA, like that of class I MHC, was expressed in the mouse dLGN during the first two postnatal weeks (Fig. 1B); expression appeared higher medially. CD3ζ mRNA was also detected in small amounts in P40 hippocampus (15). Therefore, as in cat (10), class I MHC and CD3ζ transcripts are present in the developing murine CNS at locations and times consistent with a role for these molecules in activity-dependent structural remodeling and synaptic plasticity.
Fig. 1.
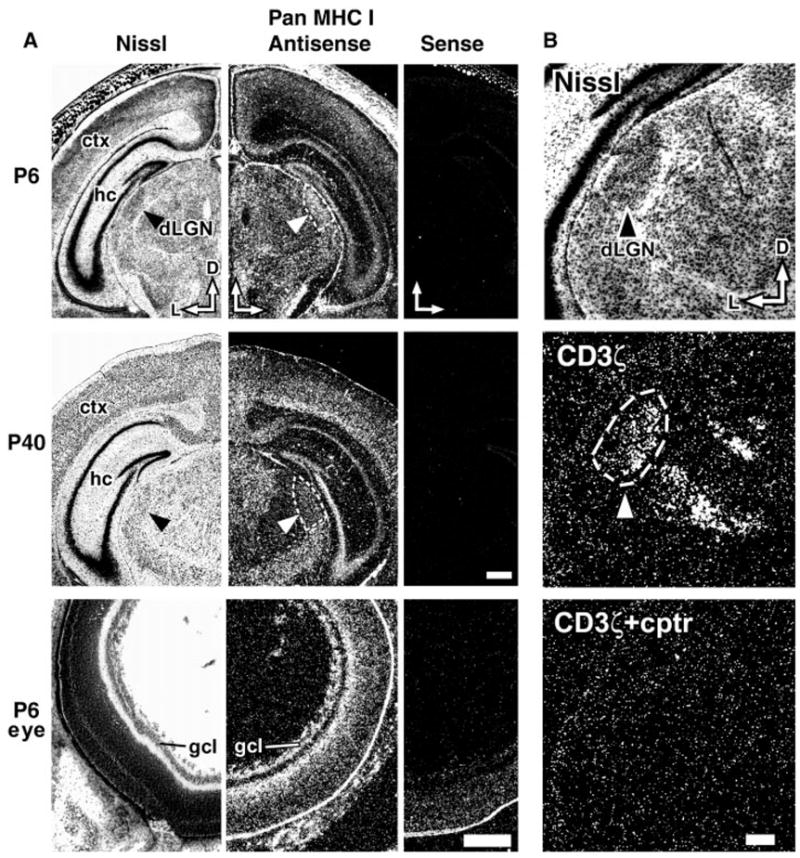
Class I MHC expression in mouse CNS. (A) Expression of class I MHC transcripts in coronal sections of the mouse CNS at P6 and P40 and in a cross section of P6 eye (13). Left column, adjacent Nissl-stained section; middle column, hybridization with antisense riboprobe under dark-field optics; right column, hybridization with control sense probe. D, dorsal; L, lateral; hc, hippocampus; ctx, neocortex; gcl, ganglion cell layer. Arrowheads and dashed lines indicate dLGN. Scale bar for P6 and P40 brains, 0.5 mm; scale bar for P6 eye, 250 μm. (B) Expression of CD3ζ in the dLGN during eye-specific layer formation. Upper panel, adjacent Nissl-stained coronal section of P6 mouse brain (arrowhead, dLGN). Middle panel, hybridization with CD3ζ antisense probe (dashed lines, dLGN); hybridization is also present in the ventroposterior nucleus of thalamus (down and to right of dLGN). Lower panel (cptr), excess of unlabeled competitor probe. Scale bar, 200 μm.
Fig. 2.
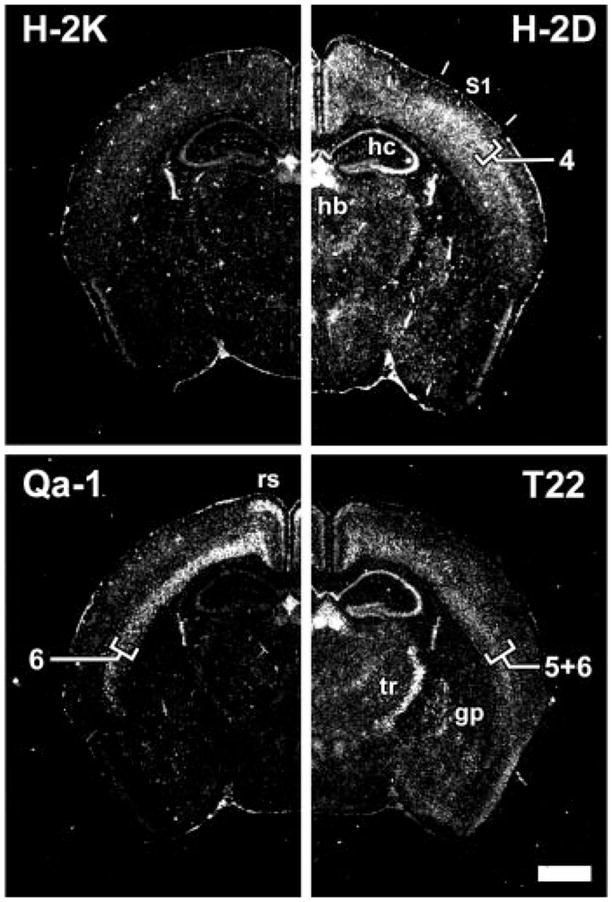
Expression of multiple class I MHC subclasses in distinct regions of the mature CNS. Coronal sections of P40 mouse brain analyzed by in situ hybridization, using subclass-specific probes indicated at top of each panel (13). S1, somatosensory cortex; hb, habenula; hc, hippocampus; rs, retrosplenial cortex; tr, thalamic reticular nucleus; gp, globus pallidus. Numerals (4, 6, 5+6) indicate neocortical layers. Scale bar, 1 mm.
Strikingly, different class I MHC genes are expressed in unique subsets of neurons throughout the mature CNS, as revealed by using probes (13) that react more specifically with each of two class Ia (H–2D, H–2K) or two class Ib MHC genes (Qa-1, T22). For example, within the somatosensory cortex, H–2D probe signal was distributed through many layers but was strongest in layer 4; Qa-1 signal was specific to layer 6, and T22 signal was evident in both layers 5 and 6 (Fig. 2). H–2D and T22 signals were both strong in the pyramidal layers of the hippocampus and in the habenula; in contrast, that of Qa-1 was weak in those locations (Fig. 2). Transcripts detected by the T22 probe were particularly abundant in the thalamic reticular nucleus, globus pallidus, and substantia nigra [Fig. 2 and (15)]. H–2K signal paralleled that of H–2D but was much lower throughout the brain (16). The distinct expression patterns detected by these probes extended prior inferences from RNase protection experiments in cat (10) and demonstrated conclusively that several class I MHC mRNA subtypes are differentially expressed by distinct subsets of neurons in the CNS. These findings suggest a potential for functional diversity among class Ia and Ib genes within the CNS. Such heterogeneity of function occurs among these genes within the immune system (17).
To test directly our hypothesis that class I MHC is required for activity-driven structural remodeling and synaptic plasticity, mice deficient either for cell surface class I MHC expression or for CD3ζ were analyzed. Because numerous class I MHC genes may be expressed by specific subsets of neurons (Fig. 2), we examined mice lacking two molecules required for the stable cell-surface expression of nearly all fully assembled class I MHC molecules: β2-microglobulin [β2M, a class I MHC cosubunit (18)], and TAP1 [a component of the transporter that supplies peptides to class I MHC enroute to the cell surface (19, 20)]. β2-M is expressed by neurons in LGN, cortex, and hippocampus (10) and, as in non-neuronal cells, induction of class I MHC on the cell surface of neurons requires expression of β2M and TAP1 mRNAs (21). In addition, to examine whether CD3ζ-containing receptors were involved in class I MHC–mediated signaling in the CNS, we analyzed mice lacking CD3ζ (22). When raised in a germ-free facility, all mutant mice are outwardly normal and are not obviously different from wild-type mice in weight, body length, appearance, or behavior.
We hypothesized that mice deficient in class I MHC–mediated signaling might have abnormal patterns of retinogeniculate projections because blockade of neural activity simultaneously prevents the segregation of retinal ganglion cell axons into eye-specific layers and reduces class I MHC expression in the LGN (7–10). The normal adult mouse dLGN has a small layer that receives inputs from ganglion cells in the ipsilateral eye; inputs from the contralateral eye occupy the remainder of the dLGN (Fig. 3A). The refinement of these eye-specific connections in the mouse occurs between postnatal day 4 (P4) and P8 (14). We therefore examined the distribution of retinal inputs at P13, 5 days after segregation was complete, using the anterograde transport of horseradish peroxidase–conjugated wheat germ agglutinin (WGA-HRP) injected into one eye (23). Compared with wild-type animals (Fig. 3, A and F, β2M+/+), the pattern of the retinogeniculate projection was significantly altered in all three mutant genotypes tested. This point is best appreciated by inspecting the size and shape of the ipsilateral retinal projection to the dLGN (Figs. 3, A to E). Although all mutants still form an ipsilateral patch located approximately normally in the mediodorsal dLGN, the area of this patch was significantly larger in mutant mice and, in extreme cases, was accompanied by multiple ectopic clusters of inputs that were never observed in wild-type mice (Fig. 3, C and E, arrowheads). These ectopic clusters appeared in medial areas of the dLGN, where the highest levels of CD3ζ mRNA are normally present (compare Fig. 3, C and E, with Fig. 1A). In these extreme cases, ectopic clusters were also observed in the ipsilateral superior colliculus, another retinorecipient target that expresses low-to-moderate levels of class I MHC mRNA in mouse (15).
Fig. 3.
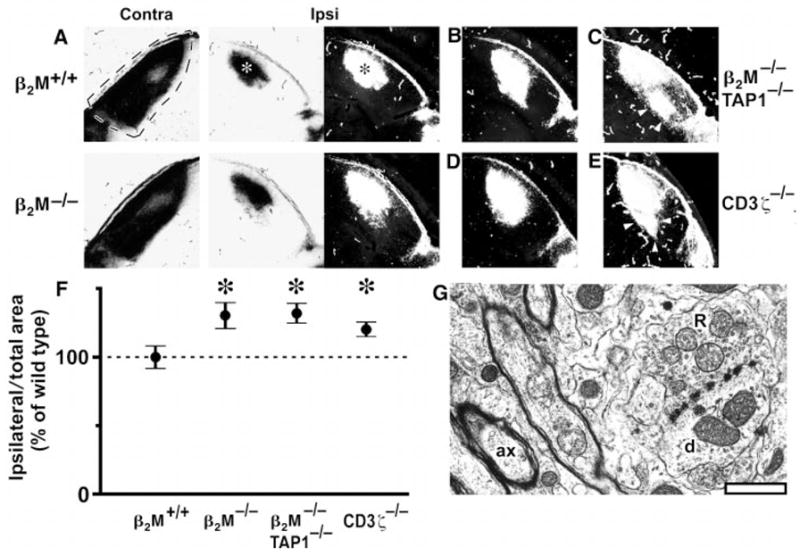
Abnormal retinogeniculate projections but normal dLGN ultrastructure in mice deficient in class I MHC signaling. At P12, one eye was injected with WGA-HRP (23); after 1 day, anterograde axonal transport results in labeling of the entire retinal projection to the LGN. Labeling pattern in the dLGN is shown in bright-field optics (label is black) or as dark-field composites [label is white; see (24)]. (A) Representative projection from retina to dLGN contralateral (dashed lines; coronal section; dorsal is up; lateral is left) or ipsilateral to eye injected with WGA-HRP (asterisks indicate labeled area from ipsilateral eye: lateral is to right) in a P13 β2M+/+ wild-type mouse and a β2M−/− mutant mouse. (B and C) Representative (B) and extreme (C) examples of the projection from the ipsilateral eye observed in β2M−/−TAP1−/− mice. (D and E) Representative (D) and extreme (E) examples of the projection in CD3ζ −/− mice. Arrowheads indicate ectopic projections, which appear extensive under the more sensitive dark-field optics. Scale bar, 200 μm. (F) Graph of areas (±SEM) occupied by the ipsilateral retinal projection to the LGN for β2M+/+ (wild-type), β2M−/−, β2M −/−TAP1−/−, and CD3ζ−/− mice (24), normalized to total dLGN area. The ipsilateral projection area in β2M+/+ animals is set as 100% (horizontal dashed line). Asterisks indicate significant differences from β2M+/+ mice (P < 0.05, Student’s two-tailed t test). (G), Electron micrograph of the dLGN from a β2M−/−TAP1−/− mouse (at P24), showing a typical R-type synaptic bouton (R) making contacts with a dendrite (d). A well-myelinated axon (ax) is also present in this field. Scale bar, 1 μm.
To assess quantitatively the altered retinogeniculate projection in mutant mice, computerized image analysis was used to measure the fraction of dLGN area occupied by the ipsilateral projection. All image analyses were carried out by an observer blind to genotype (24). In all mutant genotypes, there was a significant increase in area occupied by the ipsilateral projection over that of wild-type controls [Fig. 3F: β2M−/−, 130.3 ± 7.3% (n = 10); β2M−/−TAP1−/−, 133.3 ± 5.7% (n = 13); CD3ζ−/−, 122.7 ± 4.2% (n = 13); wild-type β2M+/+, 100.0 ± 9.1% (n = 12); P < 0.05, Student’s two-tailed t-test]. These observations support the hypothesis that class I MHC function is required for the developmental refinement of the retinal projections and the formation of precise eye-specific regions in the LGN.
Although the refinement of retinogeniculate axons was abnormal in mutant mice, many other aspects of LGN development appear to proceed normally. The histological appearance, size, shape, and location of the dLGN and thalamus, as viewed in Nissl-stained sections, were indistinguishable among all experimental groups (15). The bulk of the ipsilateral projection was positioned, as expected, in the binocular region of the dLGN. At the ultrastructural level, the synaptic organization of the LGN in β2M−/−TAP1−/− mice appeared qualitatively indistinguishable from that of wild type (23). Retinogeniculate axons were well-myelinated, and glomeruli and R-type synaptic boutons [hallmarks of retinogeniculate synapses; (25–27)] were present, indicating that normal retinal synapses do form in the LGN (Fig. 3G). These observations suggest that many activity-independent processes (1, 2, 28, 29) are not perturbed in mice with abnormal class I MHC function.
Because similar abnormalities in the ipsilateral projection result from blockade of spontaneous activity at comparable ages in the cat or ferret visual system (7–9), we tested whether the mutant retinogeniculate phenotypes were secondary to abnormal retinal activity. Calcium imaging of mutant retinas revealed spontaneous retinal waves with spatiotemporal properties indistinguishable from those of normal mice (30). Thus, we ascribe abnormalities in the mutant retinogeniculate projection directly to a loss of class I MHC signaling downstream of neural activity.
Because activity-dependent structural reorganizations during development are thought to arise from cellular mechanisms of synaptic plasticity (1, 2, 6), we next asked whether synaptic plasticity is altered in mutant mice. Because little is known about such mechanisms in the developing LGN, we used a well-characterized model system for studying long-lasting changes in the strength of synaptic transmission: the Schaffer collateral-CA1 synapse of the hippocampus (31, 32). Class I MHC and CD3ζ were both expressed in the adult hippocampus (Fig. 1) (10, 15). Furthermore, class I MHC immunoreactivity can be detected in synaptosome preparations, suggesting that some class I molecules are synaptically associated (33). We therefore assessed hippocampal synaptic plasticity in wild-type and mutant mice. Data collection was performed by an observer blind to genotype (34).
In wild-type mice (C57BL/6), tetanic stimulation (4 × 100 Hz) resulted in a sustained increase in the slope of the field excitatory postsynaptic potential (fEPSP) (167 ± 13% of pretetanus baseline; n = 15; Fig. 4, A and C). In contrast, in CD3ζ−/− mutant animals, LTP in response to the same tetanus was significantly enhanced relative to that in wild-type mice (248 ± 29% of baseline; n = 8; P < 0.05; Fig. 4, A and C). A similar enhancement of LTP was observed in β2M−/−TAP1−/− mutant mice (227 ± 22% of baseline; n = 10; P < 0.05; Fig. 4C). Basal synaptic transmission is not significantly different among all experimental groups (35). Enhanced LTP in gene knockout animals was not due to changes in inhibition, because GABAA-mediated transmission was blocked with 100 μM picrotoxin in all experiments. Nor was the enhanced LTP due to induction of an N-methyl-D-aspartate (NMDA) receptor-independent form of LTP, because LTP was completely abolished in all genotypes in the presence of the NMDA antagonist 2-amino-5-phosphonovalerate [50 μM D-APV; Fig. 4B and (36)].
Fig. 4.
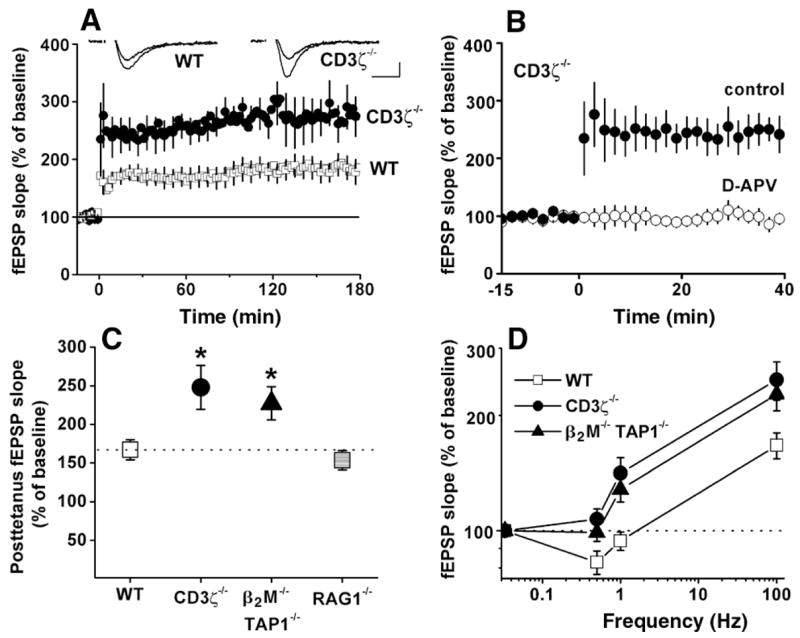
Enhanced hippocampal LTP in mice deficient either for cell surface class I MHC expression or for CD3ζ. (A) Field EPSP (fEPSP) slopes in wild-type versus CD3ζ −/−-deficient mice. Tetanus was applied at time 0. (Insets) Superimposed sample fEPSPs recorded 10 min before or 180 min after tetanic stimulation from individual wild-type (left) and CD3ζ−/− (right) slices. Scale bar, 10 msec/0.25 mV. (B) NMDA receptor dependence of LTP in CD3ζ-deficient mice. Tetanus was applied at time 0 either in the absence [filled circles; from (A)] or presence (hollow circles) of 50 μM D-APV. All points in (A) and (B) are averages of four consecutive fEPSPs (means ± SEM, normalized to 15-min baseline) recorded from CA1. (C) Graphs summarizing degree of potentiation in wild-type, β2M−/−TAP1−/−, CD3ζ−/−, or RAG1−/− mice after 100-Hz tetanus. Data are shown for mice with histologically normal brains (48). Asterisks indicate significant differences from wild type (one-way ANOVA, P < 0.05). (D) Relation (logarithmic plot) between synaptic enhancement and stimulation frequency. Points at 0.033 Hz (test pulse frequency) indicate baseline values (horizontal dashed line). Points at 100 Hz are taken from (C). Values in (C) and (D) are mean fEPSP slopes for each genotype over the 1-hour period following tetanus. See text and (34) for methods.
It is conceivable that enhancement of LTP seen in these genotypes is due to some non-specific effect of immune compromise on the CNS. Thus we also examined LTP in a more severely immunodeficient strain of mice that lacks recombination activating gene-1 (RAG1). RAG1 is required for production of B and T cells and is also transcribed by neurons in the CNS (37, 38). LTP in RAG1−/−mice was indistinguishable from that of wild type [153 ± 13% of baseline (n = 10), compared with 167 ± 13% in wild type; P = 0.48; Fig. 4C], indicating that the LTP abnormalities seen in β2M−/−TAP1−/− or CD3ζ−/− mice are specific to their genotypes rather than to immune status.
Synaptic plasticity in the hippocampus is dependent on stimulation frequency, with high frequencies producing LTP and low frequencies producing LTD (31, 39–41). We therefore examined the effect of other stimulation frequencies on synaptic plasticity in animals deficient for class I MHC signaling. In adult wild-type slices, the delivery of 900 pulses at 0.5 Hz induced significant LTD (82 ± 6% of baseline; n = 8; P < 0.05; Fig. 4D). In adult slices from both mutant genotypes, however, there was no significant change in fEPSP slope upon 0.5 Hz stimulation [CD3ζ−/−, 107 ± 7% of baseline (n = 5, P = 0.29); β2M−/−TAP1−/−, 99 ± 5% of baseline (n = 8, P = 0.78); Fig. 4D]. Furthermore, after 900 pulses at 1 Hz, transmission was significantly enhanced over baseline in both CD3ζ−/− (141 ± 14% of baseline, n = 5, P < 0.05) and β2M−/−TAP1−/− slices (128 ± 9%, n = 6, P < 0.05) but was unchanged in wild-type slices (94 ± 5%, n = 14, P = 0.41; Fig. 4D). Thus, in mutant mice, LTD could not be detected, and the frequency-response curve of hippocampal synaptic plasticity was consistently shifted across a broad range of stimulation frequencies.
These results indicate that class I MHC/CD3ζ signaling is important for mediating activity-dependent synaptic depression, because, in mutants, there is a shift in the bidirectional regulation of synaptic strength [i.e., the frequency response function (39–41)] that favors potentiation. In the absence of class I MHC or CD3ζ, patterns of neural activity that normally have no effect on synaptic strength or that lead to synaptic depression result, instead, in abnormal synaptic strengthening. Likewise, in the dLGN, enhanced LTP and lack of LTD at the developing retinogeniculate synapse could account for the structural phenotype observed: a persistence of inappropriate connections that would be normally be removed via an activity-dependent process of synaptic weakening during eye-specific segregation (14, 42–44).
Class I MHC and CD3ζ are expressed in the CNS by specific sets of neurons that undergo activity-dependent changes (10). Here, we show that mice lacking these molecules exhibit abnormalities in connections between these neurons, suggesting a direct neuronal function for class I signaling. In addition, both mutants have strikingly similar phenotypes, implying that class I MHC signaling in the brain is transduced via a CD3ζ-containing receptor, either an unknown CNS-specific or a known immune receptor. The expression patterns of class I MHC and CD3ζ in the CNS are consistent with signaling via a number of possible receptor-ligand configurations. For example, both class I MHC and CD3ζ are expressed by neurons in the hippocampus; in addition, class I MHC mRNA is also expressed by retinal ganglion cells when CD3ζ is detected in the dLGN [Fig. 1A and (10)]. Detailed information concerning the ultrastructural localization of these molecules will be needed to resolve this issue.
Whatever the case, the evidence to date supports a model in which class I MHC functions in the CNS by engaging CD3ζ-containing receptors to signal activity-dependent changes in synaptic strength that ultimately lead to the establishment of appropriate synapses. Class I MHC may act directly at the synapse to promote the elimination of inappropriate connections, by using signaling mechanisms already characterized in immune cells (11), possibly via phosphorylation of CD3ζ by fyn [a kinase previously implicated in hippocampal plasticity (45)]. Because different class I MHC members are expressed by different subsets of CNS neurons, additional signaling specificity may be furnished by the particular repertoire of MHC molecules present in any given neuron. In the immune system, recognition of class I MHC by T cell receptors can result in functional elimination of inappropriate self-reactive T cell populations (46, 47). Our results demonstrate that class I MHC is also required for normal regressive events in the developing and adult CNS, including activity-dependent synaptic weakening and structural refinement.
References and Notes
- 1.Goodman CS, Shatz CJ. Cell. 1993;72:77. doi: 10.1016/s0092-8674(05)80030-3. [DOI] [PubMed] [Google Scholar]
- 2.Katz LC, Shatz CJ. Science. 1996;274:1133. doi: 10.1126/science.274.5290.1133. [DOI] [PubMed] [Google Scholar]
- 3.Crair MC. Curr Opin Neurobiol. 1999;9:88. doi: 10.1016/s0959-4388(99)80011-7. [DOI] [PubMed] [Google Scholar]
- 4.Wong RO. Annu Rev Neurosci. 1999;22:29. doi: 10.1146/annurev.neuro.22.1.29. [DOI] [PubMed] [Google Scholar]
- 5.Shatz CJ. Neuron. 1990;5:745. doi: 10.1016/0896-6273(90)90333-b. [DOI] [PubMed] [Google Scholar]
- 6.Feldman DE, Nicoll RA, Malenka RC. J Neurobiol. 1999;41:92. [PubMed] [Google Scholar]
- 7.Shatz CJ, Stryker MP. Science. 1988;242:87. doi: 10.1126/science.3175636. [DOI] [PubMed] [Google Scholar]
- 8.Sretavan DW, Shatz CJ, Stryker MP. Nature. 1988;336:468. doi: 10.1038/336468a0. [DOI] [PubMed] [Google Scholar]
- 9.Penn AA, Riquelme PA, Feller MB, Shatz CJ. Science. 1998;279:2108. doi: 10.1126/science.279.5359.2108. [DOI] [PubMed] [Google Scholar]
- 10.Corriveau RA, Huh GS, Shatz CJ. Neuron. 1998;21:505. doi: 10.1016/s0896-6273(00)80562-0. [DOI] [PubMed] [Google Scholar]
- 11.van Leeuwen JE, Samelson LE. Curr Opin Immunol. 1999;11:242. doi: 10.1016/s0952-7915(99)80040-5. [DOI] [PubMed] [Google Scholar]
- 12.Amadou C, et al. Immunol Rev. 1999;167:211. doi: 10.1111/j.1600-065x.1999.tb01394.x. [DOI] [PubMed] [Google Scholar]
- 13.The pan-specific class I MHC probe was obtained by reverse transcription–polymerase chain reaction (RT-PCR) of adult rat spleen total RNA, using primers targeting the α3 domain of the rat class I MHC molecule rat RT1.Aa [nucleotides (nts) 673 to 859 of GenBank accession M31018; primers were 5′-GATGTSACCC TGAGG TGCTG-3′ and 5′-GGCAT GTGTA MYTCT GCTCC-3′]. The resultant clone RATMHC1 exhibited greater than 95% homology with all mouse class Ia, as well as many class Ib, MHC sequences. Subclass-specific class I MHC probes were cloned from mouse CNS by RT-PCR of C57BL/6 mouse hippocampal RNA; primers targeted a segment that varies considerably among class Ia and Ib subfamily members [nts 143 to 463 of GenBank accession U47325 (H–2Db); primers were 5′-NNGTN GGCTA YGTKG ACRAC-3′ and 5′-KYRGG TYYTC RTTCA GGG-3′]. Clones corresponding to H–2Db, H–2Kb (12), Qa-1b, and T22b [ Lalanne JL, et al. Cell. 1985;41:469. doi: 10.1016/s0092-8674(85)80020-9.Van Kaer L, et al. Immunol Rev 12089.1991. ] were identified via BLAST database comparison. Cloning of CD3ζ from mouse spleen RNA and in situ hybridization analysis were carried out as described 101830863
- 14.Godement P, Salaeun J, Imbert M. J Comp Neurol. 1984;230:552. doi: 10.1002/cne.902300406. [DOI] [PubMed] [Google Scholar]
- 15.G. S. Huh et al., data not shown.
- 16.Cross-hybridization between D, Qa-1, and T22 probes was minimal, as assessed by cross-competition studies: cohybridization of each labeled riboprobe with a 10,000-fold mass excess of homologous unlabeled transcript abolished all signal, whereas cohybridization with an excess of the other two unlabeled transcripts resulted in little if any alteration in the hybridization pattern.
- 17.Shawar SM, Vyas JM, Rodgers JR, Rich RR. Annu Rev Immunol. 1994;12:839. doi: 10.1146/annurev.iy.12.040194.004203. [DOI] [PubMed] [Google Scholar]
- 18.Zijlstra M, et al. Nature. 1990;344:742. doi: 10.1038/344742a0. [DOI] [PubMed] [Google Scholar]
- 19.Dorfman JR, Zerrahn J, Coles MC, Raulet DH. J Immunol. 1997;159:5219. [PubMed] [Google Scholar]
- 20.Jackson MR, Peterson PA. Annu Rev Cell Biol. 1993;9:207. doi: 10.1146/annurev.cb.09.110193.001231. [DOI] [PubMed] [Google Scholar]
- 21.Neumann H, Schmidt H, Cavalie A, Jenne D, Wekerle H. J Exp Med. 1997;185:305. doi: 10.1084/jem.185.2.305. [DOI] [PMC free article] [PubMed] [Google Scholar]
- 22.Love PE, et al. Science. 1993;261:918. doi: 10.1126/science.7688481. [DOI] [PubMed] [Google Scholar]
- 23.All surgeries on postnatal mice were performed according to institutional guidelines and approved protocols. β2M−/− (5× backcrossed to C57BL/6) and β2M−/−TAP1−/− double mutant mice (5× backcrossed to C57BL/6) were obtained from D. Raulet (University of California at Berkeley) (18, 19). CD3ζ−/− mice (22) (8× backcrossed to C57BL/6) and RAG1−/− mice (38) (10× backcrossed to C57BL/6) were obtained from Jackson Laboratories (Bar Harbor, ME). As part of the blind study, β2M+/− heterozygotes (from β2M−/− × C57BL/6 crosses) were intercrossed; β2M+/+ and β2M−/− pups were not revealed until after image analysis was complete. P12 mouse pups were anesthetized with isoflurane, and one eye was injected with 1 to 2 μl WGA-HRP (4 to 10% in saline; L7017 from Sigma, St. Louis, MO, or PL-1026 from Vector Laboratories, Burlingame, CA). After 22 to 26 hours, 50-μm brain sections were prepared for histology essentially as described (9); the nitroprusside solution used to stabilize the reaction product was ice-cold and included 10 mM sodium acetate (pH 3.3). For electron microscopy of β2M−/−TAP1−/− mice, P24 animals were perfused first with buffer (0.1 M sodium cacodylate pH 7.35, 5 U/ml heparin) and then 1% paraformaldehyde, 2% glutaraldehyde, 0.2% acrolein, and 4 mM CaCl2 in buffer. The thalamus was fixed overnight at 4°C; dLGN was isolated from 150-μm Vibratome sections and processed for electron microscopy.
- 24.The following series of steps was carried out on all slide sets by an observer blind to genotype. Only sets exhibiting equivalent degrees of anterograde labeling were selected for analysis. Eight-bit TIFF images containing the dLGN were acquired on a Macintosh-linked charge-coupled device camera (MTI VE1000) attached to a Nikon Microphot FXA. Using NIH Image (v1.62b7), images of the dLGN ipsilateral and contralateral to the injected eye were cropped to exclude ventral LGN, intrageniculate leaf and extrageniculate optic tract; images of ipsilateral dLGN were also modified to eliminate the optic tract running above the dLGN. NIH Image macros were used to eliminate background blood vessel-derived staining (very heavily stained blood vessels were removed by hand) and to calculate areas occupied by retinal projections (9). For each brain, an internally controlled measure of the area occupied by the ipsilateral projection was obtained by dividing the average of the four largest ipsilateral areas (corresponding to the middle third of the dLGN) by the average of the four largest total dLGN areas (assessed by the outer boundaries of the contralateral projection zones). Sections in Fig. 3, A to E, were photographed in both bright-field and dark-field optics. Although dark-field optics are more sensitive and reveal lightly labeled regions as white, very heavily labeled regions become saturated and appear black. Therefore, for accuracy, composites of bright-field and dark-field images of the same section were constructed to ensure that heavily labeled regions appeared white, while detailed information about lightly-labeled regions revealed in dark-field was preserved.
- 25.Aggelopoulos N, Parnevelas JG, Edmunds S. Anat Embryol (Berl) 1989;180:243. doi: 10.1007/BF00315883. [DOI] [PubMed] [Google Scholar]
- 26.Rafols JA, Valverde F. J Comp Neurol. 1973;150:303. doi: 10.1002/cne.901500305. [DOI] [PubMed] [Google Scholar]
- 27.Lieberman AR, Webster KE. J Neurocytol. 1974;3:677. doi: 10.1007/BF01097191. [DOI] [PubMed] [Google Scholar]
- 28.Tessier-Lavigne M. Cell. 1995;82:345. doi: 10.1016/0092-8674(95)90421-2. [DOI] [PubMed] [Google Scholar]
- 29.Feldheim DA, et al. Neuron. 1998;21:1303. doi: 10.1016/s0896-6273(00)80650-9. [DOI] [PubMed] [Google Scholar]
- 30.D. Stellwagen, G. S. Huh, C. J. Shatz, data not shown.
- 31.Malenka RC, Nicoll RA. Science. 1999;285:1870. doi: 10.1126/science.285.5435.1870. [DOI] [PubMed] [Google Scholar]
- 32.Bliss TV, Collingridge GL. Nature. 1993;361:31. doi: 10.1038/361031a0. [DOI] [PubMed] [Google Scholar]
- 33.Supplementary data are available on Science Online at www.sciencemag.org/cgi/content/full/290/5499/2155/DC1
- 34.Slices of mouse brain 400 μm thick (from 8- to 17-week-old animals, killed with halothane) were maintained at 25°C in a submerged recording chamber (perfused at 2 to 3 ml/min) with artificial cerebrospinal fluid (ACSF: 126 mM NaCl, 2.5 mM KCl, 1.25 mM NaH2PO4, 1.3 mM MgSO4, 2.5 mM CaCl2, 26 mM NaHCO3, and 10 mM glucose). Connections to the CA3 region of the hippocampus were cut, and 100 μM picrotoxin (Sigma) was added to the bath ACSF. Stainless-steel bipolar electrodes were used to stimulate Schaffer collateral/commissural fibers; glass microelectrodes filled with ACSF (2 to 6 MΩ) were inserted into the stratum radiatum to record currents from populations of CA1 pyramidal cells. Test pulses (0.033 Hz) were applied at a stimulation intensity required to produce an fEPSP that was 30% (for 100 Hz stimulation) or 50% (for 0.5 and 1 Hz stimulation) of the maximal response for each recording. High-frequency stimulation (tetanus) consisted of four trains of 100 pulses at 100 Hz (inter-train interval 15 s), applied at time 0. All values are reported as means ± SEM, n is the number of slices (one slice per mouse). Data collection was performed by an observer blind to genotype. Before the blind was dropped, recordings were omitted from analysis if the extracellular resistance changed significantly (3/94) or if the stimulating electrode had visibly drifted over the course of the recording (4/94). LTP was calculated as the average of responses between 0 and 60 min after tetanus, normalized to a 15-min pretetanus control period. Stimulus intensity was relatively high because of the use of electrodes with uninsulated tips to maximize the number of fibers stimulated. Stimulus artifacts were clearly complete well before fEPSP onset and so were easily excluded from analysis. In experiments using D-APV, drug was added at least 30 min before tetanic stimulation and was present throughout the entire recording. Statistical significance was assessed by two-tailed one-way ANOVA or Student’s t-test.
- 35.Pretetanus test pulse fEPSP slopes for mice with normal ventricles (millivolts per millisecond) were as follows: wild type, 0.091 ± 0.007 (n = 14); CD3ζ−/−, 0.091 ± 0.009 (n = 8, P = 0.95 compared with wild type); β2M−/−TAP1−/−, 0.089 ± 0.010 (n = 9, P = 0.85). Stimulation intensities required to evoke an fEPSP at 30% of the maximal response (in microamperes) were as follows: wild type, 136 ± 27; CD3ζ−/−, 134 ± 24 (P = 0.75 compared with wild type); β2M−/−TAP1−/−, 128 ± 17 (P = 0.59).
- 36.Posttetanus fEPSP slopes, averaged over 180 min, did not differ significantly from baseline in the presence of 50 μM D-APV: wild type, 107 ± 14% (n = 3; P = 0.64); CD3ζ−/−, 97 ± 9% (n = 3; P = 0.93); and β2M−/−TAP1−/−, 106 ± 10% (n = 5; P = 0.56, Student’s t-test).
- 37.Chun JJ, Schatz DG, Oettinger MA, Jaenisch R, Baltimore D. Cell. 1991;64:189. doi: 10.1016/0092-8674(91)90220-s. [DOI] [PubMed] [Google Scholar]
- 38.Mombaerts P, et al. Cell. 1992;68:869. doi: 10.1016/0092-8674(92)90030-g. [DOI] [PubMed] [Google Scholar]
- 39.Bear MF. Neuron. 1995;15:1. doi: 10.1016/0896-6273(95)90056-x. [DOI] [PubMed] [Google Scholar]
- 40.Deisseroth K, Bito H, Schulman H, Tsien RW. Curr Biol. 1995;5:1334. doi: 10.1016/s0960-9822(95)00262-4. [DOI] [PubMed] [Google Scholar]
- 41.Migaud M, et al. Nature. 1998;396:433. doi: 10.1038/24790. [DOI] [PubMed] [Google Scholar]
- 42.So KF, Campbell G, Lieberman AR. J Exp Biol. 1990;153:85. doi: 10.1242/jeb.153.1.85. [DOI] [PubMed] [Google Scholar]
- 43.Campbell G, Shatz CJ. J Neurosci. 1992;12:1847. doi: 10.1523/JNEUROSCI.12-05-01847.1992. [DOI] [PMC free article] [PubMed] [Google Scholar]
- 44.Sretavan DW, Shatz CJ. J Neurosci. 1986;6:234. doi: 10.1523/JNEUROSCI.06-01-00234.1986. [DOI] [PMC free article] [PubMed] [Google Scholar]
- 45.Grant SG, et al. Science. 1992;258:1903. doi: 10.1126/science.1361685. [DOI] [PubMed] [Google Scholar]
- 46.Amsen D, Kruisbeek AM. Immunol Rev. 1998;165:209. doi: 10.1111/j.1600-065x.1998.tb01241.x. [DOI] [PubMed] [Google Scholar]
- 47.Sebzda E, et al. Annu Rev Immunol. 1999;17:829. doi: 10.1146/annurev.immunol.17.1.829. [DOI] [PubMed] [Google Scholar]
- 48.When brains of otherwise normal-appearing animals at age P13 were examined, 52% (16/31) of β2M−/−TAP1−/− mice and 22% of CD3ζ−/− mice (10/45) had enlarged lateral ventricles. This phenotype is unlikely to be due to immunocompromise because severely immunodeficient RAG1−/− mice, when cohoused in our facility, do not exhibit this phenotype (0/18). This phenotype also occurs in 57% (12/21) of β2M−/−TAP1−/− and 20% (2/10) of CD3ζ−/− adult mice. Although ventricular enlargement does not affect the appearance of the dLGN and thalamus (assessed by Nissl stains), the size, placement, and appearance of extrathalamic structures such as the hippocampus can be altered. In the LTP analysis, animals with enlarged ventricles were treated separately because in these animals, LTP measurements could be confounded by abnormal hippocampal architecture and the known reduction of LTP by hydrocephalus [ Tsubokawa T, Katayama Y, Kawamata T. Brain Inj. 1988;2:19. doi: 10.3109/02699058809150929.]. Consistent with the latter idea, LTP at 100 Hz in β2M−/−TAP1−/− mice with dilated ventricles, while still present, is significantly lower than that of β2M −/−TAP1−/− mice with normal-appearing brains (168 ± 15% relative to 227 ± 22%; P < 0.05). CD3ζ−/− mice with dilated ventricles also displayed diminished LTP (data not shown).
- 49.We thank S. Wiese, C. Cowdrey, and H. Aaron for expert technical assistance; D. Stellwagen for examination of retinal waves in mutant mice; A. Toroian-Raymond for assistance with electron microscopy; M. Bennett and E. Choi for advice and assistance with synaptosome preparations; D. Raulet for generously providing β2M−/− and β2M−/−TAP1−/− mice. Supported in part by grant NIH MH48108 and an Alcon Research Institute Award to C.J.S. G.S.H. and L.M.B. were Howard Hughes Associates. L.M.B. was supported by NRSA 1F32EY07016. H.D. was supported by NRSA EY06912.