

Summary
Cholera toxin (CT) moves from the cell surface to the endoplasmic reticulum (ER) by vesicular transport. In the ER, the catalytic CTA1 subunit dissociates from the holotoxin and enters the cytosol by exploiting the quality control system of ER-associated degradation (ERAD). It is hypothesized that CTA1 triggers its ERAD-mediated translocation into the cytosol by masquerading as a misfolded protein, but the process by which CTA1 activates the ERAD system remains unknown. Here, we directly assess the thermal stability of the isolated CTA1 polypeptide by biophysical and biochemical methods and correlate its temperature-dependent conformational state with susceptibility to degradation by the 20S proteasome. Measurements with circular dichroism and fluorescence spectroscopy demonstrated that CTA1 is a thermally unstable protein with a disordered tertiary structure and a disturbed secondary structure at 37°C. A protease sensitivity assay likewise detected the temperature-induced loss of native CTA1 structure. This protease-sensitive conformation was not apparent when CTA1 remained covalently associated with the CTA2 subunit. Thermal instability in the dissociated CTA1 polypeptide could thus allow it to appear as a misfolded protein for ERAD-mediated export to the cytosol. In vitro, the disturbed conformation of CTA1 at 37°C rendered it susceptible to ubiquitin-independent degradation by the core 20S proteasome. In vivo, CTA1 was also susceptible to degradation by a ubiquitin-independent proteasomal mechanism. ADP-ribosylation factor 6, a cytosolic eukaryotic protein that enhances the enzymatic activity of CTA1, stabilized the heat-labile conformation of CTA1 and protected it from in vitro degradation by the 20S proteasome. Thermal instability in the reduced CTA1 polypeptide has not been reported before, yet both the translocation and degradation of CTA1 may depend upon this physical property.
Keywords: ADP-ribosylation factor, circular dichroism, endoplasmic reticulum-associated degradation, 20S proteasome, toxin translocation
Introduction
Cholera toxin (CT) is an AB5-type protein toxin that constitutively activates the stimulatory α subunit of the heterotrimeric G protein (Gsα) by ADP-ribosylation.1,2 The A subunit of CT is a single polypeptide that can be converted by proteolysis to a disulfide-linked heterodimer consisting of a catalytic CTA1 fragment and a CTA2 fragment which anchors CTA1 non-covalently to the CTB subunit. The CTB subunit is a homopentameric ring-like structure that binds to GM1 gangliosides on the eukaryotic plasma membrane. Surface-bound CT undergoes vesicular trafficking to the endoplasmic reticulum (ER) where the disulfide bond linking CTA1 to CTA2/CTB5 is reduced at the resident redox potential of the ER.3,4 CTA1 then dissociates from the holotoxin with the aid of protein disulfide isomerase,5,6 crosses the ER membrane, and enters the cytosol where it interacts with Gsα.
The quality control mechanism of ER-associated degradation (ERAD) facilitates CTA1 translocation into the cytosol.4,6-12 ERAD recognizes misfolded proteins in the ER and exports them to the cytosol for proteasomal degradation, most often by a mechanism involving polyubiquitination of the ERAD substrate.12-13 It is hypothesized that CTA1 masquerades as a misfolded protein, thus triggering its ERAD-mediated translocation into the cytosol.12,14-15 The cytosolic pool of CTA1 may then avoid ubiquitination and proteasomal degradation because it only has two lysine residues to serve as potential attachment sites for ubiquitin.14,16
AB toxins such as ricin and pertussis toxin (PT) also move from the cell surface to the ER and exploit ERAD for A chain export to the cytosol.12,14-15 ERAD was originally thought to recognize a hydrophobic patch or an unfolded region in the dissociated A chain of an ER-translocating toxin.14,15 However, Argent et al. demonstrated that ricin A chain is unstable after separation from the holotoxin.17 A subsequent report documented thermal instability in the isolated A chain of PT (PT S1).18 Thus, ricin A chain and PT S1 actually unfold after dissociation from their respective holotoxins. This would activate the ERAD system and promote A chain passage to the cytosol. Ricin A chain is refolded by an interaction with its ribosome target, while PT S1 is stabilized by the association with its NAD co-factor.17,18 These events could allow the heat-labile A chains to assume active conformations in the cytosol and to avoid the usual proteolytic fate of ERAD substrates. Ricin A chain and PT S1 are further protected from ubiquitin-dependent proteasomal degradation because they have few (ricin A chain) or no (PT S1) lysine residues for ubiquitin conjugation.19,20 Interestingly, though, both ricin A chain and PT S1 are degraded in vivo and/or in vitro by ubiquitin-independent proteasomal mechanisms.18-19,21 These observations collectively suggest that A chain instability could represent a common theme in toxin-ERAD interactions.
The CT holotoxin and the CT B pentamer are thermally stable,22,23 but the conformational stability of the isolated CTA1 polypeptide has not been determined. In this work, biophysical and biochemical methods were used to examine the thermal stability of CTA1. We found CTA1 to be a thermally unstable protein that loses most of its tertiary structure and a considerable fraction of its α-helical secondary structure at the physiological temperature of 37°C. The heat-labile CTA1 polypeptide was also susceptible to ubiquitin-independent degradation by the core 20S proteasome. Covalent association of CTA1 with CTA2 provided a degree of conformational stability to CTA1 and prevented its in vitro degradation by the 20S proteasome. An interaction between CTA1 and ADP-ribosylation factor 6 (ARF6), a cytosolic eukaryotic protein that enhances the catalytic activity of CTA1, also provided a degree of conformational stability to CTA1 and likewise prevented its in vitro degradation by the 20S proteasome. In vivo, CTA1 was degraded by a temperature-sensitive, ubiquitin-independent proteasomal mechanism. These results indicate that thermal instability in the isolated CTA1 polypeptide plays an important role in host-toxin interactions.
Results
Structure of the CT holotoxin and the CTA1 polypeptide
Schematic representations of the CT holotoxin, the CTA1/CTA2 heterodimer, and the isolated CTA1 polypeptide are provided in Figure 1 (Protein Data Bank entry 1S5F). Based on the crystal structure of CT (Figure 1(a)),24 the A1/A2 heterodimer exhibits an α/β-type structure: the 192-residue A1 subunit contains 22% α-helix and 17% β-sheet content, while the 45-residue A2 subunit has 67% α-helix and no β-sheet content (Figure 1(b)). The disulfide-bridged CTA1/CTA2 heterodimer thus contains a total of 30% α-helix and 14% β-sheet content.
Figure 1.

Ribbon diagrams of CT and the CTA subunits. (a-c): Structural models for CT (a), the disulfide-linked CTA1/CTA2 heterodimer (b), and the isolated CTA1 polypeptide (c) are based upon the X-ray crystal structure of CT as determined by O'Neal et al. (Protein Data Bank entry 1S5F).24 Images were generated using the WebLab Viewer Lite molecular modeling and visualization software.
CT moves from the cell surface to the ER as an intact AB5 holotoxin, but environmental conditions in the ER promote reduction of the CTA1/CTA2 disulfide bond and dissociation of CTA1 from CTA2/CTB5.3-6 CTA1 (Figure 1(c)) is then recognized as a misfolded protein for ERAD-mediated translocation into the cytosol. We have recently proposed that thermal instability in the isolated CTA1 polypeptide could generate an unfolded toxin conformation which activates the ERAD system.25 The ProtParam function of ExPASy-SWISS-PROT assigns the CTA1 subunit an instability index of 41.6, which indeed classifies CTA1 as an unstable protein (see Materials and Methods).26 Although CTA1 conformational instability is predicted from computer modeling, this possibility has not been directly tested. Biophysical experiments were therefore conducted in order to determine the conformational stability of the isolated CTA1 polypeptide.
Covalent association of CTA1 with CTA2 provides a degree of conformational stability to CTA1
Thermotropic conformational changes in the secondary and tertiary structures of CTA1 were detected by circular dichroism (CD) and fluorescence spectroscopy. Studies were conducted with a purified CTA1/CTA2 heterodimer in both reduced and disulfide-bridged forms. Non-reducing SDS-PAGE and gel filtration chromatography confirmed the complete dissociation of CTA1 from CTA2 under our 10 mM β-mercaptoethanol (β-ME) reducing conditions (Figure 2). Near- and far-UV CD, as well as fluorescence spectra, were measured sequentially at each temperature on the same sample contained in a rectangular quartz cuvette (Figure 3). The near-UV CD signal between 260 and 290 nm is generated by the aromatic side chains and becomes weaker upon loosening of protein tertiary structure and weakening of the chiral environment of side chains.27 By near-UV CD, we demonstrated a tertiary structure transition temperature (Tm; the midpoint of transition) of 32°C in the reduced form (Figure 3(a) and (g)) and 38.5°C in the disulfide-bridged form of CTA1/CTA2 (Figure 3(d) and (g)). Heating the protein sample caused a red shift and a decrease in the intensity of tryptophan fluorescence in both oxidized and reduced states of cysteines (Figure 3(b) and (e)). Both effects are apparently due to the exposure of tryptophans to water, as the fluorescence intensity is quenched by the aqueous solution itself and probably by trace amounts of dissolved molecular oxygen from the air.28 The heat-induced red shift of tryptophan fluorescence indicated increased solvent relaxation with increasing temperature. Temperature dependencies of the peak fluorescence wavelengths (i.e., the red shifts) showed a Tm of 36.2°C in the reduced form (Figure 3(b) and (h)) and a Tm of 41.5°C in the disulfide-bridged form of CTA1/CTA2 (Figure 3(e) and (h)). At low temperatures, the far-UV CD spectra of the disulfide-bridged protein exhibited a minimum around 208 nm and a well-defined shoulder around 222 nm (Figure 3(f)). This suggested an α/β-type structure, which was consistent with the crystal structure of CT (Figure 1).24 Under reducing conditions, the far-UV CD spectra of CTA1/CTA2 had a minimum around 214 nm and the shoulder was less pronounced than the spectra obtained with the disulfide-linked CTA1/CTA2 heterodimer (Figure 3(c)). The negative ellipticity decreased in a sigmoidal manner with increasing temperature for both reduced and disulfide-bridged samples, resulting in spectra with a single broad minimum around 216 nm at high temperatures (Figure 3(c) and (f)). These data indicate that reduction of the disulfide linkage between CTA1 and CTA2 converts a fraction of α-helical structure to β-sheet structure in either one or both polypeptide chains. Furthermore, heating causes substantial reduction of the α-helical fraction under both reducing and disulfide-bonding conditions. The temperature-dependent changes to secondary structure were characterized with a Tm of 37.5°C in the reduced form (Figure 3(c) and (i)) and a Tm of 43°C in the disulfide-bridged form of CTA1/CTA2 (Figure 3(f) and (i)).
Figure 2.

Reductive separation of CTA1 from CTA2. (a): 1 µg samples of the CTA1/CTA2 heterodimer were exposed to 10 mM β-ME for 1 minute at 4°C or 37°C before loading on a non-reducing SDS-PAGE gel. 1 µg of a CTA1/CTA2 heterodimer that was not exposed to β-ME was also run on the gel. Samples were visualized by Coomassie staining, which does not detect the dissociated 5 kDa CTA2 subunit. Lane 1, disulfide-bridged CTA1/CTA2; lane 2, blank; lane 3, CTA1/CTA2 reduction at 4°C; lane 4, CTA1/CTA2 reduction at 37°C. (b): A 1 µg sample of the CTA1/CTA2 heterodimer was exposed to 10 mM β-ME for 1 minute at 4°C. Size exclusion column chromatography was subsequently run with a Superdex G-75 column on an ÄKTA purifier. A 1 µg CTA1/CTA2 heterodimer sample that was not exposed to β-ME was also run through the column. The unreduced and reduced heterodimers were individually eluted at 4°C in a buffer of 150 mM KCl and 25 mM Tris (pH 7.4) at a rate of 1 ml / minute. Sample elution was detected by absorbance at 280 nm, which after 125 mls of elution could not definitively distinguish between the weak CTA2 signal and the background noise from β-ME.
Figure 3.
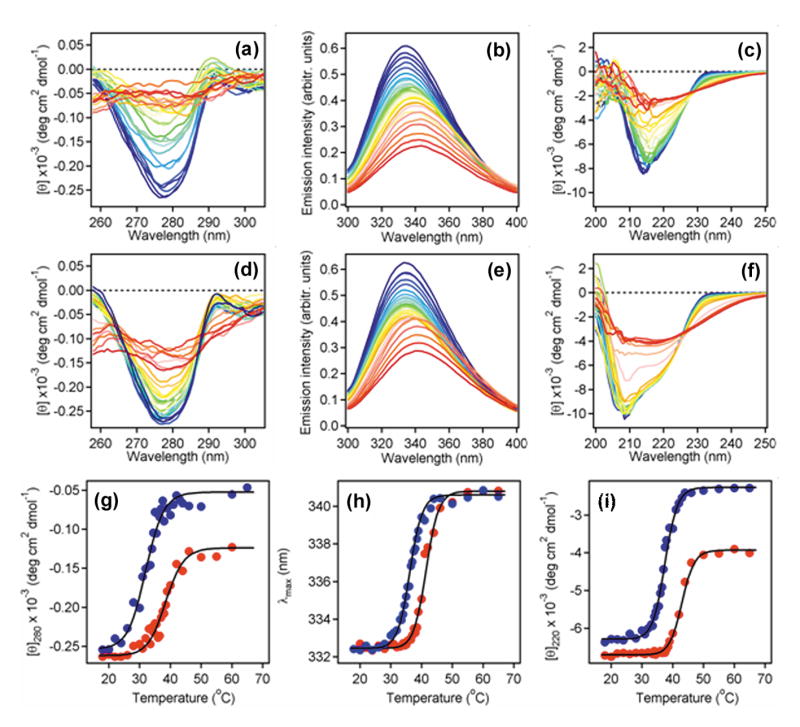
Temperature-induced unfolding of CTA1/CTA2. (a-f): The thermal denaturation of a purified CTA1/CTA2 heterodimer in either reduced (a-c) or disulfide-bridged (d-f) forms was monitored by near-UV CD (a, d), tryptophan fluorescence (b, e), and far-UV CD (c, f). Both CD and fluorescence measurements were conducted near-simultaneously on the same sample after equilibration at each temperature for 4 minutes. Protein concentration was 34 µg /ml in 20 mM Na-phosphate (pH 7.0) containing 150 mM NaCl ± 10 mM β-ME. The change in color from blue to red corresponds to a change in temperature from 18°C to 65°C. (g-i): Thermal unfolding profiles for the CTA1/CTA2 heterodimer in either reduced (blue) or disulfide-bridged (red) forms were derived from the data presented in panels a-f. (g): For near-UV CD analysis, the mean residue molar ellipticities at 280 nm ([θ]280) were plotted as a function of temperature. (h): For fluorescence measurements, the protein sample was excited at 290 nm and the maximum emission wavelengths (λmax) were plotted as a function of temperature. (i): For far-UV CD analysis, the mean residue molar ellipticities at 220 nm ([θ]220) were plotted as a function of temperature.
The CTA1 polypeptide contains all three tryptophan residues that contributed to the emission spectra in Figure 3(b) and Figure 3(e). CTA1 also makes a major contribution to the CD spectra because it is much larger than CTA2 (192 vs. 45 residues, respectively). Finally, nearly identical tertiary and secondary structure Tm values were obtained for a purified, His6-tagged CTA1 construct25 and the reduced CTA1/CTA2 heterodimer (S. Massey, A.H. Pande, S.A. Tatulian, and K. Teter, manuscript in preparation). The shifts in Tm resulting from reduction of the CTA1/CTA2 disulfide bond thus indicate a substantial decrease in the thermal stability of CTA1 upon its covalent dissociation from CTA2.
Although CTA1 is in a partially unfolded state at 37°C, it does not appear to be an intrinsically unstructured protein (IUP). The criteria to define a protein as intrinsically unstructured include low hydrophobic amino acid content, high polar and charged amino acid content, an inability to fold into a globular structure in isolation under physiological conditions, a lack of secondary and tertiary structure, and resistance to heat denaturation.29,30 53% of the amino acids in CTA1 are polar or charged;1 our CD data demonstrated that the isolated CTA1 polypeptide has substantial secondary and tertiary structure that becomes progressively disorganized with increasing temperature (Figure 3); and additional biophysical experiments demonstrated that the reduced CTA1/CTA2 heterodimer could not return to a native-like conformation after sample heating to 65°C (Figure 4). Finally, the disorder prediction program PONDR31,32 does not classify the CTA1 polypeptide as an IUP (see Materials and Methods). CTA1 is thus a thermally unstable protein but is unlikely to be an IUP.
Figure 4.
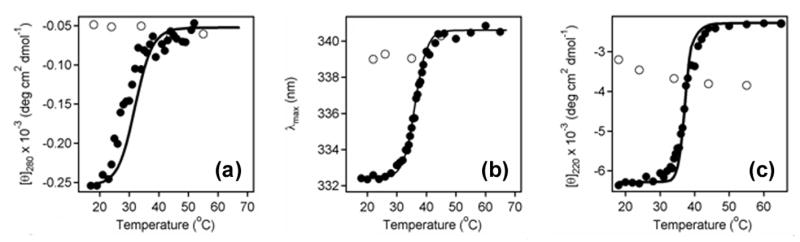
Irreversible denaturation of CTA1. (a-c): Near-UV CD (a), tryptophan fluorescence (b), and far-UV CD (c) were used to monitor the refolding of denatured CTA1. Data were collected for a reduced CTA1/CTA2 heterodimer that was heated from 18°C to 65°C (filled circles) and then cooled from 65°C to 18°C (open circles). Measurements were conducted near-simultaneously on the same sample after equilibration at each temperature for 4 minutes. Protein concentration was 34 µg /ml in 20 mM Na-phosphate (pH 7.0) containing 150 mM NaCl and 10 mM β-ME. The simulated curves for reduced CTA1 from Figures 3(a), 3(b), and 3(c) were used to fit the experimental data in the corresponding panels of this Figure.
CTA1 is in a protease-sensitive conformation at 37°C
To examine the relationship between CTA1 thermal instability and CTA1 proteolysis, we performed a protease sensitivity assay on reduced CTA1/CTA2 heterodimers that had been incubated at 4°C, 25°C, 33°C, 37°C, or 41°C for 1 hour. All samples were then placed on ice and exposed to thermolysin for 1 hour. Thermolysin is a metalloendoprotease that cleaves peptide bonds on the N-terminal side of hydrophobic amino acid residues. Whereas toxin samples initially incubated at ≥ 37°C were degraded by thermolysin, samples pre-incubated at ≤ 33°C were protease-resistant (Figure 5). A disulfide-linked CTA1/CTA2 heterodimer pre-incubated at 37°C was also resistant to proteolysis (Figure 5, lane 7). When correlated to the temperature-dependent folding state of CTA1, these results indicated that temperatures ≥ 37°C destabilize the structure of reduced CTA1 and render the polypeptide susceptible to proteolysis. However, covalent association of CTA1 with CTA2 prevents its degradation by thermolysin, most likely by decreasing the susceptibility of CTA1 to thermal denaturation (Figure 3).
Figure 5.

CTA1 protease sensitivity. Samples of a purified CTA1/CTA2 heterodimer were placed in 20 mM Na-phosphate buffer (pH 7.0) with 10 mM β-ME and incubated for 1 hour at 4°C (lane 1), 25°C (lane 2), 33°C (lane 3), 37°C (lane 4), or 41°C (lane 5). All samples of reduced toxin were then shifted to 4°C and exposed to thermolysin for 1 hour. Thermolysin without toxin was run in lane 6; a thermolysin-treated, disulfide-linked CTA1/CTA2 heterodimer (no β-ME present in the buffer) that was pre-incubated at 37°C was run in lane 7. Samples were visualized by SDS-PAGE and Coomassie staining.
CTA1 is an in vitro substrate for the 20S proteasome
Some unfolded proteins are degraded in an ATP-independent and ubiquitin-independent process by the barrel-shaped 20S proteasome.33,34 This macromolecular complex forms the catalytic core of the 26S proteasome, which is generated by the association of multi-subunit 19S regulatory particles at one or both ends of the 20S proteasome. Most cytosolic proteins are degraded by the 26S proteasome in an ATP-dependent and (usually) ubiquitin-dependent process. However, some proteins are instead degraded by the core 20S proteasome.35,36 ATP and ubiquitin are not required for this proteolytic mechanism, although the addition of ATP does stimulate the turnover of some substrates such as α-casein.36 Proteins degraded by the 20S proteasome must be unfolded in order to fit through the central catalytic pore of the 20S proteasome, and substrate unfolding represents the rate-limiting step in degradation.34,35 Thus, thermal instability in the CTA1 polypeptide could generate a partially unfolded CTA1 conformation that facilitates its ubiquitin-independent degradation by the 20S proteasome.
To detect CTA1 degradation by the 20S proteasome, we incubated the reduced CTA1/CTA2 heterodimer, the disulfide-linked CTA1/CTA2 heterodimer, α-casein, or CTB with the 20S proteasome at 37°C (Figure 6). Samples taken at 0, 3, 9, or 20 hours of incubation were visualized by SDS-PAGE and Coomassie staining. With this assay, a substantial pool of reduced CTA1 was degraded by 10 nM of the 20S proteasome after 3 hours of co-incubation. Almost none of the reduced CTA1 remained after 9 hours of co-incubation with the 20S proteasome. Degradation occurred in the absence of ATP and was not significantly stimulated by the addition of 3 mM ATP (data not shown). CTA1 degradation was faster and more efficient than that observed for α-casein, an established substrate for the 20S proteasome:36 substantial degradation of α-casein was not observed until 9 hours of co-incubation and required 100 nM of the 20S proteasome in the presence of 3 mM ATP. In contrast, no significant degradation of the disulfide-bridged CTA1/CTA2 heterodimer or the CTB pentamer was observed over the 20 hour course of the experiment. Reduction of the CTA1/CTA2 disulfide bond was therefore necessary for CTA1 to undergo partial unfolding at 37°C and become susceptible to ubiquitin-independent processing by the 20S proteasome. This observation again suggested that stabilization of the folded conformation of the CTA1/CTA2 heterodimer by a covalent disulfide bond between the CTA1 and CTA2 polypeptides prevented the denaturation of CTA1 and its degradation by the 20S proteasome.
Figure 6.

In vitro degradation of CTA1 by the 20S proteasome. The reduced CTA1/CTA2 heterodimer (rCTA1), the disulfide-linked CTA1/CTA2 heterodimer (CTA1 + CTA2), α-casein, and the CTB pentamer were incubated at 37°C with the 20S proteasome. Samples taken after 0 hours (lane 1), 3 hours (lane 2), 9 hours (lane 3), or 20 hours (lane 4) of incubation were visualized by SDS-PAGE and Coomassie staining. The CTA1/CTA2 heterodimers were incubated with 10 nM of the 20S proteasome; α-casein and CTB were incubated with 100 nM of the 20S proteasome and 3 mM ATP.
CTA1 is degraded in vivo by a ubiquitin-independent, temperature-sensitive proteasomal mechanism
To assess the role of ubiquitin in the cytosolic stability of CTA1, a plasmid-based transfection system was used to express a recombinant CTA1 construct in the ER of CHO cells (Figure 7). Similar systems have been used to examine the ER-to-cytosol export of CTA1 and other toxin A chains.7,11,21,37-42 Our CTA1 construct contained the N-terminal CTA signal sequence, a cluster of hydrophobic amino acids that co-translationally delivers CTA1 into the ER and is proteolytically removed from CTA1 in the ER lumen.7,9 Previous work has confirmed the efficient ER targeting of this CTA1 construct and has recorded a two hour half-life for the mature CTA1 polypeptide.9,25,43
Figure 7.

Degradation and activity of transfected CTA1. (a-b): Transfected CHO cells co-expressing CTA1 with either an empty vector (+ Vector), wild-type ubiquitin (+ Ub), or dominant negative K48R ubiquitin (+ dn Ub) were radiolabeled and chased for 0-4 hours. Anti-CTA immunoprecipitates from cell extracts generated after each indicated chase interval were visualized (a) and quantified (b) by SDS-PAGE with PhosphorImager analysis. Graphs represent the means ± standard errors of the means of at least four independent experiments. (c): Transfected CHO cells expressing CTA1 were incubated in the absence or presence of 100 µM ALLN and processed as described above. One of four representative experiments is shown. (d): CHO cells transfected with the CTA1 construct were immediately chased for 2, 4, or 8 hours in the absence or presence of 100 µM ALLN. Cell extracts were then generated and assayed for cAMP content. Background-subtracted cAMP levels from five experiments with triplicate samples (means ± standard errors of the means) are shown.
When ubiquitin-dependent proteolysis was disrupted by expression of a dominant negative K48R ubiquitin mutant in CHO cells, there was no effect on the turnover of CTA1 (Figure 7(a) and (b)). Co-expression of K48R ubiquitin with ERAD substrate α1-antitrypsin Z (α1AT-Z)44 extended the 1.7 hour half-life of α1AT-Z to 3 hours, thus confirming the inhibitory effect of K48R ubiquitin on ERAD (data not shown). To demonstrate that CTA1 was degraded by a proteasome-dependent mechanism, we repeated the pulse-chase experiments with cells exposed to 100 µM of the proteasomal inhibitor N-acetyl-Leu-Leu-Norleu-Al (ALLN).45 Proteasomal inhibition led to substantial stabilization of CTA1, and the 2 hour half-life of CTA1 in untreated cells increased to just over 3 hours in ALLN-treated cells (Figure 7(c)). Further extension of the CTA1 half-life was likely confounded by incomplete inhibition of proteasome function (K. Teter and R.K. Holmes, unpublished observations).20,46-47 As expected, treatment with brefeldin A – a fungal drug that interferes with vesicular transport between the Golgi and ER48 – did not inhibit the turnover of CTA1 (data not shown). Furthermore, no secreted pool of CTA1 was detected in these experiments. Mammalian ERAD substrates are efficiently retained in the ER and exported to the cytosol for proteasomal degradation by a mechanism that does not require vesicular trafficking past the ER and proximal Golgi compartments.13 Thus, our results indicated that CTA1 was processed as an ERAD substrate but was degraded by a ubiquitin-independent mechanism.
ALLN treatment might sensitize cultured cells to the action of CTA1, as the intracellular pool of CTA1 is partially stabilized by proteasomal inhibition. A larger pool of cytosolic CTA1 should then correspond to a larger cAMP signal in intoxicated cells. To investigate whether ALLN treatment affected sensitivity to CTA1, we monitored the CTA1-induced elevation of cAMP in cells transfected with a CTA1 expression vector. We found that, at four and eight hours of post-transfection chase, ALLN-treated cells produced substantially larger cAMP signals than cells chased in the absence of ALLN (Figure 7(d)). Proteasomal inhibition therefore extended the half-life of CTA1 and had a corresponding stimulatory effect on intoxication by transfected CTA1.
To further examine the role of ubiquitin in CTA1 degradation, we monitored the turnover of transfected CTA1 in mutant ts20 cells (Table 1). The ts20 cell line expresses a heat-labile E1 ubiquitin activating enzyme that is functional at 33°C but inoperative at 41°C.49 Yet, for both the ts20 cell line and its parental E36 cell line, the degradation of CTA1 was 3-fold faster at the restrictive temperature of 41°C than at the permissive temperature of 33°C. Inefficient degradation of CTA1 at 33°C was not due to an inhibitory effect on CTA1 export from the ER to the cytosol because the same temperature-dependent effects were observed for the turnover of a CTA1 construct (ΔssCTA1) that lacked the CTA signal sequence and was therefore expressed directly in the cytosol.43 The attenuated degradation of ERAD substrate α1AT-Z in ts20 cells incubated at 41°C (in comparison to E36 cells incubated at 41°C) confirmed that ubiquitin-dependent processing events were inhibited at 41°C in the ts20 cells (Table I). Thus, the turnover of CTA1 was temperature-sensitive but ubiquitin-independent.
Table 1.
CTA1 degradation in the absence of a functional E1 ubiquitin activating enzyme.
| Cell type | t1/2 CTA1 | t1/2 ΔssCTA1 | t1/2 α1AT-Z | |||
|---|---|---|---|---|---|---|
| 33°C | 41°C | 33°C | 41°C | 33°C | 41°C | |
| ts20 | 5.2 hr | 1.7 hr | 4.6 hr | 1.5 hr | 5.0 hr | 4.4 hr |
| E36 | 4.6 hr | 1.4 hr | 4.0 hr | 1.4 hr | 5.2 hr | 1.9 hr |
| CHO | 3.6 hr | 1.0 hr | 3.7 hr | 0.9 hr | 4.0 hr | 1.6 hr |
ts20, E36, and CHO cells were transfected with plasmid expression vectors encoding the indicated constructs. The half-lives of CTA1, ΔssCTA1, and α1AT-Z at 33°C or 41°C were calculated from at least 3 pulse-chase experiments with 0, 1, 2, 4, and 6 hr chase points.
Temperature-sensitive degradation of CTA1 was also observed in transfected CHO cells incubated at 33°C or 41°C (Table 1). Furthermore, the combined data from Table 1 and Figure 7 provided a clear correlation between temperature and the rate of CTA1 degradation: in CHO cells, CTA1 had a half-life of 3.6 hours at 33°C, a half-life of 2 hours at 37°C, and 1.0 hour half-life at 41°C.
CTA1-ARF6 interactions
The isolated CTA1 polypeptide would likely remain in a partially unfolded state after passage into the cytosol. This would limit its in vivo activity and render it susceptible to ubiquitin-independent proteasomal degradation. Since CT is highly toxic and CTA1 exhibits a relatively slow turnover rate, components of the host cell may interact with CTA1 to stabilize the toxin and prevent its degradation by the proteasome. This prediction was tested by performing the protease sensitivity and 20S proteasome assays on toxin samples co-incubated with ARF6, a eukaryotic low molecular mass GTP-binding protein that greatly enhances the in vitro enzymatic activity of CTA1 (Figure 8).25,50-51 We found that ARF6-GTP inhibited the shift of reduced CTA1 to a protease-sensitive conformation at 37°C (Figure 8(a)). The active, GTP-bound form of ARF6 was required for CTA1 stabilization. Incubation with the inactive form of ARF6 actually promoted some CTA1 proteolysis at a lower pre-incubation temperature (33°C) than was observed under control conditions. ARF6 itself was nicked by thermolysin when GTP was added to the reaction mixture; the proteolytic fragment seen in the CTA1 + ARF6-GTP sample was also seen in a control reaction which contained ARF6-GTP without CTA1 (data not shown). This was consistent with the known conformational shift that occurs in low molecular mass GTP-binding proteins upon binding to GTP.52 Co-incubation of CTA1 with GTP in the absence of ARF6 did not affect the pattern of CTA1 protease sensitivity. The specific interaction between CTA1 and ARF6-GTP thus provided a degree of conformational stability to CTA1 that prevented its shift to a protease-sensitive state at the physiological temperature of 37°C.
Figure 8.

Effect of ARF6 on CTA1 proteolysis. (a-b): Samples of a purified CTA1/CTA2 heterodimer were placed in 20 mM Na-phosphate buffer (pH 7.0) with 10 mM β-ME. The toxins were also co-incubated with no additions (CTA1), ARF6 (CTA1 + ARF6), or ARF6 and GTP (CTA1 + ARF6/GTP). (a): After a 1 hour incubation at the indicated temperatures, the samples were shifted to 4°C and exposed to thermolysin for 1 hour. CTA1, ARF6, and the ARF6 proteolytic fragment (*ARF6) were then visualized by SDS-PAGE and Coomassie staining. (b): Samples were incubated with 3 mM ATP and 100 nM of the 20S proteasome for 0, 3, 9, or 20 hours of incubation at 37°C. Aliquots taken after these intervals were visualized by SDS-PAGE and Coomassie staining.
Since the 20S proteasome can only act upon unfolded substrates, the stabilization of CTA1 by ARF6-GTP could prevent toxin processing by the 20S proteasome. To test this prediction, we performed our 20S proteasome assay with toxin samples exposed to ARF6 or ARF6-GTP (Figure 8(b)). Co-incubation of the reduced CTA1/CTA2 heterodimer with ARF6-GTP indeed protected CTA1 from degradation by the 20S proteasome. However, co-incubation of reduced CTA1/CTA2 with the inactive form of ARF6 also prevented CTA1 degradation by the 20S proteasome. Control experiments with α-casein as a substrate confirmed that ARF6 did not directly inhibit proteasomal activity (data now shown). A physical interaction between ARF6 and CTA1, irrespective of the structural impact from this association, thus appeared to be sufficient to protect CTA1 from degradation by the 20S proteasome.
The data from Figure 8 indicated that CTA1 could interact with the inactive form of ARF6. However, stimulation of CTA1 activity requires the active, GTP-bound form of an ARF protein.50-51 We therefore employed the technique of surface plasmon resonance (SPR) to confirm the physical association of CTA1 with inactive ARF6 (Figure 9). With this method, a protein of interest is perfused in microliter quantities over a sensor slide that contains the second protein of interest. An interaction between the two proteins increases the mass on the sensor slide, which consequently changes the resonance angle of the reflected light from the slide. A CTA1-His6 sensor slide was prepared as described in Materials and Methods, and control anti-CTA or anti-CTB antibodies were then passed over the slide (Figure 9(a)). The specificity of our detection system was demonstrated by the robust signal produced with the anti-CTA antibody and the lack of signal produced with the anti-CTB antibody. A strong signal was also obtained when ARF6-GTP was perfused over the CTA1-His6 sensor slide, whereas a weaker but detectable signal was obtained when inactive ARF6 was perfused over the sensor slide (Figure 9(b)). A C-terminal CTA1 deletion construct (CTA11-168•His6) also bound strongly to ARF6-GTP and weakly to ARF6 (Figure 9(c)). In contrast, no binding was detected when either ARF6 or ARF6-GTP was added to a sensor slide containing the CT holotoxin (Figure 9(d)). This demonstrated the specificity of the interactions between CTA1 and ARF6 or ARF6-GTP. It was also consistent with a structural study which demonstrated that CTA1 only attains a conformational state suitable for binding to ARF6-GTP after dissociation from the holotoxin.53 The CTA1/ARF6-GTP co-crystal described in this structural study identified the N-terminal A11 subdomain of CTA1 as the binding site for ARF6, which was again consistent with our observed interactions between ARF6 or ARF6-GTP and the C-terminal CTA11-168•His6 deletion construct.
Figure 9.

ARF6 interactions with CTA1. (a-d): Toxin-protein interactions at 37°C were monitored by SPR. High values for the Micro Refractive Index Unit (RIU) denote strong toxin-protein interactions. A decrease in Micro RIU values occurred when the CTA1-interacting protein was removed from the perfusion buffer (indicated by the arrows). (a): CTA1-His6 interactions with anti-CTA or anti-CTB antibodies. (b): CTA1-His6 interactions with ARF6 in the absence or presence of GTP. (c): CTA11-168•His6 interactions with ARF6 in the absence or presence of GTP. (d): Interactions between the CT holotoxin and anti-CTA antibodies, anti-CTB antibodies, ARF6, or ARF6 in the presence of GTP. The dramatic signal obtained with the anti-CTB antibody was likely due to the pentameric structure of the CTB subunit and the corresponding increase in antibody binding sites compared to the CTA subunit.
The SPR data presented in Figure 9 were generated with 1 µM ARF6 in the absence or presence of 1 µM GTP. To calculate equilibrium dissociation constants for CTA1/ARF6 interactions, additional experiments were performed with six concentrations of ARF6 in the absence or presence of equimolar amounts of GTP (Supplemental Figure 1). SPR experiments performed at 25°C or 33°C also used six different analyte concentrations to determine CTA1/ARF6 equilibrium dissociation constants (Table 2). CTA1 and CTA11-168 both exhibited high affinity interactions with ARF6-GTP at 37°C, although in terms of KD values the binding affinity between CTA1 and ARF6-GTP was 3-fold stronger than the binding affinity between CTA11-168 and ARF6-GTP. The data also detected a temperature-dependent association between CTA1 or CTA11-168 and ARF6-GTP. For full-length CTA1, the binding affinity for ARF6-GTP was 4-fold weaker at 33°C than at 37°C and 6-fold weaker at 25°C than at 37°C. For CTA11-168, the binding affinity for ARF6-GTP was 2-fold weaker at 33°C than at 37°C and 4-fold weaker at 25°C than at 37°C. Neither CTA1 nor CTA11-168 bound to ARF6-GTP at 10°C (data not shown). Temperature-dependent interactions between CTA1 or CTA11-168 and inactive ARF6 were also detected, but the binding affinities were much weaker than those calculated for toxin interactions with ARF6-GTP. These data suggest that only CTA1 or CTA11-168 interactions with ARF6-GTP are likely to be physiologically relevant, and they support a putative role for ARF6-GTP in stabilizing cytosolic CTA1 and protecting it from proteasomal degradation in vivo.
Table 2.
Binding affinities between CTA1 and ARF6
| Binding condition | Temperature | ka (1 / Ms) | kd (1 / s) | KD (nM) |
|---|---|---|---|---|
| CTA1-His6 + ARF6/GTP | 37°C | 1.32 × 10⁶ | 0.062 | 47 |
| 33°C | 1.23 × 10⁵ | 0.024 | 195 | |
| 25°C | 1.17 × 10⁵ | 0.033 | 282 | |
| CTA1-His6 + ARF6 | 37°C | 9.81 × 10⁴ | 0.051 | 519 |
| 33°C | 8.49 × 10⁴ | 0.069 | 812 | |
| 25°C | 8.21 × 10⁴ | 0.086 | 1048 | |
| CTA11-168•His6 + ARF6/GTP | 37°C | 4.23 × 10⁵ | 0.057 | 135 |
| 33°C | 2.83 × 10⁵ | 0.065 | 230 | |
| 25°C | 1.26 × 10⁵ | 0.061 | 484 | |
| CTA11-168•His6 + ARF6 | 37°C | 8.66 × 10⁴ | 0.028 | 323 |
| 33°C | 8.86 × 10⁴ | 0.034 | 384 | |
| 25°C | 7.65 × 10⁴ | 0.086 | 1124 |
SPR experiments were performed with the listed binding conditions and temperatures. Each condition was performed with six different analyte concentrations: 4, 2, 1, 0.5, 0.25, and 0.125 µM of ARF6 in the absence or presence of equimolar amounts of GTP. Each analyte concentration was used in three independent experiments (i.e., with three different CTA1-His6 or CTA11-168•His6 sensor slides). Standard curves fitted to these data were used to calculate on rates (ka), off rates (kd), and equilibrium dissociation constants (KD).
Discussion
CTA1 thermal instability and host-toxin interactions
Our biophysical measurements demonstrated that reduced CTA1 has a disordered tertiary structure and a partially perturbed secondary structure at 37°C. Furthermore, the conformation of CTA1 is stabilized by its covalent association with CTA2. The latter observation was consistent with the work of Surewicz et al., who noted that, in the CTA1/CTA2 heterodimer, a significant loss of CTA1 secondary structure occurs between 40°C and 46°C.23 The arrangement of the CT holotoxin provides an additional degree of structural stability for CTA1, as temperatures of at least 51°C are required to induce CTA1 unfolding when it is present in the holotoxin.22 Thus, CTA1 is held in a relatively stable conformation until reduction of the CTA1/CTA2 disulfide bond in the ER allows chaperone-dependent dissociation of CTA1 from the rest of the toxin.3,5-6 The subsequent partially unfolded state of CTA1 at 37°C could then help trigger its ERAD-mediated export into the cytosol.
Translocated CTA1 is unlikely to spontaneously refold in the cytosol. However, an interaction with eukaryotic factors could allow the cytosolic pool of CTA1 to attain an active conformation. The six mammalian ARF proteins, phospholipids, or other cytosolic factors could possibly act in this fashion to stimulate CTA1 folding and expression of its catalytic activity. The reduced CTA1/CTA2 heterodimer is more active in vitro at 25°C than at 37°C,54 which is consistent with the heat-labile nature of CTA1. However, the reduced CTA1/CTA2 heterodimer is more active in vitro at 37°C than at 25°C when ARFs and phospholipids are present.54 In vivo modulation of the CTA1 folding state by host factors could therefore allow CTA1 to elicit a significant cellular response from intoxicated cells despite its initially unfolded conformation in the cytosol. Preliminary experiments indeed suggest that ARF-GTP can stabilize the heat-labile conformation of the dissociated CTA1 polypeptide; ongoing structural studies will provide additional data to support or discount the model for ARF-assisted refolding of cytosolic CTA1.
Ubiquitin-independent degradation of CTA1
The heat-labile state of reduced CTA1 leaves it susceptible to ubiquitin-independent degradation by the 20S proteasome in vitro and most likely in vivo as well. This stands in contrast to the usual route of ubiquitin-dependent degradation by the 26S proteasome. Substrate unfolding is the rate-limiting step for degradation by the 20S proteasome,34-35 which could explain the in vivo effects of temperature on CTA1 degradation: elevated temperatures increase the extent of CTA1 unfolding and thereby increase the rate of CTA1 degradation. The inability of ARF6-GTP to prevent the 41°C shift of CTA1 to a protease sensitive conformation could also contribute to the accelerated turnover of CTA1 at this temperature.
Proteasomal inhibition generates a 3-fold increase in cellular sensitivity to ricin, another AB-type ER-translocating toxin.19,55 With our transfection-cAMP assay, we found that proteasomal inhibition also had a stimulatory effect on the onset of intoxication with transfected CTA1. However, proteasomal inhibition did not affect the onset of intoxication with exogenously applied CT when intoxication was detected by chloride efflux from polarized epithelial monolayers.16 These apparently incongruous results suggest that the exogenously applied CT elicited a submaximal cAMP response from intoxicated cells, but this submaximal level of intracellular cAMP was still sufficient to generate the maximal level of chloride secretion. Thus, according to our interpretation of the available data, proteasomal inhibition increases the cAMP response of intoxicated cells to certain doses of CT without further stimulating chloride efflux from those same cells.
Under normal conditions, the cytosolic degradation of CTA1 is probably not rapid enough to affect the initial stages of CT intoxication. A dearth of ubiquitin attachment sites in the CTA1 polypeptide contributes to the persistence of CTA1 in the cytosol and, consequently, to its in vivo activity.16 Our work suggests that an interaction with ARF6-GTP or other active ARF proteins could further protect cytosolic CTA1 from proteasomal degradation. By this model, an inhibition of CTA1 binding to ARF proteins is predicted to increase the rate of CTA1 degradation. Each of the six mammalian ARF proteins can interact with CTA1,50 so testing this prediction with RNA interference or similar techniques is not feasible. Unfortunately, the tools necessary to examine CTA1 turnover in cells with disrupted CTA1/ARF interactions are not currently available.
In previous work we reported that CTA11-168/9 deletion constructs lacking most of the C-terminal A13 subdomain did not interact physically (as determined by a two-hybrid assay) or functionally (as determined by an in vitro ADP-ribosylation assay) with ARF6.25 CTA11-169 exhibited the same in vivo turnover rate as full-length CTA1.25 However, the SPR data presented in this work indicated that CTA11-168 could interact with ARF6-GTP at 37°C and, to a lesser extent, at 33°C or 25°C. As such, the in vivo turnover of CTA11-169 did not represent a condition in which toxin-ARF interactions were blocked. The two-hybrid assay which detected a minimal interaction between CTA11-168 and ARF6 was conducted at 30°C, so the weaker protein-protein interaction at this temperature was apparently below the threshold for a robust response from the two-hybird assay. If the two-hybrid assay had been performed at 37°C, it is possible that an interaction between CTA11-168 and ARF6 would have been more readily detected. These considerations underscore the impact of CTA1 thermal instability on host-toxin interactions. The lack of functional interaction between CTA11-168 and ARF6 indicates that the C-terminal A13 subdomain, although unnecessary for binding to ARF6, is required for the ARF-induced conformational change that stimulates CTA1 activity. This interpretation is consistent with published reports on the physical interactions between CTA1 and ARF6.53,56
Thermal instability: a common theme for toxin-ERAD interactions
In addition to CT, at least two other ER-translocating toxins (PT and ricin) contain heat-labile A chains that are stable when incorporated into their respective holotoxins.17-18,22,57-58 Each toxin A chain is also stabilized by an association with its cytosolic target or other host factor.17-18 Thus, A chain instability is only apparent after separation from the holotoxin in the ER and before interaction with a specific component of the host cell cytosol. In this interval the isolated A chain can be identified as a misfolded protein for ERAD-mediated export to the cytosol. It may also be susceptible to ubiquitin-independent degradation by the core 20S proteasome.18-19,21 This general process has now been observed for three distinct ER-translocating toxins. As such, A chain instability may represent a common strategy for triggering ERAD-mediated toxin translocation.
Materials and Methods
Materials
Chemicals, thermolysin, α-casein, ganglioside GM1, and the CTB pentamer were purchased from Sigma-Aldrich (St. Louis, MO). Cell culture reagents, Lipofectamine, and the pcDNA3.1 expression vector were from Invitrogen (Carlsbad, CA). ATP and the purified CTA1/CTA2 heterodimer were purchased from Calbiochem (La Jolla, CA). The purified 20S proteasome was from Boston Biochem (Cambridge, MA). [35S]methionine was purchased from Perkin-Elmer (Boston, MA). ARF6, CTA1-His6, and CTA11-168•His6 were purified as previously described.25 Dr. A.A. McCracken (University of Nevada, Reno) provided the pSV7/α1AT-Z plasmid;59 Dr. D.A. Gray (University of Ottawa, Ontario) provided the plasmids encoding wild-type (pDG268) or K48R mutant (pDG279) ubiquitin;60 and Dr. J.R. Riordan (Mayo Clinic, Scottsdale) provided the ts20 and E36 Chinese hamster lung fibroblast cell lines.49
Computer modeling of protein stability
The protein instability data obtained from ExPASy-SWISS-PROT ProtParam (http://ca.expasy.org/sprot/) indicated that the CTA1 subunit has an instability index of 41.6, the CTA2 subunit has an instability index of 55.1, and the CTB monomer has an instability index of 39.3. An instability index value greater than 40 is indicative of protein instability;26 CTA1 and CTA2 are therefore classified as unstable, while the CTB monomer is classified as stable.
The estimation of CTA1 disorder was conducted with the PONDR program from Molecular Kinetics, Inc. (Indianapolis, IN).31,32 Whether CTA1 should be classified as an IUP was examined using the criteria outlined by Galea et al.30 An average PONDR score of 0.2990 was obtained for CTA1 by VL-XT statistical analysis. In addition, the boundary hydropathy value of 0.4226 (mean net charge: 0.0260; hydropathy: 0.4214) calculated for CTA1 by charge-hydropathy analysis was just to the right-hand side (i.e., ordered protein side) of the linear boundary between disordered and ordered proteins. Both results indicated that CTA1 is not an IUP.
Structural studies
The temperature-dependent unfolding of CTA1 was studied using a J-810 spectrofluoropolarimeter (Jasco Corp., Tokyo, Japan), which is a spectropolarimeter equipped with a fluorescence photomultiplier mounted at a right angle to the incident light beam and a Jasco PFD-425S Peltier temperature controller. This arrangement allows nearly simultaneous measurements of protein fluorescence and CD spectra on the same sample at varying temperatures. Experiments were carried out with a 4-mm path-length rectangular quartz cuvette Protein concentration was 34 µg /ml in 0.2 ml of 20 mM Na-phosphate (pH 7.0) containing 150 mM NaCl ± 10 mM β-ME. Thermal unfolding was carried out in the temperature range of 18-65°C, and samples were allowed to equilibrate for 4 minutes at each temperature before measurements. Readings were taken at 2°C increments from 18-30°C, 1°C increments from 30-33°C, 0.5°C increments from 33-39°C, 1°C increments from 39-46°C, and at 50°C, 55°C, 60°C, and 65°C. For fluorescence spectra, CTA1 tryptophan residues were excited at 290 nm and the fluorescence emission was measured between 300 and 400 nm. The excitation and emission slits were set to 1 nm and 10 nm, respectively. CD spectra were recorded from 195 to 320 nm, which covers both near-UV and far-UV range. In all cases the spectral resolution was 1 nm. CD spectra were averaged from 5 scans. The observed ellipticity (θobs) was converted to mean residue molar ellipticity, [θ], in units of degrees×cm2×dmol-1 using [θ] = θobs/cnresl, where θobs is the measured ellipticity in millidegrees, c is the molar concentration of the protein, nres is the number of amino acid residues in the protein, and l is the optical path-length in millimeters.
The temperature-dependent protein unfolding data were analyzed as described by Lavigne et. al.61 using the following equation:
where X is the measured temperature-dependent variable, such as the ellipticity or the peak fluorescence emission wavelength, fL is the fraction of amino acids representing the native conformation at low temperature, XL and XH are limiting values of X at low and high temperatures, respectively. The parameter, fL, is given by
where the free energy of unfolding (ΔG) is given by
Here Tm is the transition temperature, ΔH is the apparent enthalpy of unfolding and ΔC is the heat capacity of unfolding. The parameters ΔC = 0.39 kcal mol-1 K-1 and ΔH = 25 kcal mol-1 were used to obtain the best fit between experimental and simulated curves, except in the case of near-UV CD data where ΔH = 55 kcal mol-1 was used.
Protease sensitivity assay
12 µg of the purified CTA1/CTA2 heterodimer was added to 0.3 ml of 20 mM Na-phosphate buffer (pH 7.0) containing 10 mM β-ME. 1 mM GTP and/or equimolar concentrations of ARF6 were mixed with the CTA1/CTA2 heterodimer as indicated. 0.05 ml toxin aliquots were transferred to fresh microcentrifuge tubes and incubated at 4°C, 25°C, 33°C, 37°C, or 41°C for 1 hour. All samples were then shifted to 4°C for 10 minutes. Thermolysin (prepared as a 10x stock in 50 mM CaCl2 and 100 mM Hepes pH 8.0) was subsequently added to a final concentration of 0.04 mg / ml for a 1 hour 4°C incubation. Digests were stopped with the addition of 10 mM EDTA (final concentration), and the toxin samples were visualized by SDS-PAGE with Coomassie staining.
Cell culture, transfection, and transfection-cAMP assay
CHO cells were grown in Ham's F-12 media supplemented with 10% fetal bovine serum. Growth conditions were at 37°C and 5% CO2 in a humidified incubator. The ts20 and E36 cells were grown under humidified conditions at 33°C and 5% CO2 in α-MEM containng 10% fetal bovine serum. Cells were seeded in 6-well plates at 75% confluency the day before transfection. 1 µg of an expression plasmid was mixed with 5 µl Lipofectamine for 20 minutes at room temperature, and the mixture was then added to cells for a 3 hour incubation at 37°C (CHO) or 33°C (E36 and ts20). CHO cells were transfected and grown at 33°C for the experiments presented in Table 1. Cells were processed for the transfection-cAMP assay at 4 hours post-transfection and were used for metabolic labeling experiments at 16-24 hours post-transfection. The transfection-cAMP assay was performed as previously described.43
Metabolic labeling and immunoprecipitation
CTA1 and α1AT-Z pulse-chase experiments have been previously described.8 In brief, transfected cells were radiolabeled for 1 hour and chased in serum-free media containing 0.5 mg methionine / ml. Cell extracts generated after the indicated chase intervals were subjected to anti-CTA or anti-α1AT immunoprecipitation, and the immunoisolated material was resolved by SDS-PAGE. PhosphorImager analysis (BioRad; Hercules, CA) was used for sample quantification. Results from the chase intervals were expressed as percentages of the values obtained from the corresponding pulse-labeled cells. The data presented in Table 1 were calculated from at least 3 pulse-chase experiments with 0, 1, 2, 4, and 6 hour chase points. Half-lives were calculated by plotting the average results from all experiments on a single graph as explicitly shown in Figure 7(b). A standard deviation of less than 10% was typically calculated for the averaged results of each chase point.
20S proteasome assay
5 µg of substrate was mixed with 10 nM or 100 nM of the purified 20S proteasome in 0.1 ml assay buffer (50 mM Hepes pH 7.5, 10 mM MgCl2, 100 mM KCl, and 0.1 mM CaCl2) at 37°C. These conditions represented a 200,000-fold molar excess of CTA1/CTA2 over the proteasome, a 20,000-fold molar excess of α-casein over the proteasome, and a 10,000-fold molar excess of CTB pentamer over the proteasome. As indicated, 3 mM ATP, 1 mM GTP, 10 mM β-ME, and/or 5 µg of ARF6 (a 1.4-fold molar excess in relation to CTA1/CTA2) were also present in the assay buffer. The presence or absence of 10 mM β-ME did not alter results obtained with CTB or α-casein (data not shown). 1 µg substrate aliquots taken at the stated intervals were visualized by SDS-PAGE with Coomassie staining.
Surface plasmon resonance
Protein-protein interactions were examined with a Reichert (Depew, NY) SR7000 SPR Refractometer. After cleaning the flow cell with 1% Triton X-100 in phosphate-buffered saline (PBS), both the flow cell and gold sensor slide were mounted in the instrument. The flow cell was subsequently washed with PBS for 5 minutes at a flow rate of 5 µl / min. This same flow rate was used for all steps of the protocol. A baseline control reading of PBS buffer alone (pH 7.4) was taken, and purified CTA1-His6 or purified CTA11-168•His6 was then coupled to a gold sensor slide (the Reichert Dithiol Dendritic Tethers slide) that is specifically developed for the adherence of His-tagged proteins. The following steps were taken to coat the sensor slide with CTA1-His6 or CTA11-168•His6: (i) the carboxy groups on the surface of the sensor plate were activated for His6 binding by passing an EDC-NHS mixture through the flow cell and over the gold plate for 5 minutes; (ii) EDC-NHS was removed with a 5 minute PBS wash; (iii) the activated surface was exposed to immobilization buffer (10 mM sodium acetate pH 4.1) for 2 minutes; (iv) His6-tagged toxin was added for 10 minutes at a concentration of 100 µg / ml; and (v) the remaining reactive groups on the sensor surface were deactivated using a 3 minute wash with 1 M ethanolamine. After another 5 minute wash with PBS, the putative CTA1-interacting protein (i.e., control antibodies, purified ARF6, or purified ARF6 in the presence of equimolar GTP) was added for 10 minutes. Control antibodies were added in PBS at a concentration of 100 µg / ml; ARF6 was added in PBS at concentrations of 4, 2, 1, 0.5, 0.25, or 0.125 µM. A real-time change in the refractive index of the CTA1-coated sensor plate upon ligand addition indicated a physical interaction between CTA1 and the added protein. Subsequent addition of PBS buffer without the CTA1-interacting protein present resulted in the release of the bound protein and generated another shift in refractive index. Reichert Labview software was used for data collection. BioLogic (Campbell, Australia) Scrubber 2 software was used for curve fitting and data analysis.
For SPR experiments using the CT holotoxin, a gold plate sensor was coated with the GM1 ganglioside receptor of CT by a procedure described for the coating of ELISA plates.62 CT was then bound to the GM1-coated sensor by perfusing 1 ml of CT (10 µg / ml) over the slide for 15 min at a flow rate of 5 µl / min. Additional steps were performed as described above for the CTA1-His6 and CTA11-168•His6 sensor slides.
Supplementary Material
Acknowledgments
We thank D. Sentz for purifying ARF6; S.E. Geden for purifying CTA1-His6 and CTA11-168•His6; W. Self and M.G. Jobling for helpful discussions; A.A. McCracken for the pSV7/α1AT-Z plasmid; D.A. Gray for the wild-type and K48R mutant ubiquitin constructs; and J.R. Riordan for the ts20 and E36 cell lines. This work was supported by NIH grants to R.K. Holmes (R01 AI31940) and K. Teter (F32 AI10394, K22 AI054568, and R01 AI073783).
Access to PONDR® was provided by Molecular Kinetics (6201 La Pas Trail - Ste 160, Indianapolis, IN 46268; 317-280-8737; E-mail: main@molecularkinetics.com). VL-XT is copyright©1999 by the WSU Research Foundation, all rights reserved. PONDR® is copyright©2004 by Molecular Kinetics, all rights reserved.
Abbreviations used
- ALLN
N-acetyl-Leu-Leu-Norleu-Al
- ARF
ADP-ribosylation factor
- α1AT-Z
α1-antitrypsin Z
- CT
cholera toxin
- CD
circular dichroism
- ER
endoplasmic reticulum
- ERAD
endoplasmic reticulum-associated degradation
- IUP
intrinsically unstructured protein
- β-ME
β-mercaptoethanol
- PBS
phosphate-buffered saline
- PT
pertussis toxin
- SPR
surface plasmon resonance
- Tm
transition temperature
Footnotes
Publisher's Disclaimer: This is a PDF file of an unedited manuscript that has been accepted for publication. As a service to our customers we are providing this early version of the manuscript. The manuscript will undergo copyediting, typesetting, and review of the resulting proof before it is published in its final citable form. Please note that during the production process errors may be discovered which could affect the content, and all legal disclaimers that apply to the journal pertain.
References
- 1.Spangler BD. Structure and function of cholera toxin and the related Escherichia coli heat-labile enterotoxin. Microbiol Rev. 1992;56:622–647. doi: 10.1128/mr.56.4.622-647.1992. [DOI] [PMC free article] [PubMed] [Google Scholar]
- 2.De Haan L, Hirst TR. Cholera toxin: a paradigm for multi-functional engagement of cellular mechanisms (Review) Mol Membr Biol. 2004;21:77–92. doi: 10.1080/09687680410001663267. [DOI] [PubMed] [Google Scholar]
- 3.Majoul I, Ferrari D, Soling HD. Reduction of protein disulfide bonds in an oxidizing environment. The disulfide bridge of cholera toxin A-subunit is reduced in the endoplasmic reticulum. FEBS Lett. 1997;401:104–108. doi: 10.1016/s0014-5793(96)01447-0. [DOI] [PubMed] [Google Scholar]
- 4.Lencer WI, Tsai B. The intracellular voyage of cholera toxin: going retro. Trends Biochem Sci. 2003;28:639–645. doi: 10.1016/j.tibs.2003.10.002. [DOI] [PubMed] [Google Scholar]
- 5.Orlandi PA. Protein-disulfide isomerase-mediated reduction of the A subunit of cholera toxin in a human intestinal cell line. J Biol Chem. 1997;272:4591–4599. [PubMed] [Google Scholar]
- 6.Tsai B, Rodighiero C, Lencer WI, Rapoport TA. Protein disulfide isomerase acts as a redox-dependent chaperone to unfold cholera toxin. Cell. 2001;104:937–948. doi: 10.1016/s0092-8674(01)00289-6. [DOI] [PubMed] [Google Scholar]
- 7.Schmitz A, Herrgen H, Winkeler A, Herzog V. Cholera toxin is exported from microsomes by the Sec61p complex. J Cell Biol. 2000;148:1203–1212. doi: 10.1083/jcb.148.6.1203. [DOI] [PMC free article] [PubMed] [Google Scholar]
- 8.Teter K, Holmes RK. Inhibition of endoplasmic reticulum-associated degradation in CHO cells resistant to cholera toxin, Pseudomonas aeruginosa exotoxin A, and ricin. Infect Immun. 2002;70:6172–6179. doi: 10.1128/IAI.70.11.6172-6179.2002. [DOI] [PMC free article] [PubMed] [Google Scholar]
- 9.Teter K, Allyn RL, Jobling MG, Holmes RK. Transfer of the cholera toxin A1 polypeptide from the endoplasmic reticulum to the cytosol is a rapid process facilitated by the endoplasmic reticulum-associated degradation pathway. Infect Immun. 2002;70:6166–6171. doi: 10.1128/IAI.70.11.6166-6171.2002. [DOI] [PMC free article] [PubMed] [Google Scholar]
- 10.Teter K, Jobling MG, Holmes RK. A class of mutant CHO cells resistant to cholera toxin rapidly degrades the catalytic polypeptide of cholera toxin and exhibits increased endoplasmic reticulum-associated degradation. Traffic. 2003;4:232–242. doi: 10.1034/j.1600-0854.2003.00070.x. [DOI] [PubMed] [Google Scholar]
- 11.Winkeler A, Godderz D, Herzog V, Schmitz A. BiP-dependent export of cholera toxin from endoplasmic reticulum-derived microsomes. FEBS Lett. 2003;554:439–442. doi: 10.1016/s0014-5793(03)01217-1. [DOI] [PubMed] [Google Scholar]
- 12.Lord JM, Roberts LM, Lencer WI. Entry of protein toxins into mammalian cells by crossing the endoplasmic reticulum membrane: co-opting basic mechanisms of endoplasmic reticulum-associated degradation. Curr Top Microbiol Immunol. 2005;300:149–168. doi: 10.1007/3-540-28007-3_7. [DOI] [PubMed] [Google Scholar]
- 13.McCracken AA, Brodsky JL. Evolving questions and paradigm shifts in endoplasmic-reticulum-associated degradation (ERAD) Bioessays. 2003;25:868–877. doi: 10.1002/bies.10320. [DOI] [PubMed] [Google Scholar]
- 14.Hazes B, Read RJ. Accumulating evidence suggests that several AB-toxins subvert the endoplasmic reticulum-associated protein degradation pathway to enter target cells. Biochemistry. 1997;36:11051–11054. doi: 10.1021/bi971383p. [DOI] [PubMed] [Google Scholar]
- 15.Lord JM, Roberts LM. Toxin entry: retrograde transport through the secretory pathway. J Cell Biol. 1998;140:733–736. doi: 10.1083/jcb.140.4.733. [DOI] [PMC free article] [PubMed] [Google Scholar]
- 16.Rodighiero C, Tsai B, Rapoport TA, Lencer WI. Role of ubiquitination in retro-translocation of cholera toxin and escape of cytosolic degradation. EMBO Rep. 2002;3:1222–1227. doi: 10.1093/embo-reports/kvf239. [DOI] [PMC free article] [PubMed] [Google Scholar]
- 17.Argent RH, Parrott AM, Day PJ, Roberts LM, Stockley PG, Lord JM, Radford SE. Ribosome-mediated folding of partially unfolded ricin A-chain. J Biol Chem. 2000;275:9263–9269. doi: 10.1074/jbc.275.13.9263. [DOI] [PubMed] [Google Scholar]
- 18.Pande AH, Moe D, Jamnadas M, Tatulian SA, Teter K. The pertussis toxin S1 subunit is a thermally unstable protein susceptible to degradation by the 20S proteasome. Biochemistry. 2006;45:13734–13740. doi: 10.1021/bi061175+. [DOI] [PMC free article] [PubMed] [Google Scholar]
- 19.Deeks ED, Cook JP, Day PJ, Smith DC, Roberts LM, Lord JM. The low lysine content of ricin A chain reduces the risk of proteolytic degradation after translocation from the endoplasmic reticulum to the cytosol. Biochemistry. 2002;41:3405–3413. doi: 10.1021/bi011580v. [DOI] [PubMed] [Google Scholar]
- 20.Worthington ZE, Carbonetti NH. Evading the proteasome: absence of lysine residues contributes to pertussis toxin activity by evasion of proteasome degradation. Infect Immun. 2007;75:2946–2953. doi: 10.1128/IAI.02011-06. [DOI] [PMC free article] [PubMed] [Google Scholar]
- 21.Simpson JC, Roberts LM, Romisch K, Davey J, Wolf DH, Lord JM. Ricin A chain utilises the endoplasmic reticulum-associated protein degradation pathway to enter the cytosol of yeast. FEBS Lett. 1999;459:80–84. doi: 10.1016/s0014-5793(99)01222-3. [DOI] [PubMed] [Google Scholar]
- 22.Goins B, Freire E. Thermal stability and intersubunit interactions of cholera toxin in solution and in association with its cell-surface receptor ganglioside GM1. Biochemistry. 1988;27:2046–2052. doi: 10.1021/bi00406a035. [DOI] [PubMed] [Google Scholar]
- 23.Surewicz WK, Leddy JJ, Mantsch HH. Structure, stability, and receptor interaction of cholera toxin as studied by Fourier-transform infrared spectroscopy. Biochemistry. 1990;29:8106–8111. doi: 10.1021/bi00487a017. [DOI] [PubMed] [Google Scholar]
- 24.Zhang RG, Scott DL, Westbrook ML, Nance S, Spangler BD, Shipley GG, Westbrook EM. The three-dimensional crystal structure of cholera toxin. J Mol Biol. 1995;251:563–573. doi: 10.1006/jmbi.1995.0456. [DOI] [PubMed] [Google Scholar]
- 25.Teter K, Jobling MG, Sentz D, Holmes RK. The cholera toxin A13 subdomain is essential for interaction with ADP-ribosylation factor 6 and full toxic activity but is not required for translocation from the endoplasmic reticulum to the cytosol. Infect Immun. 2006;74:2259–2267. doi: 10.1128/IAI.74.4.2259-2267.2006. [DOI] [PMC free article] [PubMed] [Google Scholar]
- 26.Gasteiger ECH, Gattiker A, Duvaud S, Wilkins MR, Appel RD, Bairoch A. Protein identification and analysis tools on the ExPASy server. In: Walker JM, editor. The Proteomics Protocols Handbook. Humana Press; Totowa: 2005. pp. 571–607. [Google Scholar]
- 27.Woody RW, Dunker AK. Aromatic and cysteine side-chain circular dichroism in proteins. In: Fasman GD, editor. Circular Dichroism and the Conformational Analysis of Biomolecules. Plenum Press; New York and London: 1996. pp. 109–157. [Google Scholar]
- 28.Cantor CR, Schimmel PR. Biophysical Chemistry Part II: Techniques for the study of biological structure and function. W. H. Freeman and Co.; New York: 1980. Other optical techniques; pp. 436–448. [Google Scholar]
- 29.Bowman P, Galea CA, Lacy E, Kriwacki RW. Thermodynamic characterization of interactions between p27(Kip1) and activated and non-activated Cdk2: intrinsically unstructured proteins as thermodynamic tethers. Biochim Biophys Acta. 2006;1764:182–189. doi: 10.1016/j.bbapap.2005.12.016. [DOI] [PubMed] [Google Scholar]
- 30.Galea CA, Pagala VR, Obenauer JC, Park CG, Slaughter CA, Kriwacki RW. Proteomic studies of the intrinsically unstructured mammalian proteome. J Proteome Res. 2006;5:2839–2848. doi: 10.1021/pr060328c. [DOI] [PubMed] [Google Scholar]
- 31.Romero P, Obradovic Z, Li X, Garner EC, Brown CJ, Dunker AK. Sequence complexity of disordered protein. Proteins. 2001;42:38–48. doi: 10.1002/1097-0134(20010101)42:1<38::aid-prot50>3.0.co;2-3. [DOI] [PubMed] [Google Scholar]
- 32.Dunker AK, Brown CJ, Lawson JD, Iakoucheva LM, Obradovic Z. Intrinsic disorder and protein function. Biochemistry. 2002;41:6573–6582. doi: 10.1021/bi012159+. [DOI] [PubMed] [Google Scholar]
- 33.Orlowski M, Wilk S. Ubiquitin-independent proteolytic functions of the proteasome. Arch Biochem Biophys. 2003;415:1–5. doi: 10.1016/s0003-9861(03)00197-8. [DOI] [PubMed] [Google Scholar]
- 34.Shringarpure R, Grune T, Davies KJ. Protein oxidation and 20S proteasome-dependent proteolysis in mammalian cells. Cell Mol Life Sci. 2001;58:1442–1450. doi: 10.1007/PL00000787. [DOI] [PMC free article] [PubMed] [Google Scholar]
- 35.Ferrington DA, Sun H, Murray KK, Costa J, Williams TD, Bigelow DJ, Squier TC. Selective degradation of oxidized calmodulin by the 20 S proteasome. J Biol Chem. 2001;276:937–943. doi: 10.1074/jbc.M005356200. [DOI] [PubMed] [Google Scholar]
- 36.Tanaka K, Waxman L, Goldberg AL. ATP serves two distinct roles in protein degradation in reticulocytes, one requiring and one independent of ubiquitin. J Cell Biol. 1983;96:1580–1585. doi: 10.1083/jcb.96.6.1580. [DOI] [PMC free article] [PubMed] [Google Scholar]
- 37.Castro MG, McNamara U, Carbonetti NH. Expression, activity and cytotoxicity of pertussis toxin S1 subunit in transfected mammalian cells. Cell Microbiol. 2001;3:45–54. doi: 10.1046/j.1462-5822.2001.00092.x. [DOI] [PubMed] [Google Scholar]
- 38.Di Cola A, Frigerio L, Lord JM, Ceriotti A, Roberts LM. Ricin A chain without its partner B chain is degraded after retrotranslocation from the endoplasmic reticulum to the cytosol in plant cells. Proc Natl Acad Sci USA. 2001;98:14726–14731. doi: 10.1073/pnas.251386098. [DOI] [PMC free article] [PubMed] [Google Scholar]
- 39.Di Cola A, Frigerio L, Lord JM, Roberts LM, Ceriotti A. Endoplasmic reticulum-associated degradation of ricin A chain has unique and plant-specific features. Plant Physiology. 2005;137:287–296. doi: 10.1104/pp.104.055434. [DOI] [PMC free article] [PubMed] [Google Scholar]
- 40.Veithen A, Raze D, Locht C. Intracellular trafficking and membrane translocation of pertussis toxin into host cells. Int J Med Microbiol. 2000;290:409–413. doi: 10.1016/S1438-4221(00)80053-3. [DOI] [PubMed] [Google Scholar]
- 41.Yu M, Haslam DB. Shiga toxin is transported from the endoplasmic reticulum following interaction with the luminal chaperone HEDJ/ERdj3. Infect Immun. 2005;73:2524–2532. doi: 10.1128/IAI.73.4.2524-2532.2005. [DOI] [PMC free article] [PubMed] [Google Scholar]
- 42.LaPointe P, Wei X, Gariepy J. A role for the protease-sensitive loop region of Shiga-like toxin 1 in the retrotranslocation of its A1 domain from the endoplasmic reticulum lumen. J Biol Chem. 2005;280:23310–23318. doi: 10.1074/jbc.M414193200. [DOI] [PubMed] [Google Scholar]
- 43.Teter K, Jobling MG, Holmes RK. Vesicular transport is not required for the cytoplasmic pool of cholera toxin to interact with the stimulatory alpha subunit of the heterotrimeric G protein. Infect Immun. 2004;72:6826–6835. doi: 10.1128/IAI.72.12.6826-6835.2004. [DOI] [PMC free article] [PubMed] [Google Scholar]
- 44.Werner ED, Brodsky JL, McCracken AA. Proteasome-dependent endoplasmic reticulum-associated protein degradation: an unconventional route to a familiar fate. Proc Natl Acad Sci USA. 1996;93:13797–13801. doi: 10.1073/pnas.93.24.13797. [DOI] [PMC free article] [PubMed] [Google Scholar]
- 45.Lee DH, Goldberg AL. Proteasome inhibitors: valuable new tools for cell biologists. Trends Cell Biol. 1998;8:397–403. doi: 10.1016/s0962-8924(98)01346-4. [DOI] [PubMed] [Google Scholar]
- 46.Gelman MS, Kannegaard ES, Kopito RR. A principal role for the proteasome in endoplasmic reticulum-associated degradation of misfolded intracellular cystic fibrosis transmembrane conductance regulator. J Biol Chem. 2002;277:11709–11714. doi: 10.1074/jbc.M111958200. [DOI] [PubMed] [Google Scholar]
- 47.Jensen TJ, Loo MA, Pind S, Williams DB, Goldberg AL, Riordan JR. Multiple proteolytic systems, including the proteasome, contribute to CFTR processing. Cell. 1995;83:129–135. doi: 10.1016/0092-8674(95)90241-4. [DOI] [PubMed] [Google Scholar]
- 48.Klausner RD, Donaldson JG, Lippincott-Schwartz J. Brefeldin A: insights into the control of membrane traffic and organelle structure. J Cell Biol. 1992;116:1071–1080. doi: 10.1083/jcb.116.5.1071. [DOI] [PMC free article] [PubMed] [Google Scholar]
- 49.Kulka RG, Raboy B, Schuster R, Parag HA, Diamond G, Ciechanover A, Marcus M. A Chinese hamster cell cycle mutant arrested at G2 phase has a temperature-sensitive ubiquitin-activating enzyme, E1. J Biol Chem. 1988;263:15726–15731. [PubMed] [Google Scholar]
- 50.Welsh CF, Moss J, Vaughan M. ADP-ribosylation factors: a family of approximately 20-kDa guanine nucleotide-binding proteins that activate cholera toxin. Mol Cell Biochem. 1994;138:157–166. doi: 10.1007/BF00928458. [DOI] [PubMed] [Google Scholar]
- 51.Kahn RA, Gilman AG. The protein cofactor necessary for ADP-ribosylation of Gs by cholera toxin is itself a GTP binding protein. J Biol Chem. 1986;261:7906–7911. [PubMed] [Google Scholar]
- 52.Sprang S. G protein mechanisms: insights from structural analysis. Annu Rev Biochem. 1997;66:639–678. doi: 10.1146/annurev.biochem.66.1.639. [DOI] [PubMed] [Google Scholar]
- 53.O'Neal CJ, Jobling MG, Holmes RK, Hol WG. Structural basis for the activation of cholera toxin by human ARF6-GTP. Science. 2005;309:1093–1096. doi: 10.1126/science.1113398. [DOI] [PubMed] [Google Scholar]
- 54.Murayama T, Tsai SC, Adamik R, Moss J, Vaughan M. Effects of temperature on ADP-ribosylation factor stimulation of cholera toxin activity. Biochemistry. 1993;32:561–566. doi: 10.1021/bi00053a022. [DOI] [PubMed] [Google Scholar]
- 55.Wesche J, Rapak A, Olsnes S. Dependence of ricin toxicity on translocation of the toxin A-chain from the endoplasmic reticulum to the cytosol. J Biol Chem. 1999;274:34443–34449. doi: 10.1074/jbc.274.48.34443. [DOI] [PubMed] [Google Scholar]
- 56.Jobling MG, Holmes RK. Identification of motifs in cholera toxin A1 polypeptide that are required for its interaction with human ADP-ribosylation factor 6 in a bacterial two-hybrid system. Proc Natl Acad Sci USA. 2000;97:14662–14667. doi: 10.1073/pnas.011442598. [DOI] [PMC free article] [PubMed] [Google Scholar]
- 57.Jackson LS, Tolleson WH, Chirtel SJ. Thermal inactivation of ricin using infant formula as a food matrix. J Agric Food Chem. 2006;54:7300–7304. doi: 10.1021/jf061199n. [DOI] [PubMed] [Google Scholar]
- 58.Krell T, Greco F, Nicolai MC, Dubayle J, Renauld-Mongenie G, Poisson N, Bernard I. The use of microcalorimetry to characterize tetanus neurotoxin, pertussis toxin and filamentous haemagglutinin. Biotechnol Appl Biochem. 2003;38:241–251. doi: 10.1042/BA20030089. [DOI] [PubMed] [Google Scholar]
- 59.McCracken AA, Kruse KB, Brown JL. Molecular basis for defective secretion of the Z variant of human alpha-1-proteinase inhibitor: secretion of variants having altered potential for salt bridge formation between amino acids 290 and 342. Mol Cell Biol. 1989;9:1406–1414. doi: 10.1128/mcb.9.4.1406. [DOI] [PMC free article] [PubMed] [Google Scholar]
- 60.Tsirigotis M, Zhang M, Chiu RK, Wouters BG, Gray DA. Sensitivity of mammalian cells expressing mutant ubiquitin to protein-damaging agents. J Biol Chem. 2001;276:46073–46078. doi: 10.1074/jbc.M109023200. [DOI] [PubMed] [Google Scholar]
- 61.Lavigne P, Crump MP, Gagne SM, Hodges RS, Kay CM, Sykes BD. Insights into the mechanism of heterodimerization from the 1H-NMR solution structure of the c-Myc-Max heterodimeric leucine zipper. J Mol Biol. 1998;281:165–181. doi: 10.1006/jmbi.1998.1914. [DOI] [PubMed] [Google Scholar]
- 62.Bech E, Jakobsen J, Orntoft TF. ELISA-type titertray assay of IgM anti-GM1 autoantibodies. Clin Chem. 1994;40:1331–1334. [PubMed] [Google Scholar]
Associated Data
This section collects any data citations, data availability statements, or supplementary materials included in this article.