

Abstract
We present a computational model of DNA-binding by σ70 in Escherichia coli which allows us to extract the functional characteristics of the wider promoter environment. Our model is based on a measure for the binding energy of σ70 to the DNA, which is derived from promoter strength data and used to build up a non-standard weight matrix. Opposed to conventional approaches, we apply the matrix to the environment of 3765 known promoters and consider the average matrix scores to extract the common features. In addition to the expected minimum of the average binding energy at the exact promoter site, we detect two minima shortly upstream and downstream of the promoter. These are likely to occur due to correlation between the two binding sites of σ70. Moreover, we observe a characteristic energy landscape in the 500 bp surrounding the transcription start sites, which is more pronounced in groups of strong promoters than in groups of weak promoters. Our subsequent analysis suggests that the characteristic energy landscape is more likely an influence on target search by the RNA polymerase than a result of nucleotide biases in transcription factor binding sites.
INTRODUCTION
In the first step of the prokaryotic transcription cycle, the sigma factor associates with the RNA polymerase (RNAP) core enzyme. The resulting complex, the RNAP holoenzyme subsequently binds to the promoter to initiate transcription. The core promoter elements in prokaryotes are two conserved hexamers located around 35 and 10 bp upstream of the transcription start site (TSS) separated by a variable spacing of 15–21 bp. The kidney-shaped sigma factor confers sequence specificity on the RNAP core enzyme in order to enable detection of the two promoter regions (1). In addition to the main sigma factor (σ70), alternative sigma factors are available in the cell to enable expression of specific sets of genes (2). Compilation of Escherichia coli promoters showed that only few σ70-promoters match the consensus sequence (TTGACA in the −35 region and TATAAT in the −10 region) in all positions (3). The promoter strength, i.e. the promoter's; ability to initiate transcription of the corresponding gene, is mainly determined by the binding energy between the RNAP holoenzyme and the promoter, which depends on the DNA sequence and the spacing (4). Apart from the homology to the consensus sequence and regulation through transcription factors, the strength of a promoter is further determined by the presence or absence of a third recognition site — the UP element, first reported in (5). The UP element is an AT-rich region located upstream of the −35 promoter region, that is recognized by the α-subunit of the RNA polymerase. The consensus sequence was found to consist of a 11-bp distal region ranging from −57 to −47 as well as a 4-bp proximal region ranging from −44 to −41 and is able to increase promoter strength more than 300-fold (6).
Weight matrices constitute an important tool for the detection and analysis of protein-binding sites and have already been applied for promoter analysis. They assign a score to each position of a sequence depending on its distance to the consensus sequence. It is generally believed that target site detection is mainly based on the binding energy between the protein and the DNA (4,7). Berg and von Hippel showed in (8) that the logarithms of the nucleotide occurrence frequencies are proportional to their binding energy contribution. However, large-scale analyses have only become possible through the increase of microarray data, which provided the means to compare the strength of thousands of promoters under the same experimental conditions. Kiryu et al. (9) used support vector regression to derive a relation between promoter sequences in E. coli and their strength from microarray data. They showed that not at each position the nucleotide occurrence frequencies in the E. coli promoter regions correspond to the nucleotides' effect on the binding energy between sigma factor and DNA and, thus, the promoter strength.
In the following, we present an approach of modeling the DNA-binding of E. coli σ70 based on promoter strength data calculated from microarray experiments in (9). Our computational method is based on a weight matrix that results in a measure for the binding energy between σ70 and the promoter region. Its application to a set of 3765 known σ70-promoters using a sliding window approach reveals a characteristic average energy landscape around the transcription start site. Moreover, we observe that the energy landscape is not exhibited by weak promoters but becomes distinct with increasing promoter strength. Subsequently, we verify that the observations are specific for the surrounding of promoters through comparison with random target sites. A discussion of the observed energy landscape follows, detailing possible interpretations, namely sequence evolution, nucleotide biases caused by transcription factor binding sites and a putative influence on the kinetics of promoter search by the RNAP holoenzyme.
MATERIALS AND METHODS
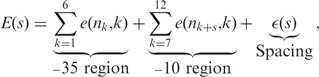
In general, the binding energy E(s) between sigma factor and the promoter can be written as
 |
1 |
where e(n, k) denotes the partial binding energy between the nucleotide n ∈ {A,C,G,T} and the binding site of the sigma factor associated with promoter position k. Thus, nk and nk+s refer to the nucleotides at positions k and k + s, respectively, of a given DNA sequence. The term ε(s) is the contribution of the spacing s between the promoter regions to the binding energy. This adds the energy the sigma factor needs to stretch or to squeeze in order to detect promoters with non-ideal spacing (i.e. other than 17 bp) (10,11). In Equation (1), we assume the contribution of nucleotides to be independent of their neighboring nucleotides, which is in most cases a reasonable approximation (12,13).
Weight matrix
The values e(n, k) are used to build up a [4 × 12] weight matrix W containing the contribution of the 12 nt to the binding energy:
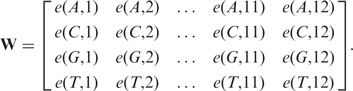 |
The values k ∈ [1;6] reference the positions in the −35 region and k ∈ [7; 12] reference those in the -10 region. The values of e(n, k) used in W are extracted from (9), where Kiryu et al. derived a measure for the nucleotide-dependent contribution to the binding energy by applying support vector regression on gene expression data. The partial binding energies were defined such that positive values indicate a strengthening effect on the overall binding energy, whereas negative values imply a weakening effect. However, since in chemistry binding energies underlying stable interactions are generally given by negative values and, thus, high negative overall energies should indicate candidate target sites (7), we multiply all values by −1. Figure 1 shows the obtained values for each position k ∈ [1;12] in the two promoter regions (left) as well as for each spacing s ∈ [15;19] (right). It has to be mentioned that the values were obtained after various normalizations of the microarray fluorescent intensities and hence have no physical unit (H. Kiryu, personal communication). Nevertheless, in the following, we denote the obtained measure by the term binding energy given without unit. It can be seen in Figure 1 and is reported in (9) that the -35 consensus sequence based on binding energy contributions (AAGAAT) differs from the −35 consensus sequence based on nucleotide occurrence frequencies [TTGACA, (3)].
Figure 1.

Partial binding energy contributions as extracted from (9) and modified. Left: partial binding energies e(n, k) of nucleotides for each position k ∈ [1;12] of the promoter ( k ∈ [1;6] reference the positions of the -35 region, k ∈ [7;12] those of the −10 region). Color scheme: Black = A, dark gray = C, light gray = G, white = T. Right: Contribution ε(s) of the spacing s ∈ [15;19] between the promoter regions to the binding energy.
Algorithm
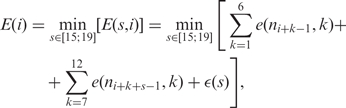
We apply the weight matrix W using a sliding window that is shifted in single-nucleotide steps over the DNA. As mentioned before, the sigma factor is capable of stretching or squeezing and hereby adapting to different promoter spacings s in order to bind to the energetically most favorable site. Therefore, the binding energy E(i) at position i is obtained by minimizing the energy score E(s, i) calculated according to Equation (1) over the spacing s:
 |
2 |
where ni+k−1 and ni+k+s−1 reference the nucleotides at positions k and k + s, respectively, of the sliding window, which is situated at position i with respect to the transcription start site (see illustration in Figure 2). We limit the spacing to s ∈ [15;19] since most of the promoters fall in this range (3).
Figure 2.

Graphical illustration of the parameters k, s and i from Equation (2). ni+k−1 and ni+k+s−1 reference the k-th nucleotide and (k+s) -th nucleotide, respectively, of the sliding window situated at position i with respect to the transcription start site (TSS, position 0).
Opposed to other methods, we apply the described algorithm on average, i.e. not for promoter detection of individual sequences but to a set of N known promoters of σ70 and calculate the arithmetic mean (average) of the resulting values El(i) for each position i, where the index l references the l-th promoter ( l ∈ [1;N] ). Additionally, we apply the algorithm to 10 000 random sequences of length 31 (i.e. enabling all possible spacings) considering p(A) = p(T) = 0.246 and p(C) = p(G) = 0.254 as estimated from the entire E. coli genome, which yields a mean value of Eran = −0.4423 [calculated according to Equation (2)]. Since it is convenient to set the average energy as 0 (7), we normalize the energy measure obtained through averaging over all El (i) accordingly:
| 3 |
In considering average values, we can eliminate the noise of individual sequences in order to extract the common energy landscape of all σ70-promoters. Due to the normalization by Eran in Equation (3), positive values of E (i) indicate a below-average binding strength, while negative values refer to an above-average binding strength between sigma factor and DNA sequence.
RESULTS
We download the E. coli σ70-promoters from the NCBI database (strain K 12; promoters extractable from the 400 datasets AE000x.1, x ∈ [111;510] (accessible via Genbank entry ‘u00096’), http://www.ncbi.nlm.nih.gov) that classifies promoters into computationally predicted and experimentally documented. Figure 3 shows the modeled average binding energy E (i) calculated according to Equation (2) and (3) (see Algorithm section) for all 3765 predicted and documented promoters in a range of 200 bp around the promoters aligned to the transcription start site (TSS, i = 0).
Figure 3.

Average binding energy E (i) [calculated according to Equation (2)] of 3765 known σ70-promoters aligned to the transcription start site (TSS). E (i) = 0 corresponds to the energy Eran of random sequences. E (i) shows three significant minima at positions −58 (A), −35 (B) and −12 (C).
Additional minima before and after the promoter
Figure 3 shows three significant minima of the binding energy compared to the surrounding and to the average binding energy E (i) = 0 of random sequences. The most significant minimum at around −35 reflects the actual recognition of both promoter regions, whereas those at −58 and −12 occur due to correlation between the −35 sequence and the −10 sequence; at position −58, the −10 part of the weight matrix (modeling the sigma factor) is overlapping the −35 promoter region (Figure 4A). The same applies for the minimum at −12, which occurs due to correlation between the −35 matrix part and the −10 promoter region (Figure 4C). The absolute minimum at −35 indicates the actual detection site and hereby the appropriate modeling through our algorithm (Figure 4B).
Figure 4.

The two side-minima at positions −58 and −12 observed in Figure 3 are likely to occur due to correlation between the two promoter regions. (A): At position -58, the -10 part of the weight matrix W is overlapping the −35 promoter region. (B): The minimum at −35 reflects the actual recognition of both promoter regions. (C): At position −12, the −35 part of the weight matrix W is overlapping the −10 promoter region.
It should be mentioned that the strength of the binding is not only reflected by the depth of the minima, but by their area due to the flexibility of the promoter's; position with respect to the TSS. While the position of the −35 region can vary by around ± 3, the position of the −10 region is restricted within around ± 1. Therefore, since Figure 3 shows the average binding energies of 3765 promoters, the minimum at −58 is broad but flat, whereas those at −12 is deep but narrow. The minimum at −35 is broad and deep at the same time and, thus, reflects — as expected — the strongest binding between sigma factor and promoter. At position −58, the −35 part of the sigma factor overlaps possibly present UP elements, thus, a part of the broadness and depth of the peak at -58 is likely to be caused by their AT-richness. Around 3% of the genes coding for mRNAs were shown to have a UP element close to the consensus (6). Another at least 30% are expected to have a UP element further from the consensus. If the two minima occur due to correlation between the promoter regions, they are expected to have the same strength. Since this is the case if taking not only the depth but also the area into account, the influence of the UP element is probable to be minor.
Characteristic energy landscape in a wider surrounding of the promoters
In order to investigate the energy landscape in the vicinity of the promoters, we apply our method to a wider range around the transcription start site. Figure 5 shows the average binding energy E (i) of all 3765 promoters in a range of 800 bp aligned to the TSS (position 0). The decline beginning at 300 bp before the promoter and the constant incline of the binding energy in the 200 bp after the promoter are remarkable. It is obvious in comparison with the energy E (i) = 0 of random sequences that the average binding energy deviates significantly from the random case in a range of ∼500 bp around the promoter. (A), (B) and (C) in Figure 5 show again the three minima at −58, −35 and −12 that were observed in Figure 3.
Figure 5.

Average energy landscape E (i) in a wider range around the 3765 known σ70-promoters aligned to the transcription start site (TSS, position 0). E (i) = 0 again corresponds to the energy Eran of random sequences.
Correlation with promoter strength
In the next step, we investigate whether the energy landscape observed in Figure 5 is present in all σ70-promoters or only occurs in certain sets with specific promoter strength. Therefore, we split the 3765 promoters in subgroups according to their strength as measured by the sigma factor's; binding energy El(i) to the l-th promoter sequence calculated according to Equation (2) (see Algorithm section). Here, i ∈ [−38;−32] depending on the position of the l-th promoter with respect to the TSS. In order to maintain a sufficient statistical basis, we divide the promoters into four groups with approximately 900 promoters each. Figure 6 shows the resulting plots sorted from weak (top) to strong promoters (bottom). It can be seen that the characteristic energy landscape is not observed for weak promoters, whereas it becomes distinct for stronger promoters. It is generally assumed that the binding energy at the promoter itself determines the rate of detection and hereby the expression rate of the respective gene (4,7,9). However, to our knowledge, a dependence of the promoter strength on the wider surrounding has never been reported.
Figure 6.

Average energy landscapes E (i) obtained if clustering the 3765 known σ70-promoters according to their strength into four groups with approximately 900 sequences each (top: weak promoters, bottom: strong promoters).
Verification of the results
In order to verify that the characteristic energy landscape is unique for the surrounding of promoters, we perform the following statistical test: we randomly permute the values in each column of our weight matrix W as well as the values of the vector ε(s) and hereby create a modified consensus sequence representing a new target site. Afterwards, we apply this new matrix W′ and the new vector ɛ′ (s) to the complete E. coli genome to search for the 3800 positions with minimum energy, i.e. those 3800 positions that are closest to the consensus sequence of W′ and the consensus spacing of ɛ′ (s). In the next step, we consider 500 bp around each of the 3800 positions, align these ranges to their target sites and calculate the average energy landscape (mean values) as detailed in the Algorithm section. According to the procedure described there, we scale the resulting energy values by subtracting the average energy obtained for 10 000 random sequences [p(A) = p(T) = 0.246, p(C) = p(G) = 0.254] of length 31. To guarantee a sufficient statistical basis, we perform 12 000 out of ∼ 4.4 × 10¹⁸ possible random permutations.
Characteristic energy landscape
In order to show that the decline before and the incline after the promoters is not a general characteristic observed around similar, aligned DNA sequences, we perform a linear regression on the first 250 bp and the last 150 bp of the energy landscapes obtained for the 12 000 permutations. High absolute gradients of these two regressions would indicate the existence of a decline and incline as observed around promoters in Figure 5. However, the gradient before promoters is significantly lower than those before random target sites, while the gradient after promoters is significantly higher than those after random target sites (Supplementary Data, Figure 1).
Side-minima
We stated in the Additional Minima section that the two minima before and after the actual promoter detection occur due to correlation between the −35 region and the −10 region. To corroborate this statement, we investigate the side-extremals observed around the random target sites obtained through permutation of W and ε(s). The results show that our algorithm is not biased to produce minima around the promoters, but instead we obtain maxima in case the two sequences are negatively correlated or minima in case they are positively correlated (see Supplementary Data, Figure 2). This fact confirms our statement in the Additional Minima section that the two promoter regions are on average highly positively correlated. Since minima of the energy landscape indicate strong binding between the sigma factor and the DNA, these positions might have implications on the process of promoter detection by σ70.
Energy landscape around experimentally verified promoters
The presented results are based on a dataset composed of experimentally documented and computationally predicted σ70-promoters. Since the inclusion of a high number of computationally predicted promoters might cause biases, we verify the occurrence and strength of the characteristic energy landscape using a set of 651 experimentally verified σ70-promoters from RegulonDB (version 5.7) (14). The resulting average binding energy exhibits the same characteristic landscape as observed for the dataset downloaded from the NCBI database (see Supplementary Data, Figure 3), merely with more noise-like fluctuations due to the smaller sample size.
Specificity for σ70-promoters
In the next step, we apply our algorithm based on the matrix derived from σ70-promoters to a set of 230 promoters of the six alternative sigma factors σ 19 (2 sequences), σ 24 (61 sequences), σ 28 (20 sequences), σ 32 (33 sequences), σ 38 (81 sequences) and σ 54 (33 sequences) to test our results for their specificity to occur around σ70-promoters. The promoter positions are downloaded from RegulonDB (version 5.7) using all promoters that are annotated including their position and their respective sigma factor. Because of the small sample size, the resulting energy landscape is noisy, but it exhibits a similar trend compared to Figure 5 (data not shown). This is, however, expected due to the strong relation between σ70 and some of the alternative sigma factors: while σ70 and σ 32 show similarities in detection of the −35 promoter element (15), σ70 and σ 38 even recognize the same consensus sequence and share genes (16). In fact, these two sigma factors account for nearly half of the used dataset. To come to a conclusive result regarding specificity of the energy landscape for σ70, it would thus be necessary to subdivide the dataset. Unfortunately, this is not possible with only 230 promoters on-hand, since the sample size for each sigma factor would become too small.
DISCUSSION
In the Verification of the Results section, we showed that the characteristic energy landscape is unique for promoters and is not exhibited around random target sites. Therefore, there has to be a sequence similarity between the surroundings of the 3765 promoters. In general, the energy landscape is inversely related to the AT-richness, since more than 90% of the consensus sequence of our weight matrix W is A or T (Figure 1). Interestingly, the landscape moreover indicates a continuous increase of sequence similarity to the promoter consensus when approaching the promoter site from either side. In the following, we present three possible explanations for the characteristic landscape based on both aspects, i.e. on an underlying nucleotide bias as well as on increasing sequence similarities to the promoter consensus sequence.
Sequence evolution
One possible reason for the increasing similarity to the consensus is that the vicinity of any similar, aligned target sites might show sequence similarities resulting from sequence duplications during E. coli evolution. It has been shown in (17) that the most likely mechanism developing such repeats in different species including E. coli is the slipped strand mispairing (SSM). Another major source of sequence polymorphisms in E. coli are the bacterial interspersed mosaic elements (BIMEs) that are also involved in a variety of regulatory functions like transcription termination, mRNA stabilization and translation control (18). However, the density of repeats in E. coli is among the lowest in bacteria (19). Moreover, it was shown by the permutation analysis in the Characteristic Energy Landscape section that the characteristic energy landscape is specific to promoters and is not observed around target sites obtained through permutation. Therefore, neighboring repeats are unlikely to be the only reason for the development of the energy landscape. Instead, it has to be — at least partly — based on specific properties or demands of the promoter regions and seems to be no common feature of the E. coli genome.
Transcription factor binding sites
Another possible explanation for the characteristic energy landscape lies in transcription factor binding sites (TFBSs) located around the TSS that might have an influence on the nucleotide content and, thus, on the energy landscape in the respective region. For this purpose, we download 2015 TFBSs of E. coli from RegulonDB (14) that were extracted from literature with experimental evidence. The distribution of TFBSs around the transcription start site approximately follows the shape of the observed energy landscape (see Supplementary Data, Figure 4).
To investigate whether the distribution of TFBSs has an influence on the nucleotide content, we determine the ratios of observed nucleotide content versus expected nucleotide content [p(A) = p(T) = 0.246, p(C) = p(G) = 0.254] in all TFBSs. To eliminate the influence of their genome surrounding, we embed the TFBSs at their correct position into random sequences. Figure 7 shows the resulting ratios in these 2015 sequences for the nucleotides A and T. The horizontal line marks a ratio of 1, i.e. the case that the observed nucleotide occurrence equals the expected occurrence. The figure shows an over-representation of A and T in TFBSs in the surrounding of the transcription start site, while G and C are under-represented (data not shown).
Figure 7.

Ratios of observed occurrence versus. expected occurrence of the nucleotides A (left) and T (right) in 2015 E. coli transcription factor binding sites downloaded from RegulonDB (14).
In the next step, we have to evaluate the influence of the observed nucleotide bias in TFBSs on the binding energies calculated through our algorithm. For this purpose, we generate 3800 random sequences using the calculated nucleotide probabilities (depicted in Figure 7) for each position. Afterwards, we apply our weight matrix W and the vector ε to these 3800 sequences as described in the Algorithm section. Figure 8 shows a comparison between the average landscape observed around promoters and the average landscape of the 3800 generated sequences. It can be seen that the nucleotide bias caused by the TFBSs is in part responsible for the characteristic landscape, however, does neither explain all of its decrease in energy at the transcription start site nor the wide range of low energies (500 bp).
Figure 8.

Comparison between the average binding energies around 3765 promoters as observed in Figure 5 (dotted line) and the average binding energies of 3800 random sequences generated based on the nucleotide biases caused by TFBSs as calculated from Figure 7 (solid line).
Influence on the kinetics of promoter search
The RNAP holoenzyme is believed to find the promoters by randomly binding to the DNA and subsequently moving along it by sliding, intersegment transfer and hopping (20). The sliding process (also known as one-dimensional diffusion) has been a focus of research for decades: after publication of the general theory by Berg, Winter and von Hippel in the 1980s (21), it could not be visualized until 1999 (22–24). Since then, two opinions evolved about the nature of one-dimensional diffusion. According to the first, DNA-binding proteins perform a random walk along the double-helix, i.e. they decide at each position with the same probability for a step to the right or to the left (22,25). In contrast to that, the second theory is based on a sequence-dependent binding energy of the protein that influences the sliding, i.e. it states that the direction and velocity of the process depend on the currently bound sequence (26–28). If the latter proves true, our observed energy landscape would have implications on the kinetic parameters of the RNAP holoenzyme's; search for the promoter sites (J. Weindl et al., manuscript in preparation).
It should be mentioned that the kinetic interpretation would not contradict the share of TFBSs in the energy landscape. It just raises the question which of the two causes influenced evolution of the respective region first: whether transcription factors had to adopt to sequences that enable an influence on the kinetics or whether the influence on the kinetics is a side product of TFBS evolution.
CONCLUSIONS
We presented a model of DNA-binding by σ70 during promoter detection in E. coli. We used a position-specific weight matrix based on promoter strength data from (9) to obtain a measure for the sequence-dependent binding energy between the sigma factor and the DNA. In contrast to applications described in the literature, we applied the matrix to a set of 3765 known promoters (aligned to the transcription start site) and evaluated the resulting average values. Hereby, we eliminated the strong fluctuations of individual sequences and obtained the energy landscape common to all σ70-promoters. Our algorithm proved its appropriate modeling through a significant minimum of the average binding energy at the promoter position. Additionally, we detected two minima of binding energy shortly before and after the actual promoter position based on correlation between the two promoter regions. Subsequently, we applied the algorithm to a wider range around the promoter regions revealing a characteristic energy landscape in the 500 bp surrounding the promoter. Thereafter, we clustered the promoters according to promoter strength to investigate whether the characteristic energy landscape is specific to a certain set. Indeed, we found that it is only distinct around strong promoters, whereas the landscape of binding energies around weak promoters corresponds to those of random sequences. Afterwards, we verified the uniqueness of the energy landscape for the surrounding of promoters using random permutations of the weight matrix. Finally, we discussed three putative interpretations of the energy landscape. First, since the landscape reflects similarities between the promoter and its surrounding, it may be a result of sequence duplications during evolution. Second, transcription factor binding sites may have an impact on the nucleotide content and hereby influence the energy landscape. Third, changing binding energies might have an influence on the kinetics of the RNA polymerase holoenzyme during promoter search. Based on the assumption that the latter has a sequence-dependent component, the energy landscape has implications on velocity and direction of the sliding process. After evaluating the random permutations, we were able to mostly exclude the first explanation (sequence duplications). We could not conclusively infer which of the second and third interpretations holds true, however, our results should give indications for further research and experiments. Nucleotide biases caused by transcription factor binding sites are likely to contribute to the energy landscape but cannot explain all of its characteristics. In any case, it stays open whether they influenced the evolution of the promoter surrounding first or just had to adapt to constraints posed by kinetic aspects. Another point of future investigations is to clarify the specificity of the observed energy landscape for σ70. Since only an insufficient number of promoters recognized by alternative promoters is currently available, the obtained results allowed no final conclusion. Due to the similarity of main sigma factors in prokaryotes (2,29), the results are expected to apply in the same way to other prokaryotic organisms.
SUPPLEMENTARY DATA
Supplementary data are available at NAR Online.
ACKNOWLEDGEMENTS
We would like to thank Hisanori Kiryu for providing us with his datasets of promoter strengths used for calculation of W and ε(s). Moreover, we are grateful to Peter H. von Hippel for encouraging comments on our manuscript. Deutsche Forschungsgemeinschaft (MU 1479/1-1 to J.Z.; HA 1358/10-2); Bund der Freunde der Technischen Universität München e. V. (22502). Funding to pay the Open Access publication charges for this article was provided by the Deutsche Forschungsgemeinschaft.
Conflict of interest statement. None declared.
REFERENCES
- 1.Campbell EA, Muzzin O, Chlenov M, Sun JL, Olson CA, Weinman O, Trester-Zedlitz ML, Darst SA. Structure of the bacterial RNA polymerase promoter specificity σ subunit. Mol. Cell. 2002;9:527–539. doi: 10.1016/s1097-2765(02)00470-7. [DOI] [PubMed] [Google Scholar]
- 2.Gruber TM, Gross CA. Multiple sigma subunits and the partitioning of bacterial transcription space. Annu. Rev. Microbiol. 2003;57:441–466. doi: 10.1146/annurev.micro.57.030502.090913. [DOI] [PubMed] [Google Scholar]
- 3.Lisser S, Margalit H. Compilation of E.coli mRNA promoter sequences. Nucleic Acids Res. 1993;21:1507–1516. doi: 10.1093/nar/21.7.1507. [DOI] [PMC free article] [PubMed] [Google Scholar]
- 4.Kobayashi M, Nagata K, Ishihama A. Promoter selectivity of Escherichia coli RNA polymerase: effect of base substitutions in the promoter −35 region on promoter strength. Nucleic Acids Res. 1990;18:7367–7372. doi: 10.1093/nar/18.24.7367. [DOI] [PMC free article] [PubMed] [Google Scholar]
- 5.Ross W, Gosink KK, Salomon J, Igarashi K, Zou C, Ishihama A, Severinov K, Gourse RL. A third recognition element in bacterial promoters: DNA binding by the alpha subunit of RNA polymerase. Science. 1993;262:1407–1413. doi: 10.1126/science.8248780. [DOI] [PubMed] [Google Scholar]
- 6.Estrem ST, Gaal T, Ross W, Gourse RL. Identification of an UP element consensus sequence for bacterial promoters. Proc. Natl Acad. Sci. USA. 1998;95:9761–9766. doi: 10.1073/pnas.95.17.9761. [DOI] [PMC free article] [PubMed] [Google Scholar]
- 7.Sengupta AM, Djordjevic M, Shraiman BI. Specificity and robustness in transcription control networks. Proc. Natl Acad. Sci. USA. 2002;99:2072–2077. doi: 10.1073/pnas.022388499. [DOI] [PMC free article] [PubMed] [Google Scholar]
- 8.Berg OG, von Hippel PH. Selection of DNA binding sites by regulatory proteins: statistical-mechanical theory and application to operators and promoters. J. Mol. Biol. 1987;193:723–743. doi: 10.1016/0022-2836(87)90354-8. [DOI] [PubMed] [Google Scholar]
- 9.Kiryu H, Oshima T, Asai K. Extracting relations between promoter sequences and their strengths from microarray data. Bioinformatics. 2005;21:1062–1068. doi: 10.1093/bioinformatics/bti094. [DOI] [PubMed] [Google Scholar]
- 10.Dombroski AJ, Johnson BD, Lonetto M, Gross CA. The sigma subunit of Escherichia coli RNA polymerase senses promoter spacing. Proc. Natl Acad. Sci. USA. 1996;93:8858–8862. doi: 10.1073/pnas.93.17.8858. [DOI] [PMC free article] [PubMed] [Google Scholar]
- 11.Mulligan ME, Brosius J, and McClure WR. Characterization in Vitro of the effect of spacer length on the activity of Escherichia coli RNA polymerase at the TAC promoter. J. Biol. Chem. 1985;260:3529–3538. [PubMed] [Google Scholar]
- 12.Djordjevic M, Sengupta AM, Shraiman BI. A biophysical approach to transcription factor binding site discovery. Genome Res. 2003;13:2381–2390. doi: 10.1101/gr.1271603. [DOI] [PMC free article] [PubMed] [Google Scholar]
- 13.Stormo GD, Fields DS. Specificity, free energy and information content in protein-DNA interactions. Trends Biochem Sci. 1998;23:109–113. doi: 10.1016/s0968-0004(98)01187-6. [DOI] [PubMed] [Google Scholar]
- 14.Salgado H, Gama-Castro S, Peralta-Gil M, Diaz-Peredo E, Sanchez-Solano F, Santos-Zavaleta A, Matrinez-Flores I, Jimenez-Jacinto V, Bonavides-Martinez C, et al. RegulonDB (version 5.0): Escherichia coli K-12 transcriptional regulatory network, operon organization, and growth conditions. Nucleic Acids Res. 2006;34(Database issue):D394–D397. doi: 10.1093/nar/gkj156. [DOI] [PMC free article] [PubMed] [Google Scholar]
- 15.Kourennaia OV, Tsujikawa L, and de Haseth PL. Mutational analysis of Escherichia coli heat shock transcription factor sigma 32 reveals similarities with sigma 70 in recognition of the −35 promoter element and differences in promoter DNA melting and −10 recognition. J. Bacteriol. 2005;187:6762–6769. doi: 10.1128/JB.187.19.6762-6769.2005. [DOI] [PMC free article] [PubMed] [Google Scholar]
- 16.Gaal T, Ross W, Estrem ST, Nguyen LH, Burgess RR, Gourse RL. Promoter recognition and discrimination by EσS RNA polymerase. Mol. Microbiol. 2001;42:939–954. doi: 10.1046/j.1365-2958.2001.02703.x. [DOI] [PubMed] [Google Scholar]
- 17.Levinson G, Gutman GA. Slipped-strand mispairing: a major mechanism for DNA sequence evolution. Mol. Biol. Evol. 1987;4:203–221. doi: 10.1093/oxfordjournals.molbev.a040442. [DOI] [PubMed] [Google Scholar]
- 18.Bachellier S, Clement JM, Hofnung M, Gilson E. Bacterial interspersed mosaic elements (BIMEs) are a major source of sequence polymorphism in Escherichia coli intergenic regions including specific associations with a new insertion sequence. Genetics. 1997;145:551–562. doi: 10.1093/genetics/145.3.551. [DOI] [PMC free article] [PubMed] [Google Scholar]
- 19.Rocha EP, Danchin A, Viari A. Functional and evolutionary roles of long repeats in prokaryotes. Res. Microbiol. 1999;150:725–733. doi: 10.1016/s0923-2508(99)00120-5. [DOI] [PubMed] [Google Scholar]
- 20.Halford SE, Marko JF. How do site-specific DNA-binding proteins find their targets? Nucleic Acids Res. 2004;32:3040–3052. doi: 10.1093/nar/gkh624. [DOI] [PMC free article] [PubMed] [Google Scholar]
- 21.Berg OG, Winter RB, and von Hippel PH. Diffusion-driven mechanisms of protein translocation on nucleic acids. 1. Models and theory. Biochemistry. 1981;20:6929–6948. doi: 10.1021/bi00527a028. [DOI] [PubMed] [Google Scholar]
- 22.Guthold M, Zhu X, Rivetti C, Yang G, Thomson NH, Kasas S, Hansma HG, Smith B. Direct observation of one-dimensional diffusion and transcription by Escherichia coli RNA polymerase. Biophys. J. 1999;77:2284–2294. doi: 10.1016/S0006-3495(99)77067-0. [DOI] [PMC free article] [PubMed] [Google Scholar]
- 23.Harada Y, Funatsu T, Murakami K, Nonoyama Y, Ishihama A, Yanagida T. Single-molecule imaging of RNA polymerase-DNA interactions in real time. Biophys. J. 1999;76:709–715. doi: 10.1016/S0006-3495(99)77237-1. [DOI] [PMC free article] [PubMed] [Google Scholar]
- 24.Bustamante C, Guthold M, Zhu X, Yang G. Facilitated target location on DNA by individual Escherichia coli RNA polymerase molecules observed with the scanning force microscope operating in liquid. J. Biol. Chem. 1999;274:16665–16668. doi: 10.1074/jbc.274.24.16665. [DOI] [PubMed] [Google Scholar]
- 25.von Hippel PH, Berg OG. Facilitated target location in biological systems. J. Biol. Chem. 1989;264:675–678. [PubMed] [Google Scholar]
- 26.Slutsky M, Mirny LA. Kinetics of protein-DNA interaction: facilitated target location in sequence-dependent potential. Biophys. J. 2004;87:4021–4035. doi: 10.1529/biophysj.104.050765. [DOI] [PMC free article] [PubMed] [Google Scholar]
- 27.Bruinsma RF. Physics of protein-DNA interaction. Physica A. 2002;313:211–237. [Google Scholar]
- 28.Barbi M, Place C, Popkov V, Salerno M. Base-sequence-dependent sliding of proteins on DNA. Phys. Rev. E Stat. Nonlin. Soft Matter Phys. 2004;70:041901. doi: 10.1103/PhysRevE.70.041901. [DOI] [PubMed] [Google Scholar]
- 29.Paget MSB, Helmann JD. The σ70 family of sigma factors. Genome Biol. 2003;4:203. doi: 10.1186/gb-2003-4-1-203. [DOI] [PMC free article] [PubMed] [Google Scholar]
Associated Data
This section collects any data citations, data availability statements, or supplementary materials included in this article.