Abstract
Temporal dynamics are a general feature of synaptic transmission. Recently, novel aspects of temporal dynamics of synaptic transmission have been reported in the neocortex. Here, we examine the possible effects of these dynamics on the spatiotemporal receptive fields of simple cells in V1. We do this by examining a simple model of a cortical neuron that displays stimulus orientation selectivity as a consequence of the pattern of thalamocortical synaptic weights. In our model, the receptive field structure is encoded functionally in either presynaptic probability of release or postsynaptic efficacy. We show that these different assumptions about the origin of receptive field structure lead to very different spatiotemporal dynamics in the case of flashed-bar stimulus. In addition, the results of the reverse correlation study suggest a possible test for differentiating between models. We also show that the temporal code induced by dynamic synapses can be used to distinguish between different inputs that induce the same average firing rate.
Temporal dynamics are a general feature of synaptic transmission (1); recently, novel aspects of these dynamics have been described in the neocortex (2, 3). Markram and Tsodyks (2) have used whole-cell somatic recordings to study the response dynamics of synaptic connections between a pair of neurons. They have shown that successive stimulation gives rise to depression in the strength of the postsynaptic cell response. This short-term depression effect is seen in both cortico-cortical (2, 3) and thalamocortical synapses (4, 5). Depression is frequency dependent; the steady-state magnitude of the excitatory postsynaptic current is approximately inversely proportional to the frequency of stimulation (6, 3). Further, it has been found that Hebbian pairing induces changes in the rate of synaptic depression (2). The properties of these synapses may have implications for spatiotemporal properties of cortical receptive fields (RFs) and for how established cortical plasticity mechanisms affect their formation. In this paper, we investigate the effect of such synapses on a simple, single-cell model exhibiting orientation selectivity. We assume that dynamic properties of synapses that were investigated in vitro are not significantly altered in vivo (7). Real cortical cells interact with neighboring cells, and these interactions may affect their properties; however, it has been shown (8) that noninteracting cells show orientation selectivity comparable to that observed in interacting cortical cells. Furthermore, most models invoking cortical interactions in order to sharpen orientation selectivity require a seed of orientation selectivity at the thalamocortical level (9, 10). The properties of cortical receptive fields are experience-dependent [For example, see review by Katz and Shatz (11), and likely candidates for the cellular mechanism that underly this plasticity are long-term potentiation and long-term depression (12). There is a long-standing debate about whether long-term potentiation alters the presynaptic probability of release (2, 13) or the postsynaptic efficacy (14, 15, 16). These two possibilities have different implications about the functional properties of RFs. In this paper, we examine the effects of these two different possibilities on the spatiotemporal structure of RFs in visual cortex.
METHODS
Synaptic transmission as modeled in ref. 6 characterizes the synaptic connection by its neurotransmitter resources. A fraction of resources become active on arrival of an action potential. The change in the postsynaptic conductance is proportional to these active resources. Active resources deactivate before being recovered‡ (for a detailed discussion see ref. 6). For typical interspike intervals of 20–100 ms, the amount of available resources would be depleted, resulting in synaptic depression. This scenario can be described by two cascaded differential equations. The phenomenological equations of synaptic dynamics used are similar to the ones described (6). The amount of available neurotransmitter resources (R) that can be activated is governed by
 |
1 |
where t = tiAP are the arrival times of action potentials, and pr is the presynaptic neurotransmitter probability of release. The postsynaptic conductance (G) is governed by
 |
2 |
where τi (1–2 ms) is the inactivation time constant and e is the postsynaptic efficacy. The response of the postsynaptic cell is modeled as a leaky integrate-and-fire neuron.
 |
 |
3 |
where V is the post synaptic potential, Vrest is the resting membrane potential, Es is the synaptic equilibrium potential, and Gk is the conductance of the kth synapse. This set of equations, which can account for experimentally observed synaptic depression (2, 3) has been shown (6) to exhibit the following interesting properties: (i) synaptic conductance decays to a steady-state value that is inversely proportional to the stimulus frequency f, and (ii) the decay time to steady-state is inversely proportional to pr and f.
Our model consists of (i) rectangular bar stimulus (16 × 16 pixels patch, bar aspect ratio 5 by 16 pixels); (ii) Lateral geniculate nucleus (LGN) cells (256 on channel, 256 off channel) with on/off center-surround receptive fields that has Poisson firing rate statistics; (iii) convergence of LGN on/off channel cells onto a single simple cell via dynamic synapses; and (iv) the formation of simple cell RF achieved through either spatial modulation of postsynaptic efficacy e or presynaptic probability of release pr. Details of retinal preprocessing and LGN and cortical RFs are shown in Fig. 1. We examined two cases as to the cellular origin of thalamocortical structure: (i) probability of release (PR) model, in which we assume the efficacy is constant for all synaptic connections and PR is modulated spatially to form a RF that has a preferred orientation in space; and (ii) synaptic efficacy (SE) model, in which efficacy is modulated spatially and PR is constant.
Figure 1.
Input patterns were flashed bars of different orientations. LGN cells have ON/OFF center–surround RFs realized by difference-of-Gaussian (DOG) filters (σ+ = 1, σ− = 3 for ON center, reverse for OFF center). They produce spike trains with Poisson statistics. The firing rates are set by the visual stimulus after filtering, with a spontaneous rate of 15 Hz. The cortical simple cell receives input from LGN cells. RFs for ON/OFF subregions are formed by modulation of efficacy or probability of release. Synaptic dynamics are described in text. An interactive demo program (written with matlab 5 for unix platforms) can be obtained from www.physics.brown.edu/people/artun/publications/dynsyn. This program contains all source codes for interactively generating tuning curves for flashed bars.
RESULTS
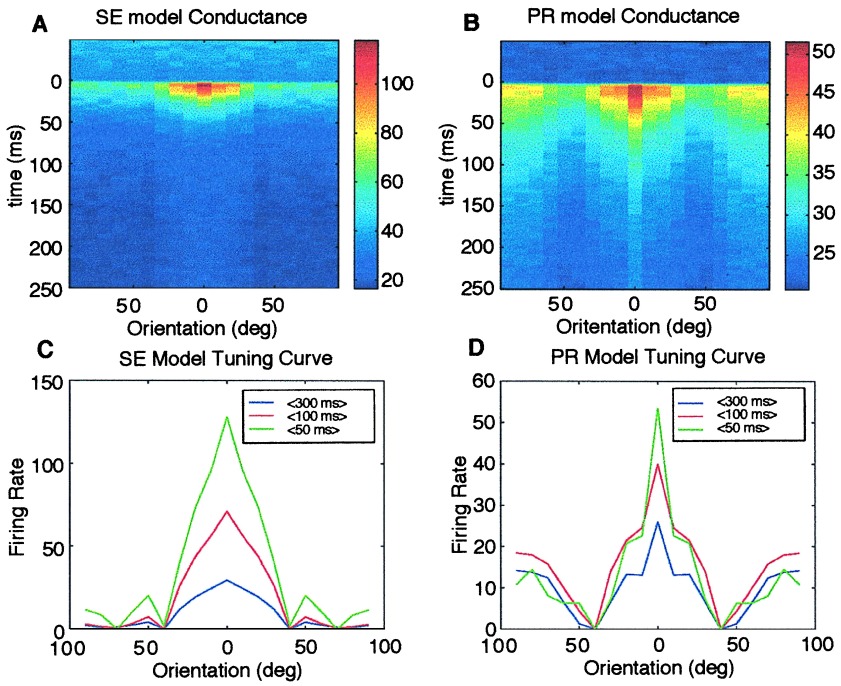
Firing rates and conductances of the neurons in response to flashed bars depend on the orientation of the bars and the post-stimulus time. At the onset of the stimulus, a rapid increase in conductance is followed by a decrease caused by synaptic depression (Fig. 2 A and B). Orientation tuning curves as shown in Fig. 2 C and D are trial averages of the responses over different time scales. Tuning curves in the SE model (Fig. 2C) approximately scales in time. In the PR model, the relative amplitudes of the sidebands with respect to the preferred orientation grow in time. The effect of synaptic depression in the SE model is orientation independent because of constancy in pr. However, depression is enhanced in the preferred orientation because of high pr and high f in the PR model. We can use a simpler version of the model to understand the behavior of the PR model. For this, it is assumed that a flashed bar has two regions, high luminance and low luminance, and the RF formed by spatial modulation of probability of release has two regions, high pr and low pr; thus, there are effectively four types of synapses that contribute to the conductance of the neuron. Analysis of this simplified system is given in Appendix A.
Figure 2.
(A and B) Color-coded representations of averaged conductances as a function of time and orientation. After the stimulus is presented, there is a rapid onset of activity, which decays in time because of synaptic depression. In the SE model, activity decays equally for all orientations whereas in the PR model, activity decays faster in the preferred orientation. (C and D) Tuning curves for the SE and PR models. Firing rates are averaged over 50, 100, and 300 ms for both models. The SE model shows unimodal tuning curves at all times whereas the PR model shows bimodal tuning curves that change over time.
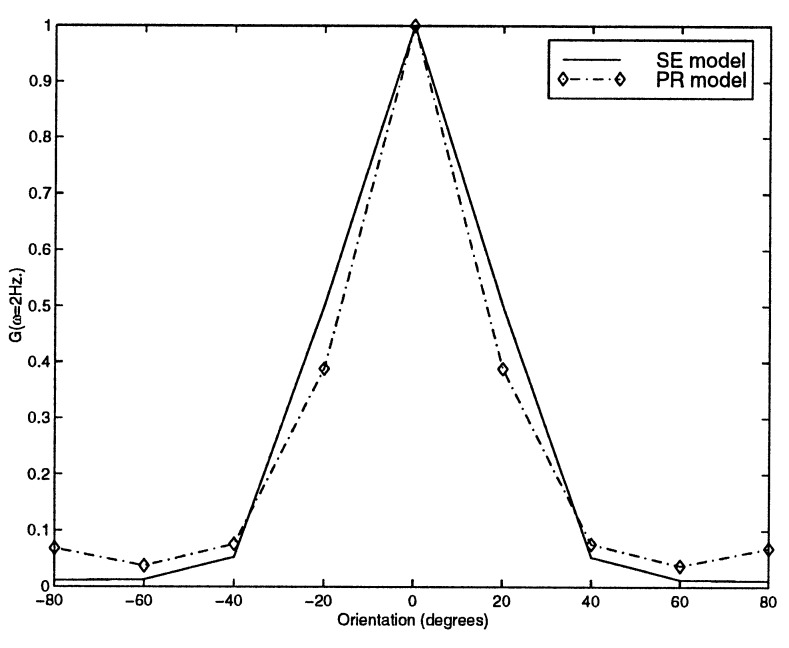
The difference between the two models are not identified easily when stimuli are moving gratings. In Fig. 3, response to moving sinusoidal grating are shown. In both models, the amplitude of modulation is proportional to the relative angle of the stimulus to the receptive field.
Figure 3.
Sinusoidal moving gratings swept across RF with a temporal frequency of 2 Hz are presented to the model. Tuning curves are shown for both models.
In a recent paper (17), reverse correlation in the orientation domain was used to study the visual system of monkeys. This study revealed novel dynamics of cells in monkey visual cortex. In their study, Ringach et al. (17) used randomly oriented gratings as stimuli presented at 60 Hz, thus obtaining kernels in the orientation domain. Using this method with similar input patterns, we have extracted the reverse correlation functions in the orientation domain for the two models. The PR model has a kernel bimodal in the orientation domain. The SE model however, has a kernel that is unimodal in the orientation domain (Fig. 4 A and B). Here, as in ref. 17, kernels are extracted with 1-ms precision, although the input is changed every 20 ms; this introduces an error on the assumption of whiteness of the input, which is neglected. These kernels are qualitatively similar to some of those described by Ringach et al. (17), especially those in which the shape of the kernel is inverted in time (e.g., figures 1c, 1d and 1g in ref. 17), showing that synaptic depression may account for this type of receptive field dynamics. We have devised a criterion to distinguish between PR and SE models by using these orientation domain kernels. We show in Fig. 4 C and D that, for the SE model, the zero-crossings for all orientations are the same, whereas they differ for the PR model. This phenomenon is robust to random fluctuations in pr. Thus, zero-crossings can serve as an indicator for the existence of a structured pr. This behavior arises directly from the properties of single synapse kernels, as explained in Appendix B.
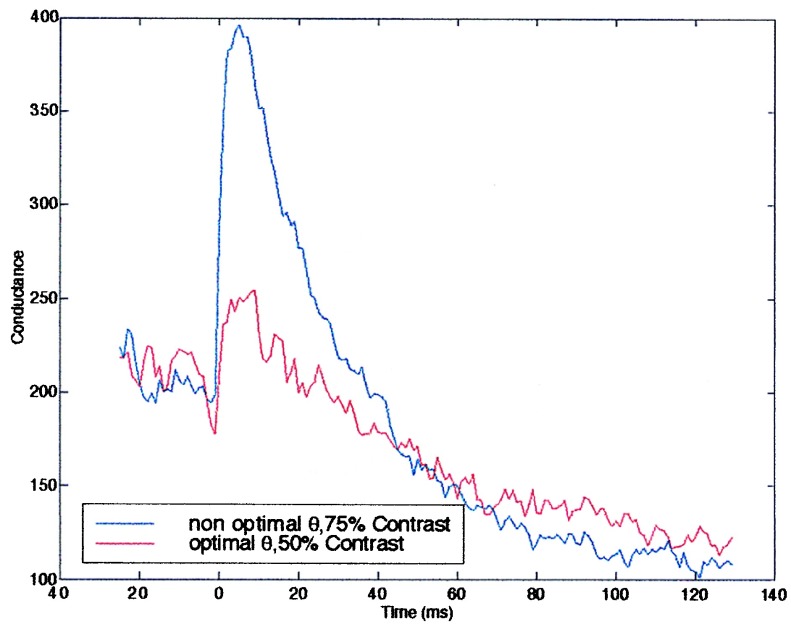
What purpose can such temporal dynamics serve? Stimuli that differ in several of their properties, such as orientation and contrast, may produce the same average conductance. A single neuron using a rate code could not be used to distinguish between such stimuli, and this would also limit ensemble codes that extract several parameters (18, 19). However, it is possible that the dynamics of the conductance, brought about by the synaptic depression, could produce a temporal code that can be used to distinguish between these inputs. Fig. 5 shows an example of this for two different inputs which yield same mean conductance over a 150-ms period. Over the first 50 ms, the conductance in the high contrast, nonpreferred orientation is higher than for the low contrast preferred orientation whereas over the next 100 ms, this is reversed. This type of a temporal code, which arises from synaptic dynamics, can help to distinguish between the different inputs. Furthermore, similar codes have been observed in the cortex (20). Synaptic depression can account for RFs that have transient rather than sustained properties. The SE model produces tuning curves that decay at approximately the same rate for all orientations and kernels that have the same zero-crossings. In contrast, the PR model produces tuning curves in which the response at the preferred orientation decays faster than at nonpreferred orientations and kernels with zero-crossings that vary strongly with orientation. It seems that the properties of neurons in the input layers, for which this model is more appropriate, agree better with the SE model (17) (for review see ref. 21). Further experiments, however, are required to settle this point. These results may indicate that plasticity in the thalamocortical connections does not alter the probability release but may alter the efficacy of synaptic connections consistent with experimental results (16).
Abbott et al. (3) have suggested that the purpose of the synaptic depression is to make synaptic conductances sensitive to changes in firing rates rather than to their magnitude. We have shown that the temporal code that arises from synaptic dynamics can be used to distinguish between features that can not be distinguished by the firing rate alone. Qualitatively similar results have been obtained experimentally (20) and have been shown to enhance the capacity of the neural code (19).
Acknowledgments
We thank David H. Goldberg, Mark Bear, and Barry Connors for useful discussions. This work was supported in part by the Charles A. Dana Foundation, the Office of Naval Research, and the National Science Foundation.
ABBREVIATIONS
- RF
receptive field
- PR
probability of release
- SE
synaptic efficacy
- LGN
lateral geniculate nucleus
Appendix
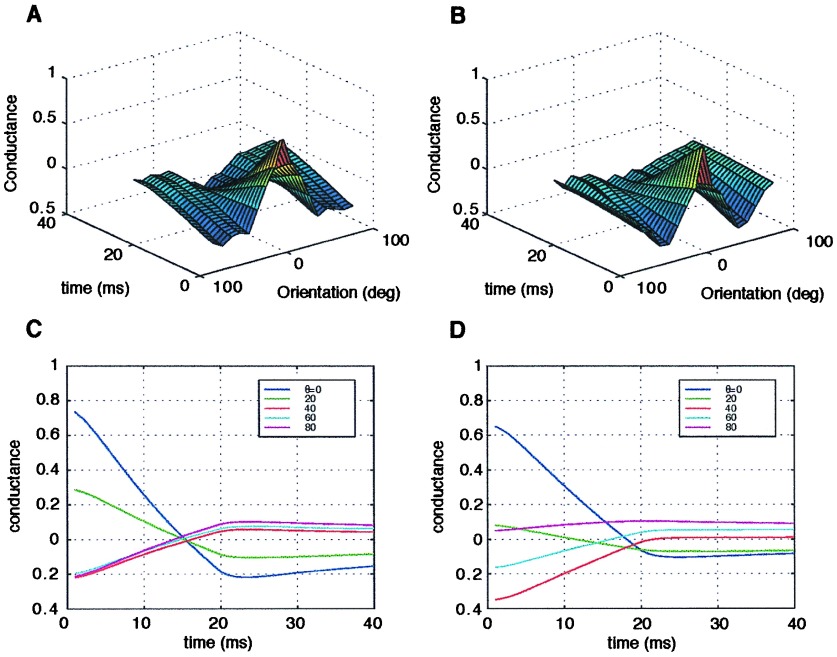
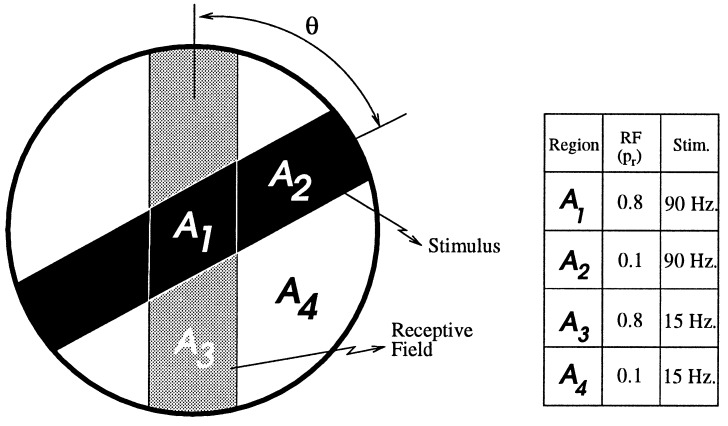
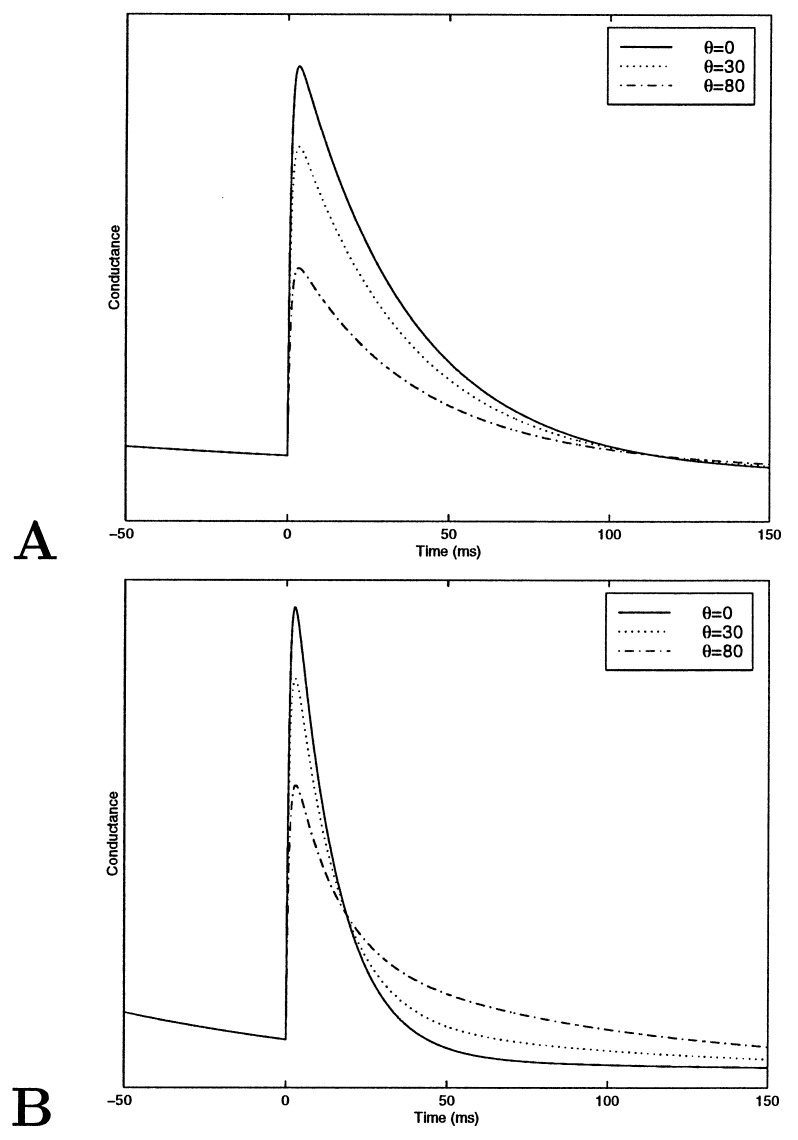
The stimulus in the simplified model is composed of two regions; the region on the bar has a high activity level, and that off the bar has a low activity level. The activity here is not the rate of a stochastic variable, but a deterministic variable. The receptive field, as in the complex model, is composed either of a structured PR or of a SE. In the PR model, the RF has a constant efficacy but two values of probability of release: high on the bar and low off the bar. For the SE model, the probability is kept constant, but the efficacy has two values. The detailed values used in this set of simulations are shown in Fig. 6. For both models, there are four types of synapses, as depicted in Fig. 6. We denote them by A1, in which both stimulus rate and probability (efficacy) are high; A2, in which the rate is high but the pr is low; A3 in which the rate is low and pr is high; and A4, in which both rate and pr are low. The relative fraction of each type of synapse depends on the angle between the RF and the stimulus. The conductance changes in time differently for each type of synapse. The total conductance is a weighted sum over the different types of synapses. In Fig. 7, the conductance as a function of time is shown for these two simplified model neurons for several different angles. In the SE model, for all orientations, the conductance decays in time at the same rate; thus, the preferred orientation has a higher conductance at all points in time. In the PR model, in contrast, the conductance at the preferred orientation decays faster than at other orientations. At 50 ms, the orientation with the highest conductance is the orientation that initially had the lowest conductance. Thus, as in the more complete model, the PR model neuron exhibits an inversion of the tuning curve in time. In this simple model, it is easy to see that this inversion arises from coupling synaptic depression and a structured probability. For instance, at the preferred orientation, the dominant term in the conductance is A1, which has a high firing rate and a high pr and therefore decays quickly; at the orthogonal orientation, however, the dominant terms have slower decay times and thus the total conductance has a slower decay rate as well.
Figure 4.
Reverse correlation functions (kernels) for the two models. (A) Kernel for the PR model. (B) Kernel for the SE model. Both kernels are extracted from stimuli presented at 50 Hz. C and D are cross-sections taken from A and B at different orientations, respectively. Zero-crossings (the time at which the value of the kernel is zero) vary with orientation for the PR model but are constant in the SE model.
Figure 5.
Bars at high contrast, nonoptimal orientation, and low-contrast optimal orientation are presented. Both stimuli produce the same mean conductance over 150 ms; however, the time course is clearly different.
Figure 6.
A simple four-synapse model using probability of release (or efficacy) to define the receptive field. There are four distinct regions as shown, A1, A2, A3, and A4 where the respective properties of synapses are shown in the table. The respective areas are a function of the relative angle between the RF and the stimulus.
Figure 7.
(A) The conductance for the simplified SE model. (B) The conductance for the simplified PR model.
Figure 8.
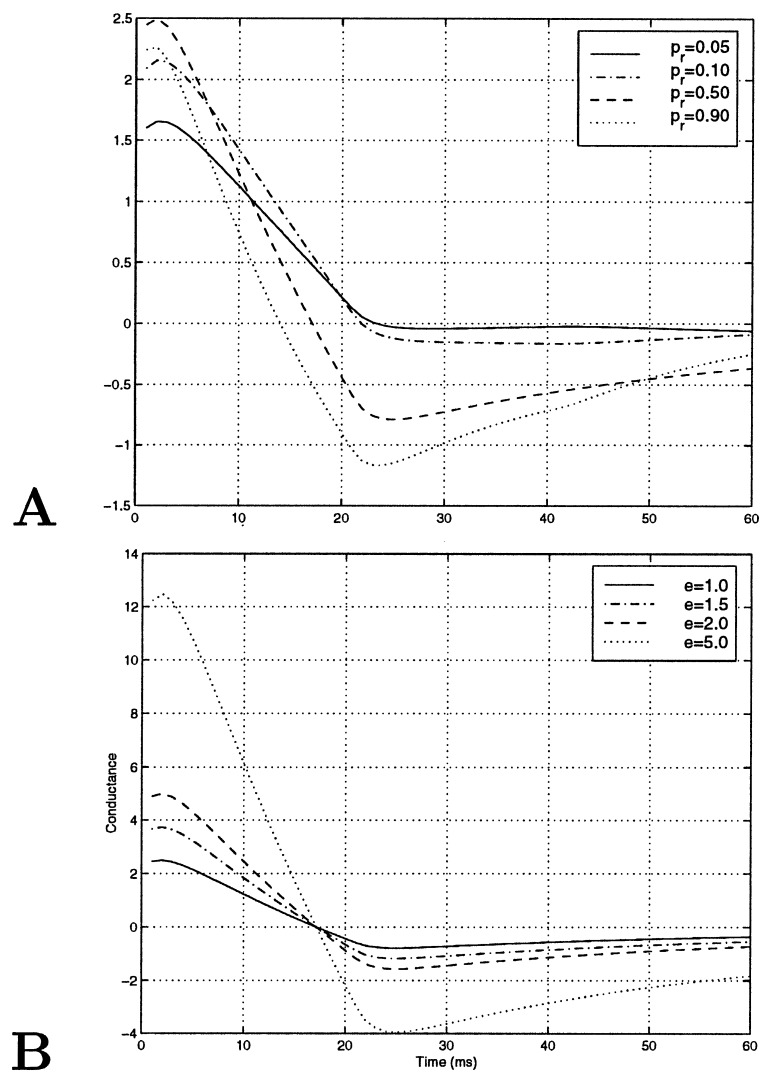
Single synapse kernels as a function of synaptic parameters. (A) Kernels in time as a function of probability of release. (B) Kernels in time as a function of efficacy. The effect of modulation of probability of release has interesting consequences; for instance, the zero-crossing of the kernels is not constant.
Appendix
We can gain valuable insight by decomposing the kernel into the sum of single synapse kernels. Conductance G(t) and the contribution from each synapse gk(t) are given by
 |
4 |
where xk(t) is the input to synapse k. If xk(t) has white Gaussian noise characteristics, then the first Wiener kernel can be computed by the Lee–Schetzen method (commonly known as reverse correlation):
 |
5 |
where Sxk is the power of the input. Single synapse kernels for different synaptic parameters shown in Fig. 8 A and B clearly show that the qualitative behavior of kernels is affected by pr. The efficacy e, however, only scales the kernel. Zero-crossing of the kernel is the time at which the value of the kernel is zero. When all synapses have the same pr, the model neuron kernel will have the same zero-crossing at all orientations. However, when there is a spatial modulation in pr, as in the PR model, bars at different orientations will activate a different fraction of synapses with high and low pr, thus producing different zero-crossings at different orientations. Thus, zero-crossings can serve as an indicator for the existence of a structured pr. This criterion is valid even if both e and pr are structured and are robust to random fluctuations in the pr. It is important to note that, in order to extract a kernel properly, the inputs need to be decorrelated in time. We, following ref. 17, have used inputs that randomly change every 20 ms, and, therefore, the extracted kernels can not tell us about time resolutions <20 ms.
Footnotes
With a time constant τr ≈ 600–1,000 ms.
References
- 1. Zucker R S. Annu Rev Neurosci. 1989;12:13–32. doi: 10.1146/annurev.ne.12.030189.000305. [DOI] [PubMed] [Google Scholar]
- 2.Markram H, Tsodyks M V. Nature (London) 1996;382:807–810. doi: 10.1038/382807a0. [DOI] [PubMed] [Google Scholar]
- 3.Abbott L F, Varela J A, Sen K, Nelson S B. Science. 1997;275:220–223. doi: 10.1126/science.275.5297.221. [DOI] [PubMed] [Google Scholar]
- 4.Stratford K J, Tarczy-Hornoch K, Martin K A C, Bannister N J, Jack J J B. Nature (London) 1996;382:258–261. doi: 10.1038/382258a0. [DOI] [PubMed] [Google Scholar]
- 5.Gil Z, Amitai Y, Castro M A, Connors B W. Neuron. 1996;19:579–586. [Google Scholar]
- 6.Tsodyks M V, Markram H. Proc Natl Acad Sci USA. 1997;94:719–723. doi: 10.1073/pnas.94.2.719. [DOI] [PMC free article] [PubMed] [Google Scholar]
- 7.Castro-Almanacos M J, Connors B W. J Neurosci. 1996;16:7742–7756. doi: 10.1523/JNEUROSCI.16-23-07742.1996. [DOI] [PMC free article] [PubMed] [Google Scholar]
- 8.Ferster D, Chung S, Wheat H. Nature (London) 1996;380:249–252. doi: 10.1038/380249a0. [DOI] [PubMed] [Google Scholar]
- 9.Somers D, Nelson S B, Sur M. J Neurosci. 1995;15:5448–5465. doi: 10.1523/JNEUROSCI.15-08-05448.1995. [DOI] [PMC free article] [PubMed] [Google Scholar]
- 10.Ben-Yishai R, Bar-Or R L, Sompolinsky H. Proc Natl Acad Sci USA. 1995;92:3844–3848. doi: 10.1073/pnas.92.9.3844. [DOI] [PMC free article] [PubMed] [Google Scholar]
- 11.Katz L C, Shatz C J. Science. 1996;274:1133–1138. doi: 10.1126/science.274.5290.1133. [DOI] [PubMed] [Google Scholar]
- 12.Bear M F. Prog Brain Res. 1996;108:205–218. doi: 10.1016/s0079-6123(08)62541-8. [DOI] [PubMed] [Google Scholar]
- 13.Stevens C F, Wang Y. Nature (London) 1994;371:704–707. doi: 10.1038/371704a0. [DOI] [PubMed] [Google Scholar]
- 14.Liao D, Hessler N A, Malinow R. Nature (London) 1995;375:400–404. doi: 10.1038/375400a0. [DOI] [PubMed] [Google Scholar]
- 15.Isaac J T, Nicoll R A, Malenka R C. Neuron. 1995;15:427–434. doi: 10.1016/0896-6273(95)90046-2. [DOI] [PubMed] [Google Scholar]
- 16.Isaac J T, Crair M C, Nicoll R A, Malenka R C. Neuron. 1997;18:269–280. doi: 10.1016/s0896-6273(00)80267-6. [DOI] [PubMed] [Google Scholar]
- 17.Ringach D L, Hawken M J, Shapley R. Nature (London) 1997;387:281–284. doi: 10.1038/387281a0. [DOI] [PubMed] [Google Scholar]
- 18.Zohary E. Biol Cybern. 1992;66:265–272. doi: 10.1007/BF00198480. [DOI] [PubMed] [Google Scholar]
- 19.Shouval H, Artun O B. In: Computational Neuroscience: Trends in Research. Bower J M, editor. New York: Plenum; 1998. pp. 267–272. [Google Scholar]
- 20.Gawne T J, Kjaer T W, Richmond B J. J Neurophysiol. 1996;76:448–453. doi: 10.1152/jn.1996.76.2.1356. [DOI] [PubMed] [Google Scholar]
- 21.Orban G A. Neuronal Operations in the Visual Cortex. Berlin: Springer; 1984. [Google Scholar]


