

Abstract
Translocation of TMPRSS2 to the ERG gene, found in a high proportion of human prostate cancer, results in overexpression of the 3′-ERG sequences joined to the 5′-TMPRSS2 promoter. The studies presented here were designed to test the ability of expression analysis on GeneChip Human Exon 1.0 ST arrays to detect 5′-TMPRSS2-ERG-3′ hybrid transcripts encoded by this translocation. Monitoring the relative expression of each ERG exon revealed altered transcription of the ERG gene in 15 of a series of 27 prostate cancer samples. In all cases, exons 4 to 11 exhibited enhanced expression compared with exons 2 and 3. This pattern of expression indicated that the most abundant hybrid transcripts involve fusions to ERG exon 4, and RT-PCR analyses confirmed the joining of TMPRSS2 exon 1 to ERG exon 4 in all 15 cases. The exon expression patterns also indicated that TMPRSS2-ERG fusion transcripts commonly contain deletion of ERG exon 8. Analysis of gene-level data from the arrays allowed the identification of genes whose expression levels significantly correlated with the presence of the translocation. These studies demonstrate that expression analyses using exon arrays represent a valuable approach for detecting ETS gene translocation in prostate cancer, in parallel with analyses of gene expression profiles.
Prostate cancer is the most common male cancer in the U.S. with 230,000 cases reported annually. Fusion of the TMPRSS2 gene to the ETS transcription factor gene ERG has been reported in up to two-thirds of this disease.1,2,3,4,5,6,7,8 Less frequently, TMPRSS2 becomes fused to the related ETS genes ETV1 and ETV4.2,3,4 In RT-PCR-based studies using 5′-TMPRSS2 primers and 3′-ERG primers, we and others4,5,6 have shown that translocations of TMPRSS2 to ERG can result in at least 17 distinctly structured fusion transcripts, which included fusions of exons 1, 2, and 3 of TMPRSS2 to exons 2, 3, 4, 5 or 6, of ERG. However, the most commonly detected fusion transcripts involved joining of exon 1 of TMPRSS2 to exons 4 or 5 of the ERG gene. As a consequence of this rearrangement, the 3′-exons of the ERG gene that become fused to 5′-TMPRSS2 exons are expressed at very high levels in contrast to the untranslocated 5′-ERG exons that remain expressed at a low level.4
The GeneChip Human Exon 1.0 ST array consists of approximately 5.4 million 5-μm features (probes) grouped into 1.4 million probe sets examining more than 1 million exon clusters.9 This array detects the levels of expression at both the gene and exon level. For each gene, the median number of probes is 30 to 40, usually distributed along the entire transcript length. For the ERG gene, exons 2 to 11 are represented by 19 probe sets. In principle, it should be possible to detect the presence and position of the TMPRSS2-ERG translocation in prostate cancer by monitoring the level of expression of each ERG exon using this array. Such information is potentially of considerable clinical interest because patients with cancers harboring TMPRSS2-ERG fusions appear to have a worse clinical outcome than those who lack this rearrangement.5,7,10,11 Several expression signatures have been identified that appear to mark more aggressive disease,12,13,14 so exon arrays additionally offer the potential for analysis of both translocation status and gene signature status in a single experiment. Through correlation of the expression levels of the translocated 3′-ERG exons to the levels of expression of other genes detected on the array, it should also be possible to find genes that represent downstream candidates for involvement in transformation after ERG overexpression. The study presented here is specifically designed to test the relative ability of expression analysis using GeneChip Human Exon 1.0 ST arrays compared with RT-PCR-based approaches to detect TMPRSS2-ERG translocations. Our results demonstrate the effectiveness of expression analysis using Exon 1.0 ST arrays for detecting ERG translocations and provide novel insights into the mechanism of development of human prostate cancer.
Materials and Methods
Clinical Samples
Fresh prostate cancer specimens were obtained from a systematic series of patients who had undergone a prostatectomy at the Royal Marsden Hospital NHS Foundation Trust and St Georges Hospital NHS Trust. Formalin-fixed, paraffin-embedded prostatic tissues from the same set of patients were also obtained from the pathology archives of these hospitals. None of these patients had evidence of metastasis at the time of diagnosis, and none received any previous treatment for prostate cancer. None of the patients had pathological stage >T3b, and all except one patient (PRC9) had prostate cancer with composite Gleason score ≤7. This study was approved by the Clinical Research and Ethics Committee at the Royal Marsden Hospital and Institute of Cancer Research.
Preparation of RNA
Frozen prostate slices were prepared and stored in RNAlater (Ambion Inc., Austin, TX) as described by Jhavar et al.15 A small piece of tissue (∼2 mm3) containing areas of cancer and/or normal glands was identified within the frozen prostate slice with the help of H&E-stained whole-mount sections from the adjacent formalin-fixed slices. This piece of tissue was washed in ice-cold PBS for 2 minutes, embedded in OCT embedding medium (Raymond Lamb UK, Ltd., Eastbourne, East Sussex, UK) and frozen on dry ice. Frozen sections obtained from this tissue were stained with H&E and high molecular weight cytokeratin to confirm the presence and location of cancer and normal glands within it. Areas containing cancer and normal glands were then macrodissected from the OCT block using a fresh sterile scalpel blade and used for RNA extraction. Care was taken to avoid contamination by using a new scalpel blade for each macrodissected area. Care was also taken to keep the OCT block frozen during macrodissection. RNA was extracted from the tissue in TRIzol (Invitrogen Ltd., UK, Paisley, UK) and purified using the RNeasy MinEluteTM clean up kit (Qiagen Ltd., UK, Dorking, Surrey, UK) according to the manufacturer's instructions.
Expression Analysis Using Affymetrix GeneChip Exon 1.0 ST Arrays
Expression profiles were determined using Affymetrix 1.0 Human Exon ST arrays according to the manufacturer's instructions. The Affymetrix GeneChip Whole Transcript Sense Target Labeling Assay was used to generate amplified and biotinylated sense-strand DNA targets from the entire expressed genome (1.5 μg of total RNA) without bias. Manufacturer's instructions were followed for the hybridization, washing, and scanning steps. Arrays were hybridized by rotating them at 60 rpm in the Affymetrix Gene Chip hybridization oven at 45°C for 16 hours. After hybridization, the arrays were washed in the Affymetrix GeneChip Fluidics station FS 450. The arrays were scanned using the Affymetrix Gene Chip scanner 3000 7G system. Gene- and exon-level expression signal estimates were derived from CEL files generated from Affymetrix GeneChip Exon 1.0 ST arrays using the multiarray analysis algorithm16 implemented from the Affymetrix Power Tools software. Gene-level estimates were obtained using the “core” metaprobe list annotation release 21. Exon-level data were filtered to include only those probe sets in the core metaprobe list. All probe sets (25) that mapped within ERG were found and assigned to the appropriate exon identified from Ensembl. Those probe sets (six in all) that did not lie entirely within an exon were removed. For each probe set within an exon, the log2 ratio of expression level in the test sample to that observed in control non-neoplastic prostate epithelium was calculated. Where more than one value was available for a single exon, the median value was taken as the representative ratio for that exon. The control normal prostate expression signal was defined as the mean of the three non-neoplastic prostate epithelium samples.
Detection of TMPRSS2-ERG Fusions by RT-PCR
RT-PCRs were performed using the conditions described by Clark et al6 using a forward TMPRSS2 exon 1 primer, 5′-CAGGAGGCGGAGGCGGA-3′, and a reverse ERG exon 4 primer, 5′-GTAGGCACACTCAAACAACGACTGG-3′. The quality of all cDNAs that failed to give TMPRSS2-ERG PCR products was verified by PCR using ETV1 primers (results not shown). Nested PCR was performed using 0.25 μl of primary PCR product and the following primers: TMPRSS2-Ex1-nest, 5′-GGAGCGCCGCCTGGAG-3′; and ERG-Ex4-nest, 5′-GTGAGGACCAGTCGTTGTTTGAGTG-3′. RT-PCR products were separated by electrophoresis in agarose gels and identified by DNA sequencing exactly as described previously.6
Statistical Analysis
Differential expression analysis was applied to the gene-level data with two groups divided based on whether an ERG break was detected. Linear models were determined for each transcript cluster (gene), and an estimate for the global variance was calculated by an empirical Bayes approach.17 A moderated t-statistic was computed for each transcript cluster with the resulting P values adjusted for multiple testing using Benjamini and Hochberg's method to control the false discovery rate.18 Those transcript clusters with an adjusted P value less than 0.05 were considered significantly differentially expressed between the two groups.
Results
Exon-Level Expression Profiling at the ERG Locus
GeneChip Human Exon 1.0 ST arrays were used to obtain genome-wide expression profiles from RNA samples prepared from 27 prostate cancer specimens and from 3 nonmalignant epithelial samples. A 3- to 5-mm-thick “research slice” was taken from individual prostatectomy specimens as described by Jhavar et al.15 H&E-stained whole-mount sections from above and below this slice were subject to histopathological examination. When cancer was detected at a particular location in both of these sections, it was inferred that cancer was also present in the intervening research slice at the same position. For the ERG gene, expression levels could be determined for exons 2 to 11 that were represented by 19 probe sets. GeneChip Human Exon 1.0 ST arrays do not contain a ‘core’ probe set for ERG exon 1. For every cancer, we determined the ratio of the level of expression of each individual ERG exon probe set relative to its expression in the samples of non-neoplastic prostate epithelium.
Many cancer samples appeared to exhibit both increased expression of exons 4 to 11 relative to the expression observed for exons 2 and 3 (Figure 1) and increased expression of exons 4 to 11 relative to those observed in control non-neoplastic prostate epithelium. This pattern of expression is precisely what would be expected if the TMPRSS2 sequences had become fused to ERG exon 4, causing increased expression of exon 4 and of the further of 3′- ERG exons. Increased expression invariably started at exon 4 in contrast to the diversity of possible ERG exon fusion positions previously detected in RT-PCR-based studies.5,6 To confirm these alterations, we performed two statistical tests: to qualify as “altered,” the expression profile needed to reach statistical significance in both tests. First, a two-sample t-test was used to determine whether the log2 expression ratio of the probe sets representing exons 4 to 11 were greater than the log2 expression ratios of probe sets representing exon 2 and 3. Second, a one-sample t-test was used to assess whether the log2 ratios of the probe sets representing exons 4 to 11 were greater than 0. Overall, 15 cancers gave a significant result (P < 0.05) in both tests (Table 1). Notably in all of the 15 cancers exhibiting this expression pattern, the 72-bp exon 8 of ERG appeared to be expressed at a lower level compared with exons 4 to 7 and 9 to 11, indicating that this exon can be spliced out in ERG fusion transcripts: the predicted structures of this alternatively spliced transcript is shown in Figure 2. For a single additional cancer, PRC25, a statistically significant increase in expression was observed across all ERG exons 2 to 11 (Figure 1; Table 1).
Figure 1.
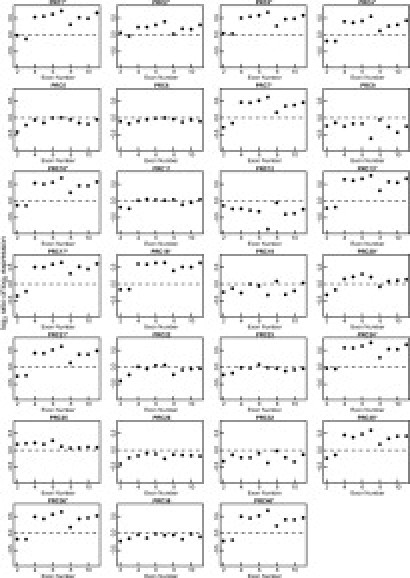
Expression data for ERG exons 2 to 11 in prostate cancers determined using GeneChip Human Exon 1.0 ST arrays. Cancers scored as having altered ERG expression profiles based on the statistical analyses presented in Table 1 are marked with an asterisk. In cancers designated as having altered ERG expression profiles, exon 8 of ERG was always expressed at lower levels than exons 4 to 7 and exons 9 to 11, indicating that this exon can be spliced out in rearranged ERG transcripts. In many of the cancers without altered ERG expression profiles, exon 7 was expressed at lower levels than exons 2 to 6 and exons 8 to 11, consistent with the presence of splice variants containing deletion of this 81-bp exon. The apparently depressed level of expression observed in some cancers (eg, PRC9) reflects the variation in observed level of ERG expression across the 27 cancers observed in this study, as illustrated in Figure 3, and was not believed to reflect an abnormal ERG expression pattern. For each probe set within an exon, the log2 ratio of the expression observed in the cancer to that observed in control non-neoplastic prostate epithelium was calculated. For each exon, the black dot represents the median of these values.
Table 1.
Assessment of ERG Gene Alterations
| Cancer | Discontinuous P value* | Up-regulation P value† | Expression on exon arrays‡ | TMPRSS2-ERG by RT-PCR§ | Fusion structure¶ |
|---|---|---|---|---|---|
| PRC1 | 0.0029 | 1.17 × 10⁻¹⁰ | Y | Y | T1-E4 |
| PRC2 | 0.0334 | 2.64 × 10⁻⁶ | Y | Y | T1-E4 T1-E2 |
| PRC3 | 1.63 × 10⁻¹⁰ | 7.73 × 10⁻¹¹ | Y | Y | T1-E4 |
| PRC4 | 5.58 × 10⁻¹⁰ | 1.93 × 10⁻⁷ | Y | Y | T1-E4 |
| PRC5 | 0.1204 | 0.9985 | N | N | |
| PRC6 | 0.1587 | 1.0000 | N | N | |
| PRC7 | 0.0077 | 1.06 × 10⁻⁸ | Y | Y | T1-E4 T2-E4 T1-E3 |
| PRC9 | 0.8866 | 1.0000 | N | N | |
| PRC10 | 4.99 × 10⁻¹² | 2.17 × 10⁻¹⁰ | Y | Y | T1-E4 |
| PRC11 | 0.0026 | 0.0905 | N | Y | T1-E4‖ |
| PRC12 | 0.9257 | 1.0000 | N | N | |
| PRC13 | 3.64 × 10⁻¹³ | 1.07 × 10⁻¹¹ | Y | Y | T1-E4 T2-E4 T1-E3 |
| PRC17 | 0.0109 | 8.22 × 10⁻¹² | Y | Y | T1-E4 |
| PRC18 | 2.61 × 10⁻¹³ | 1.49 × 10⁻¹¹ | Y | Y | T1-E4 T2-E4 T1-E3 |
| PRC19 | 0.1995 | 0.9931 | N | N | |
| PRC20 | 0.0430 | 1.47 × 10−05 | Y | Y | T1-E4 |
| PRC21 | 5.66 × 10⁻¹² | 9.38 × 10−09 | Y | Y | T1-E4 |
| PRC22 | 0.0895 | 0.9495 | N | N | |
| PRC23 | 0.0192 | 0.9943 | N | N | |
| PRC24 | 8.74 × 10⁻¹² | 4.01 × 10⁻¹¹ | Y | Y | T1-E4 |
| PRC25** | 0.9908 | 1.78 × 10−05 | N** | Y | T1-E2 |
| PRC26 | 0.1692 | 1.0000 | N | N | |
| PRC32 | 0.3233 | 1.0000 | N | N | |
| PRC35 | 0.0040 | 8.68 × 10⁻¹⁰ | Y | Y | T1-E4 |
| PRC36 | 6.14 × 10⁻¹² | 7.12 × 10⁻¹⁰ | Y | Y | T1-E4‖ |
| PRC38 | 0.0820 | 0.9995 | N | N | |
| PRC40 | 4.81 × 10⁻¹² | 9.26 × 10⁻¹⁰ | Y | Y | T1-E4 T2-E4 T1-E3 |
The P value obtained in a one-sided Welch two-sample t-test that examines whether the log2 ratios of probe sets within exon 4 to 11 are greater than the log2 ratio of probe sets within exon 2 and 3.
The P value obtained in a one-sample t-test that examines whether the log2 ratios of probe sets within exon 4 to 11 are greater than 0.
ERG status assessed based on discontinuous and unregulated P values. Both P values needed to be significant for the sample to be considered to have an altered expression pattern and designated Y.
Presence of TMPRSS2-ERG fusions assessed by RT-PCR.
Structure of TMPRSS2-ERG fusions detected in RT-PCR analyses.
Italics indicates that TMPRSS2-ERG fusions were detected only after nested RT-PCR.
Cancer PRC25 exhibited overexpression of exons 2 to 11.
Figure 2.
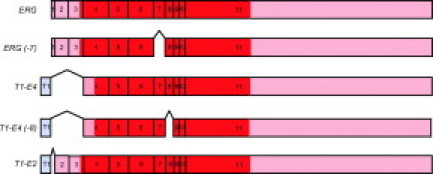
Structure of ERG and TMPRSS2:ERG transcripts. Sequences derived from TMPRSS2 are shown in blue; sequences derived from ERG are shown in red. Light color, untranslated regions; heavy color, open reading frames predicted by tools available at http://www.dnalc.org/bioinformatics/dnalc_nucleotide_analyzer.htm#translator. The figure shows alternatively spliced variants of the normal ERG transcripts [ERG and ERG (−7)] and of the TMPRSS2:ERG hybrid transcripts [T1-E4 and T1-E4(−8)]. The spicing out of the 81-bp exon 7 (−7) in normal ERG transcripts and of the 72-bp exon 8 (−8) in TMPRSS2:ERG hybrid transcripts is predicted to occur in some prostate cancers based on the results of exon expression profiling (Figure 1). The figure also shows the predicted structure of the T1-E2 TMPRSS2:ERG hybrid transcript. Expression data were only available for ERG exons 2 to 11; exon 1 was assumed to be present in the normal ERG transcripts.
The remaining 11 samples failed to show any evidence of altered or increased expression (Figure 1). Within this category expression levels for exon 7 could be divided into two groups (for example, compare PRC6 and PRC9 in Figure 1). In one group, the expression of exon 7 was low compared with that observed for exons 2 to 6 and exons 8 to 11, suggesting that in some cancers, the predominant ERG transcripts had spliced out this 81-bp exon: the predicted structures of the alternatively spliced normal ERG transcripts are shown in Figure 2. ERG transcripts lacking exon 7 have previously been reported in several tissues including prostate (see annotated mRNA record at NCBI AceView; http://www.ncbi.nlm.nih.gov/IEB/Research/Acembly/av.cgi?db=35g&c=MRNA&q=ERG.bAug05&h=_1_2007).
RT-PCR Detection of the TMPRSS2:ERG Fusion Transcripts
RT-PCR protocols were also used to detect TMPRSS2:ERG fusions in the same 27 cancer RNA samples. First round PCR was performed using a 5′ primer from exon 1 of the TMPRSS2 gene and a 3′ primer from exon 4 of the ERG gene. Samples that failed to yield PCR products in a first round of amplification were subject to nested PCR to see whether lower levels of hybrid transcript were present. Samples that failed to yield a visible PCR product after either a first-round or nested PCR reaction were scored as negative for TMPRSS2-ERG transcripts. PCR products were then subject to DNA sequencing to confirm their identity. An excellent correlation was observed between the detection of TMPRSS2-ERG fusions by RT-PCR and the altered ERG exon expression profiles obtained using GeneChip Human Exon 1.0 ST arrays (Table 1). All 15 cancers that scored as having an altered ERG expression pattern contained hybrid transcripts where TMPRSS2 exon 1 was fused to ERG exon 4 (called T1-E4 transcripts), consistent with each of these cancers demonstrating increased levels of expression of exons 4 to 11 relative to exons 2 and 3 (Table 1). Five of the cancer samples additionally contained T1-E3, and T2-E4 transcripts, and one cancer (PRC2) also contained T1-E2 transcripts (Table 1). Interestingly, despite the frequent presence of T1-E3 transcripts, only fusions to ERG exon 4 (T1-E4 and T2-E4) appeared to be present at sufficiently high levels to be detected by expression analysis using GeneChip Human Exon 1.0 ST arrays.
For two cancers (PRC25 and PRC11), discrepancies were found between the results based on analysis of expression data from GeneChip Human Exon 1.0 ST arrays and those obtained in RT-PCR analyses. For PRC11, nested RT-PCR studies identified a T1-E4 fusion transcript, but no altered pattern of expression was observed (Figure 1; Table 1). This result is explained if the fusion transcript is only present at low abundance within sample PRC11. RT-PCR studies identified a T1-E2 fusion transcript in cancer PRC25. This cancer demonstrated statistically significantly increased levels of expression across all exons 2 to 11 (Figure 1; Table 1). However, the GeneChip Human Exon 1.0 ST array does not contain probe sets corresponding to ERG exon 1, so a differential expression between 5′-ERG and 3′-ERG exons for this sample could not be scored.
The ETV1, ETV4, and TMPRSS2 Genes
GeneChip Human Exon 1.0 ST arrays contain probe sets that detect exons 1 to 13 of ETV1, exons 2 to 13 of ETV4, and exons 2 to 14 of TMPRSS2. Because TMPRSS2 has been found fused to exons 4 and 5 of ETV1 and within the intron immediately 5′ to exon 3 at ETV4, it should also be possible to detect increased expression of translocated ETV1 and ETV4 sequences that result from fusion to TMPRSS2 by expression analysis using exon arrays. However, in this series of 27 cancer samples, we failed to observe alteration and patterns of expression at these loci (results not shown) consistent with the observation that rearrangements of the ETV1 and ETV4 loci only occur at low frequency in human prostate cancers.2,3,4 Most fusions to ETS genes involve exon 1 of the TMPRSS2 gene. The absence of probe sets corresponding to TMPRSS2 exon 1 means that it is not possible to use alterations in the relative levels of expression of individual exons in this particular gene to detect the TMPRSS2-ETS translocations.
Gene Signature Associated with the Presence of the ERG Gene Translocation
To identify gene signatures associated with ERG gene translocation, we compared gene-level expression data in the 15 cancers that contained the ERG translocations, as judged by expression analysis onto GeneChip Human Exon 1.0 ST arrays, with the 11 cancers that were judged not to contain the translocation. For these analyses, we additionally included cancer PRC25, which exhibited overexpression across all ERG exons 2 to 11, within the ERG-rearrangement-positive group. A moderated t-statistic was computed for each gene, with the resulting P values adjusted for multiple testing. Sixteen genes were identified as significantly overexpressed in cancers containing ERG translocations (Table 2): the top 3 ranked genes were ERG, TDRD1 (tudor domain containing 1), and KCNH8. In addition to KCNH8, two other genes encoding potassium channels (KCNN4 and KCNS3) were also present in this list.
Table 2.
Genes Identified as Significantly Overexpressed in Cancers Containing ERG Translocations
| Adjusted P value | Gene | Description |
|---|---|---|
| 1.37 × 10⁻⁶ | ERG | v-ets-erythroblastosis virus E26 oncogene like (avian) |
| 4.73 × 10⁻⁵ | TDRD1 | Tudor domain containing 1 |
| 2.38 × 10⁻⁴ | KCNH8 | Potassium voltage-gated channel, subfamily H (eag-related), member 8 |
| 7.25 × 10⁻³ | LOC643036 | Similar to proteoglycan 3 |
| 7.25 × 10⁻³ | ChGn | Chondroitin β 1,4 N-acetylgalactosaminyltransferase |
| 1.42 × 10⁻² | HES1 | Hairy and enhancer of split 1 |
| 1.42 × 10⁻² | C8ORF4 | Chromosome 8 open reading frame 4 |
| 1.42 × 10⁻² | AMPD3 | Adenosine monophosphate deaminase (isoform E) |
| 1.42 × 10⁻² | KCNN4 | Potassium intermediate/small conductance calcium-activated channel subfamily N |
| 2.38 × 10⁻² | FLJ10246 | FLJ10246 |
| 2.85 × 10⁻² | NR4A2 | Nuclear receptor subfamily 4, group A member 2 |
| 3.05 × 10⁻² | NCALD | Neurocalcin δ |
| 3.26 × 10⁻² | KCNS3 | Potassium voltage-gated channel, delayed-rectifier, subfamily S, member 3 |
| 4.36 × 10⁻² | F3 | Coagulation factor III (thromboplastin, tissue factor) |
| 4.36 × 10⁻² | FAM77C | Family with sequence similarity 77, member C |
| 4.36 × 10⁻² | LOC651278 | Similar to serine hydrolase-like 2 |
Discussion
We have demonstrated that expression profiling onto GeneChip Human Exon 1.0 ST arrays can provide an accurate method for monitoring the ERG gene translocation in human prostate cancer. To our knowledge, this represents the first demonstration that exon arrays can be accurately used for this purpose. Potentially, however, the same approach could be used to detect other translocations in which the gene fusion is associated with overexpression of the translocated sequence, for example, in synovial sarcomas in which fusion of SYT to SSX1 results in abnormal expression of 3′-SSX sequences.19,20 Our statistical analyses of the exon array data failed to correctly predict the presence of the translocation in two cases. In one cancer, PRC11, the TMPRS2-ERG fusion transcript was only detected in nested PCR studies, indicating that it was only present at low levels. A second cancer, PRC25, containing a T1-E2 fusion transcript, exhibited overexpression of all ERG exons 2 to 11. However, for this particular fusion, differential expression between 3′-ERG exons and 5′-ERG exons could not be scored because the GeneChip Human Exon 1.0 ST array does not contain sequences representing ERG exon 1.
Overexpression of the ERG gene alone has been proposed as a surrogate for the presence of the translocation.4 This is illustrated in Figure 3 by the expression levels of ERG from individual cancers in the dataset of Stephenson et al.12 The cancers exhibiting high levels of ERG expression would be expected to contain ERG gene rearrangements, whereas those with low levels of ERG expression would be expected to lack such rearrangements. However, for cancers with an intermediate level of expression, it is not clear which cancers should be considered to harbor ERG gene fusions and which should be considered to lack the fusion. In the current study, we show that measurement of ERG expression using GeneChip Human Exon 1.0 ST arrays additionally provides data on the differential expression of 5′-ERG exons and 3′-ERG exons that for most prostate cancers allows a firm assignment of ERG-fusion status to be made. For comparison, the ERG gene expression levels obtained in the current study using GeneChip Human Exon 1.0 ST arrays together with the designation of ERG status based on analyses of the exon-level expression data are also shown in Figure 3.
Figure 3.

Expression levels of the ERG gene. Right: Institute of Cancer Research: expression data from exons 4 to 11 of the ERG gene from 27 cancers determined in the current study using GeneChip Human Exon 1.0 ST arrays. Samples were designated as ERG rearrangement-positive (red dots) or ERG rearrangement-negative (blue dots) based on the presence of an altered ERG expression profile (see Figure 1). Cancer PRC25, which had a statistically significant elevated expression of exons 2 to 11, is marked. Left: Stephenson et al12: expression data for the ERG gene determined using Affymetrix U133A human gene array as described previously. Data from each separate cancer sample is presented a black dot. The Stephenson dataset was normalized to our data by altering the complete expression distribution (including all genes and samples) such that the mean and variance were the same as those of the Institute of Cancer Research dataset.
Our results have also provided important new insights into the mechanism of prostate cancer development. Previous analyses of the TMPRSS2-ERG fusions, confirmed by RT-PCR results presented here, have revealed a diverse variety of possible fusion structures with several fusion transcripts commonly occurring within a single sample.4,5,6 Specifically, it has been found that T1-E4 and T1-E5 fusion transcripts occur together in many cancer samples. Expression analyses using exon arrays reveal that the most abundant transcript almost always involves fusion to exon 4 of ERG, suggesting that TMPRSS2 fusions to this exon may represent the biologically important fusion transcript. Analysis of the exon expression array data indicated that exon 7 of ERG was spliced out in some prostate cancers that lacked ERG alterations. It has been established that ERG gene transcripts with and without exon 7 have diverse functions during chondrocyte differentiation: transcripts containing exon 7 stimulate differentiation, whereas those lacking this exon block differentiation.21 Our results also suggest the possible importance of the splicing out of ERG exon 8 in TMPRSS2-ERG hybrid transcripts. However, the function of exon 8 in ERG is currently unknown. We conclude that expression analysis onto exon microarrays not only represents a valuable approach for scoring ETS gene translocations in parallel with determining gene expression profiles but also provides additional insights into the mechanism of prostate cancer development.
Acknowledgements
We thank Christine Bell for help with typing the manuscript.
Footnotes
Supported by Cancer Research UK, The National Cancer Research Institute, The Grand Charity of Freemasons, The Bob Champion Cancer Trust, The Rosetrees Trust, and The Orchid Appeal. Funding bodies had no involvement in the design and conduct of the study; in collection management, analysis, and interpretation of the data; or in preparation, review, or approval of the manuscript.
D.B. and C.C. are joint senior authors.
References
- 1.Iljin K, Wolf M, Edgren H, Gupta S, Kilpinen S, Skotheim RI, Peltola M, Smit F, Verhaegh G, Schalken J, Nees M, Kallioniemi O. TMPRSS2 fusions with oncogenic ETS factors in prostate cancer involve unbalanced genomic rearrangements and are associated with HDAC1 and epigenetic reprogramming. Cancer Res. 2006;66:10242–10246. doi: 10.1158/0008-5472.CAN-06-1986. [DOI] [PubMed] [Google Scholar]
- 2.Hermans KG, van Marion R, van Dekken H, Jenster G, van Weerden WM, Trapman J. TMPRSS2:ERG fusion by translocation or interstitial deletion is highly relevant in androgen-dependent prostate cancer, but is bypassed in late-stage androgen receptor-negative prostate cancer. Cancer Res. 2006;66:10658–10663. doi: 10.1158/0008-5472.CAN-06-1871. [DOI] [PubMed] [Google Scholar]
- 3.Tomlins SA, Mehra R, Rhodes DR, Smith LR, Roulston D, Helgeson BE, Cao X, Wei JT, Rubin MA, Shah RB, Chinnaiyan AM. TMPRSS2:ETV4 gene fusions define a third molecular subtype of prostate cancer. Cancer Res. 2006;66:3396–3400. doi: 10.1158/0008-5472.CAN-06-0168. [DOI] [PubMed] [Google Scholar]
- 4.Tomlins SA, Rhodes DR, Perner S, Dhanasekaran SM, Mehra R, Sun XW, Varambally S, Cao X, Tchinda J, Kuefer R, Lee C, Montie JE, Shah RB, Pienta KJ, Rubin MA, Chinnaiyan AM. Recurrent fusion of TMPRSS2 and ETS transcription factor genes in prostate cancer. Science. 2005;310:644–648. doi: 10.1126/science.1117679. [DOI] [PubMed] [Google Scholar]
- 5.Wang J, Cai Y, Ren C, Ittmann M. Expression of variant TMPRSS2/ERG fusion messenger RNAs is associated with aggressive prostate cancer. Cancer Res. 2006;66:8347–8351. doi: 10.1158/0008-5472.CAN-06-1966. [DOI] [PubMed] [Google Scholar]
- 6.Clark J, Merson S, Jhavar S, Flohr P, Edwards S, Foster CS, Eeles R, Martin FL, Phillips DH, Crundwell M, Christmas T, Thompson A, Fisher C, Kovacs G, Cooper CS. Diversity of TMPRSS2-ERG fusion transcripts in the human prostate. Oncogene. 2007;26:2667–2673. doi: 10.1038/sj.onc.1210070. [DOI] [PubMed] [Google Scholar]
- 7.Perner S, Demichelis F, Beroukhim R, Schmidt FH, Mosquera J-M, Setlur S, Tchinda J, Tomlins SA, Hofer MD, Pienta K, Keufer R, Vessella R, Sun X-W, Meyerson M, Lee C, Sellers WR, Chinnaiyan AM, Rubin M. TMPRSS2:ERG fusion-associated deletions provide insight into the heterogeneity of prostate cancer. Cancer Res. 2006;66:8337–8341. doi: 10.1158/0008-5472.CAN-06-1482. [DOI] [PubMed] [Google Scholar]
- 8.Yoshimoto M, Joshua AM, Chilton-Macneill S, Bayani J, Selvarajah S, Evans AJ, Zielenska M, Squire JA. Three-color FISH analysis of TMPRSS2/ERG fusions in prostate cancer indicates that genomic microdeletion of chromosome 21 is associated with rearrangement. Neoplasia. 2006;8:465–469. doi: 10.1593/neo.06283. [DOI] [PMC free article] [PubMed] [Google Scholar]
- 9.Gardina PJ, Clark TA, Shimada B, Staples MK, Yang Q, Veitch J, Schweitzer A, Awad T, Sugnet C, Dee S, Davies C, Williams A, Turpaz Y. Alternative splicing and differential gene expression in colon cancer detected by a whole genome exon array. BMC Genomics. 2006;7:325. doi: 10.1186/1471-2164-7-325. [DOI] [PMC free article] [PubMed] [Google Scholar]
- 10.Demichelis F, Fall K, Perner S, Andren O, Schmidt F, Setlur SR, Hoshida Y, Mosquera JM, Pawitan Y, Lee C, Adami HO, Mucci LA, Kantoff PW, Andersson SO, Chinnaiyan AM, Johansson JE, Rubin MA. TMPRSS2:ERG gene fusion associated with lethal prostate cancer in a watchful waiting cohort. Oncogene. 2007;26:4596–4599. doi: 10.1038/sj.onc.1210237. [DOI] [PubMed] [Google Scholar]
- 11.Nam RK, Sugar L, Wang Z, Yang W, Kitching R, Klotz LH, Venkateswaran V, Narod SA, Seth A. Expression of TMPRSS2 ERG gene fusion in prostate cancer cells is an important prognostic factor for cancer progression. Cancer Biol Ther. 2007;6:40–45. doi: 10.4161/cbt.6.1.3489. [DOI] [PubMed] [Google Scholar]
- 12.Stephenson AJ, Smith A, Kattan MW, Satagopan J, Reuter VE, Scardino PT, Gerald WL. Integration of gene expression profiling and clinical variables to predict prostate carcinoma recurrence after radical prostatectomy. Cancer. 2005;104:290–298. doi: 10.1002/cncr.21157. [DOI] [PMC free article] [PubMed] [Google Scholar]
- 13.Varambally S, Yu J, Laxman B, Rhodes DR, Mehra R, Tomlins SA, Shah RB, Chandran U, Monzon FA, Becich MJ, Wei JT, Pienta KJ, Ghosh D, Rubin MA, Chinnaiyan AM. Integrative genomic and proteomic analysis of prostate cancer reveals signatures of metastatic progression. Cancer Cell. 2005;8:393–406. doi: 10.1016/j.ccr.2005.10.001. [DOI] [PubMed] [Google Scholar]
- 14.Bismar TA, Demichelis F, Riva A, Kim R, Varambally S, He L, Kutok J, Aster JC, Tang J, Kuefer R, Hofer MD, Febbo PG, Chinnaiyan AM, Rubin MA. Defining aggressive prostate cancer using a 12-gene model. Neoplasia. 2006;8:59–68. doi: 10.1593/neo.05664. [DOI] [PMC free article] [PubMed] [Google Scholar]
- 15.Jhavar SG, Fisher C, Jackson A, Reinsberg SA, Dennis N, Falconer A, Dearnaley D, Edwards SE, Edwards SM, Leach MO, Cummings C, Christmas T, Thompson A, Woodhouse C, Sandhu S, Cooper CS, Eeles RA. Processing of radical prostatectomy specimens for correlation of data from histopathological, molecular biological, and radiological studies: a new whole organ technique. J Clin Pathol. 2005;58:504–508. doi: 10.1136/jcp.2004.021808. [DOI] [PMC free article] [PubMed] [Google Scholar]
- 16.Irizarry RA, Bolstad BM, Collin F, Cope LM, Hobbs B, Speed TP. Summaries of Affymetrix GeneChip probe level data. Nucleic Acids Res. 2003;31:e15. doi: 10.1093/nar/gng015. [DOI] [PMC free article] [PubMed] [Google Scholar]
- 17.Smyth GK. Linear models and empirical bayes methods for assessing differential expression in microarray experiments. Stat Appl Genet Mol Biol. 2004;3 doi: 10.2202/1544-6115.1027. article3. [DOI] [PubMed] [Google Scholar]
- 18.Benjamini Y, Hockberg Y. Controlling the false discovery rate: a practical and powerful approach to multiple testing. J R Stat Soc. 1995;7:289–300. [Google Scholar]
- 19.Cooper CS. Translocations in Solid Tumours. In: Cooper CS, editor. Landes Biosciences; Georgetown, TX: 2001. [Google Scholar]
- 20.Crew AJ, Clark J, Fisher C, Gill S, Grimer R, Chand A, Shipley J, Gusterson BA, Cooper CS. Fusion of SYT to two genes, SSX1 and SSX2, encoding proteins with homology to the Kruppel-associated box in human synovial sarcoma. EMBO J. 1995;14:2333–2340. doi: 10.1002/j.1460-2075.1995.tb07228.x. [DOI] [PMC free article] [PubMed] [Google Scholar]
- 21.Iwamoto M, Higuchi Y, Koyama E, Enomoto-Iwamoto M, Kurisu K, Yeh H, Abrams WR, Rosenbloom J, Pacifici M. Transcription factor ERG variants and functional diversification of chondrocytes during limb long bone development. J Cell Biol. 2000;150:27–40. doi: 10.1083/jcb.150.1.27. [DOI] [PMC free article] [PubMed] [Google Scholar]