

INTRODUCTION
Computed tomography (CT) is being investigated for a variety of radiologic tasks involving lung nodules and lung malignancies. These activities include using low-dose CT as a screening tool for the early detection of lung cancer in high risk populations (1,2), evaluating the response of primary and metastatic lung lesions to various therapies (3) and characterizing indeterminate nodules as benign or malignant (4, 5, 6). Radiologists are faced with the task of both identifying and characterizing lung nodules on large, multidetector row CT scans for these applications. This has motivated interest and research into computer-aided diagnosis (CAD) methods, with several commercial systems having either already received FDA approval or that have been submitted for approval of CAD or CAD-like systems.
To further stimulate research and development activities in this area, the National Cancer Institute (NCI) formed the Lung Image Database Consortium – the LIDC (7–9). The mission of the LIDC is: (a) to develop an image database as a web accessible international research resource for the development, training, and evaluation of CAD methods for lung cancer detection and diagnosis using CT and (b) to create this database to enable the correlation of performance of CAD methods for detection and classification of lung nodules with spatial, temporal and pathological ground truth. The intent of this database is to hasten advancement of lung nodule CAD research by (1) providing clinical images to investigators who might not have access to patient images and (2) creating a reference database that will support the relative comparison of different CAD systems performance, thus eliminating database composition as a source of variability in system performance (10). This database requires the collection of an appropriate set of scans, and the creation of “truth” for each scan.
The LIDC decided that information about the presence or absence of lung nodules, and the spatial extent of nodules when present, should be provided for each scan in the LIDC database. To obtain the best estimate of spatial truth, expert thoracic radiologists analyzed and annotated each of the collected CT scans. (Note that the LIDC also intends to provide histopathological “truth” for each scan in which this data becomes available). Previous research (11–14) has indicated that there is considerable variability among even expert readers in both the detection and boundary delineation of lung nodules on CT (15). This variability has been observed in many similar tasks, both in determining nodule size through estimating volume or measuring unidimensional or bidimensional lesion size to assess disease progression (16–21).
While the issue of inter-reader variability is widely recognized, the typically accepted solution to this problem is to form an expert review panel. However, this usually involves having a number of radiologists (typically an odd number greater than or equal to three) review each scan first independently, and then when there is disagreement, to jointly come together to arrive at a consensus decision. The goal of the LIDC is to annotate several hundred CT scans by thoracic radiologists at geographically separate centers. Therefore, obtaining spatial truth using ongoing consensus panels seemed to be a difficult, if not impossible, task. Consensus panels frequently reflect the opinion of the “strongest” member of the panel, as a recognized weakness of this approach. In addition, the truth panel approach does not capture the variability and uncertainty between readers, which may be of interest to a wide variety of lung nodule studies.
Therefore, the LIDC designed a two-phase data collection process that would: (a) allow multiple expert readers to review each scan; (b) unambiguously express the nodule location and spatial extent information acquired from each review in the form of expert annotations; (c) allow for and express differences between readers in the identification of nodules and the variability in the delineation of nodule boundaries; (d) allow the data collection process to be performed asynchronously so that all radiologists need not participate in the review of a single scan at the same instant in time. The purpose of this manuscript is to describe the design and implementation of the two-phase reading approach used by the LIDC in its data collection.
MATERIALS AND METHODS
Definitions of objects to be marked and annotation requirements
Before the review process could be implemented, the LIDC Steering Committee had to resolve exactly what would be marked during the review. The first step was to define what is meant by a “nodule”. While there were several definitions available, the LIDC decided that these defintions needed to be supplemented and clarified, especially in the context of screening and diagnosis of lung cancer using thin section CT imaging.. In the context of the LIDC data collection process, these defintions needed to be specific so that the annotation instructions could be provided to the radiologists who performed these tasks.
The term “nodule” (7) represents a spectrum of abnormalities (irrespective of presumed histology), which is itself a subset of a broader spectrum of abnormalities termed “focal abnormality;” a lesion should be considered a “nodule” if it satisfies the definition of “nodule” (the most essential component of which is its "nodular" morphology). The LIDC developed a nodule visual library to assist with this very visual definition (22). Nodules may represent primary lung cancers, metastatic disease, or non-cancerous processes. As part of the LIDC inclusion criteria, it was agreed that scans nominated for inclusion in the LIDC database should have between zero and six lung nodules, each with a maximum diameter of 30 mm.
Based on the clinical experience of the radiologists within the LIDC, a decision was made to distinguish between nodules ≥ 3 mm and < 3 mm. In addition, many low-dose, thin-section CT scans demonstrate many “non-nodule” objects that could be confused with nodules. Therefore, the LIDC decided to create three categories of objects to be marked:
Nodules ≥ 3 mm in diameter, regardless of presumed histology
Nodules < 3 mm in diameter of an indeterminate nature
Non-nodules ≥ 3 mm in diameter
Nodules that are < 3mm but are clearly benign (i.e. solidly calcified) were specifically excluded from being marked, as were non-nodules < 3mm. Each of the included categories is described below along with the annotation requirements for each. This is summarized in Table 1.
Table 1.
Summary of Categories of Objects to be Marked and the Annotation Requirements
Nodules ≥ 3 mm, regardless of presumed histology
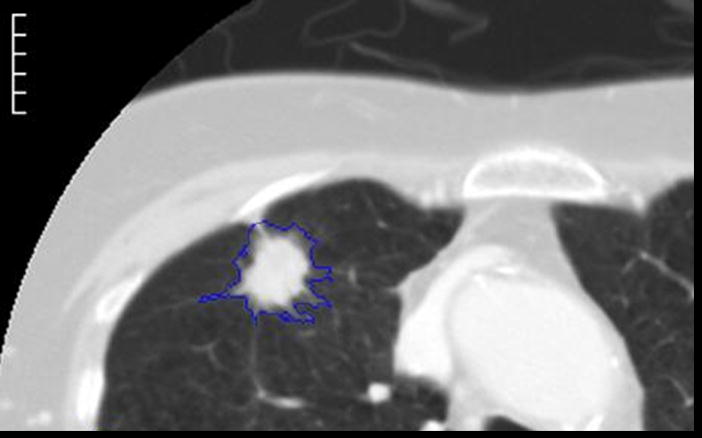
Nodules ≥ 3 mm in diameter (Figure 1) are characterized fully, including:
Figure 1.
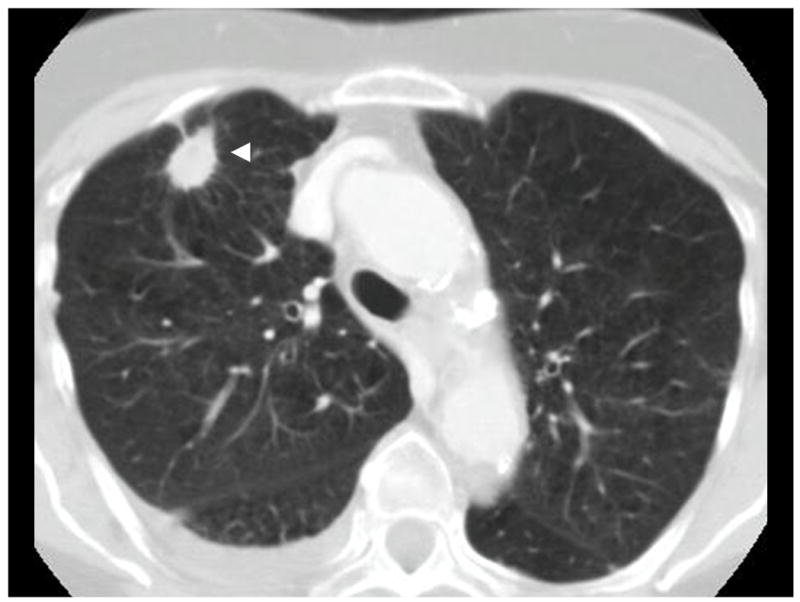
Example of a nodule ≥ 3 mm (arrowhead)
Drawing the full boundary of the nodule in three dimensions using each slice on which it appears. From this full boundary, other measures could be derived such as maximum diameter, nodule volume and mathematical descriptors of shape.
The specific instructions to radiologists were to “Draw an outline around the nodule in all sections in which it appears, with the pixels that comprise the outline at the first pixel outside the nodule”. This was done to ensure consistent drawing across radiologists and across software tools.
The radiologist also subjectively assessed each nodule’s characteristics such as its subtlety, internal structure, spiculation, lobulation, shape (sphericity), texture, margin and subjectively assessed likelihood of malignancy. These are described in detail below.
Nodules < 3 mm
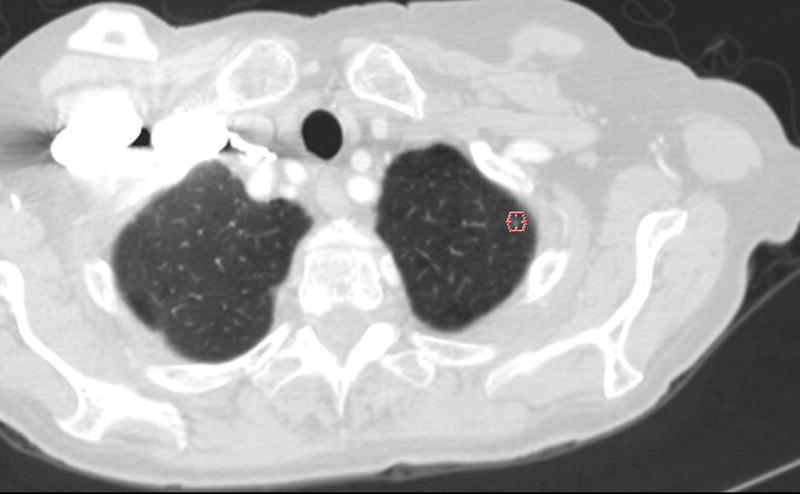
A very large number of such objects could potentially exist for nodules < 3 mm (Figure 2). Since these lesions are too small to accurately contour or characterize,
Figure 2.
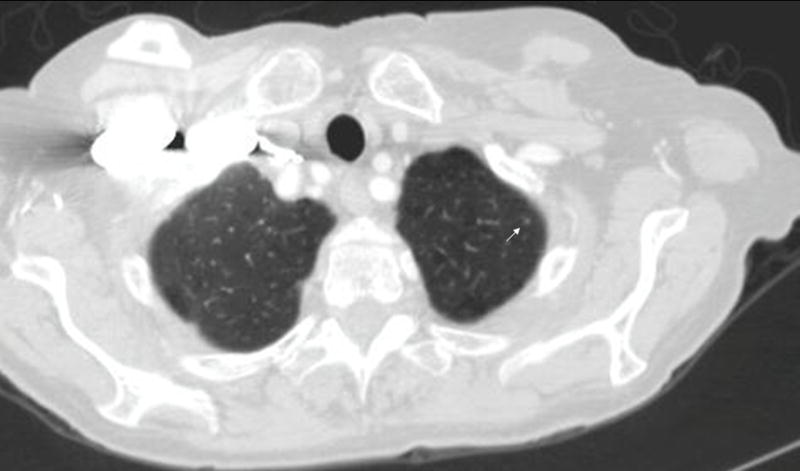
Example of a nodule < 3 mm (arrow)
Only a single mark (an approximate centroid) was placed and only on such nodules that were not clearly benign (not solidly calcified).
No subjective assessment of nodule characteristics would be performed.
Non-Nodules ≥ 3 mm
In addition to marking nodules, some objects that might be confused with nodules but were clearly not nodules would be marked as well. These include linear band-like opacities, scars, atelectasis, post surgical changes, or a nexus region of scars and other objects that are not nodules. Since the inclusion criteria limited nodules to 30 mm objects, if a lesion exceeding 30 mm in diameter was located in the scan, it was marked as a non-nodule ≥ 3mm. For these objects (just as for nodules < 3 mm):
Only a single mark (an approximate centroid) would be drawn.
No subjective assessment would be performed.
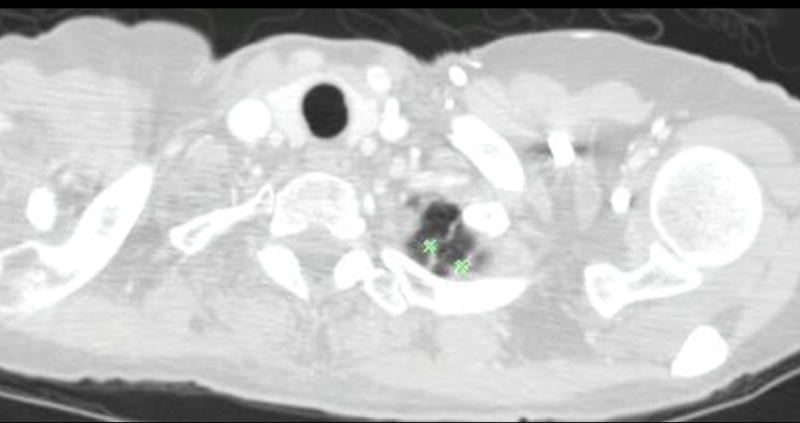
An example of some non-nodules ≥ 3 mm is shown in Figure 3.
Figure 3.
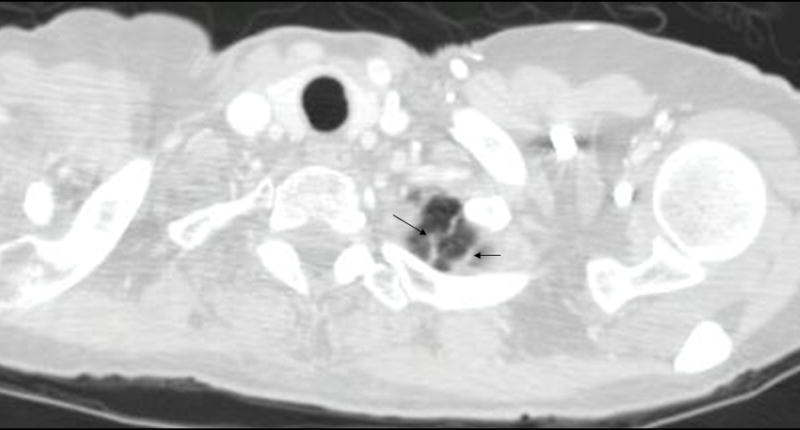
Example of non-nodules ≥ 3 mm (apical scars indicated by arrows)
Design of the Multiple Reader, Multiple Session Process
The LIDC data collection process model started from several basic requirements to establish the best possible information concerning the location and spatial extent of lung nodules: (a) that multiple readers be allowed to review each individual CT scan; (b) that no forced consensus would be imposed; and (c) that reviews be performed in a distributed and asynchronous fashion.
To facilitate this review process, the LIDC adapted a decentralized data communication model, illustrated in Figure 4. Rather than submit all scans to a central archive or to the NCI, each site is responsible for nominating scans from its clinical/research image archive with appropriate IRB approval and then distributing these scans to the other sites for review. These scans are nominated according to criteria spelled out in (7). The site that nominated and distributed the scan is called the “Requesting Site”. In this decentralized model, the other four sites act as “Servicing Sites” for this scan, performing the required reviews (described below). Because each site is responsible for both supplying scans (as the Requesting Site) and reviewing scans sent by other sites (as the Servicing Site), each site will perform Requesting Site activities for its own scans and Servicing Site activities for scans sent to it for review by other sites. In this model, a Requesting Site does not review scans from its own institution, thereby eliminating any possibility of prior knowledge of the clinical outcome of the scan. Requesting Site responsibilities extended beyond scan nomination to managing the scan through the reading process (below) until all the required annotation and other information (such as diagnosis obtained from pathology) is obtained.
Figure 4.
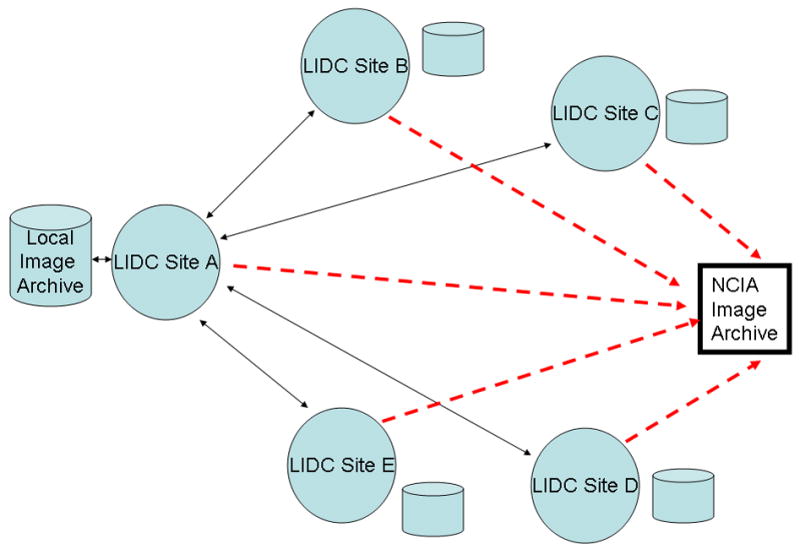
Diagram showing the distributed communication model used by the LIDC. Each of the five sites has its own local imaging archive, from which it draws images to be supplied to the LIDC. Each site communicates with each other site in a two-way fashion (solid two-way arrows). Each site also communicates in a one-way fashion (dashed arrows) with the NCIA Image Archive by submitting completed scans (image data, annotation, etc.) for which it was the requesting site.
Blinded Reading Phase
The LIDC designed a two-phase reading approach to provide the best estimate of nodule location and spatial extent. In the first phase, referred to as the “Blinded Read phase”, the Requesting Site sends the scan to each Servicing Site for review. At each Servicing Site, one reader reviews the CT scan independently, without any information as to what readers at other sites have detected or marked; thus they are blinded to the results of other readers. This first phase is performed asynchronously and no coordination is required between readers. For each Blinded Read session, the reader reviews the scan, identifying and annotating all nodules and non-nodules. Figure 5 illustrates example annotations from a Blinded Read session.
Figure 5.
This figure shows examples of the annotations by LIDC readers during the Blinded Read phase and includes: (a) the contouring of a nodule ≥ 3mm (the same nodule that was shown in Figure 1), (b) the marking of an approximate centroid for a nodule < 3mm (the same nodule < 3mm that was shown in Figure 2); and (c) the marking of non-nodules ≥ 3mm (the same non-nodule apical scars that were shown in Figure 3).
When the Blinded Reading session is completed at each Servicing Site, the annotations are captured in a standard format (see below) and sent to the Requesting Site, which then compiles the annotations for the Blinded Read phase and records them in a local database.
Unblinded reading phase
In the second phase, known as the “Unblinded Read phase,” the Requesting Site sends out the compiled blinded read annotations to the readers who reviewed the scan in the Blinded Read Phase. Each reader then re-reviews the scan, but this time the reader is shown both their own blinded read annotations and all of the blinded review annotations of the other readers, thereby being “unblinded” to the annotations of the other readers. The annotations are labeled so that each reader knows which annotations are their own and which are from other reader; the annotations of the other readers are anonymized. An example of the unblinded review interface is illustrated in Figure 6.
Figure 6.
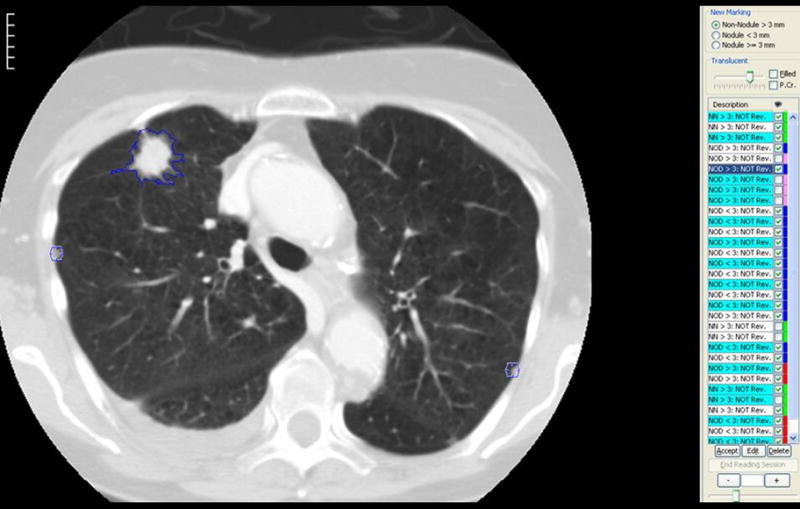
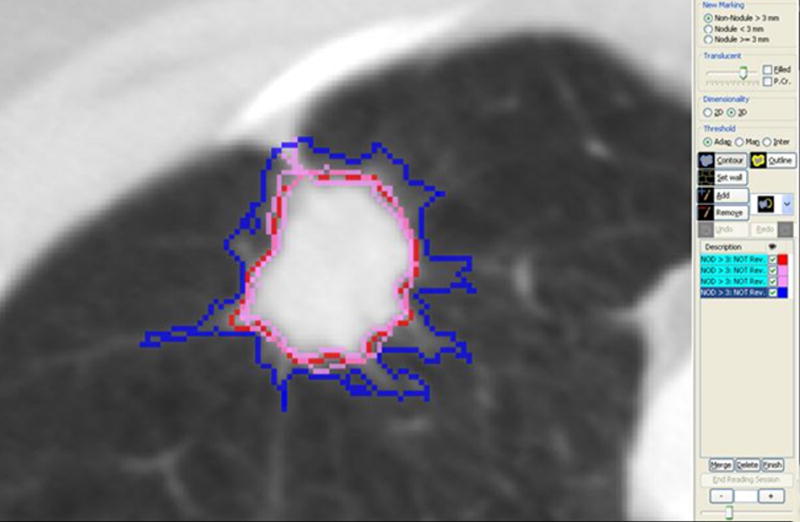
(a) This figure shows one of the annotation tools used to implement the LIDC unblinded read review process. In this implementation, the compiled annotation results from the Blinded Read phase are displayed in a worklist on the right hand side. These marks are color coded in two different ways: (1) Under the description column, objects that spatially overlap – and therefore are assumed to represent the same marked objerct – are grouped together in alternating green and white colored background labels. (2) For each object, the right hand column is color coded so that: the reader’s own marks from the Blinded Read are in blue, other reader’s marks are in red, pink is used to represent objects that overlap an object in the same group and green represents objects already approved for the unblinded read (which by default includes all non-nodules as these do not have to be matched or reviewed); (b) This shows an example of the multiple contours that result from the Blinded Read, where the blue contour is that of the current reader and contours of other readers are shown in red and pink..
The reader now performs a second review of each scan and decides for each annotation to either: (a) accept their original annotation without alteration, (b) add an annotation (e.g., if they missed an object that another reader marked as a nodule), (c) delete an annotation or (d) modify the boundaries of an annotation. The Unblinded Reading phase also required each reader to subjectively characterize several properties of each nodule ≥ 3mm using a set of descriptors:
Subtlety - difficulty of detection
Internal structure – internal composition of the nodule (soft tissue, fluid, fat, air)
Calcification – pattern of calcification, if present
Sphericity – the three-dimensional shape of the nodule in terms of its roundness
Margin – description of how well-defined the margin is
Lobulation – the degree of lobulation ranging from none to marked
Spiculation – the extent of spiculation present
Radiographic solidity – internal texture (solid, ground glass or mixed)
Malignancy - subjective assessment of the likelihood of malignancy, assuming the scan originated from a 60-year-old male smoker.
An example interface is shown in Figure 7. This figure illustrates that each of the above characteristics are rated on a five-point scale, except for internal structure and calcification. For some of the categories, descriptive terms were used for all five possible responses; for others, no descriptive terms were associated with the five possible responses. For example, a numeric value is available if the reader wants to score a lesion’s sphericity somewhere between “ovoid” and “round”, though no satisfactory descriptive term could be found.
Figure 7.
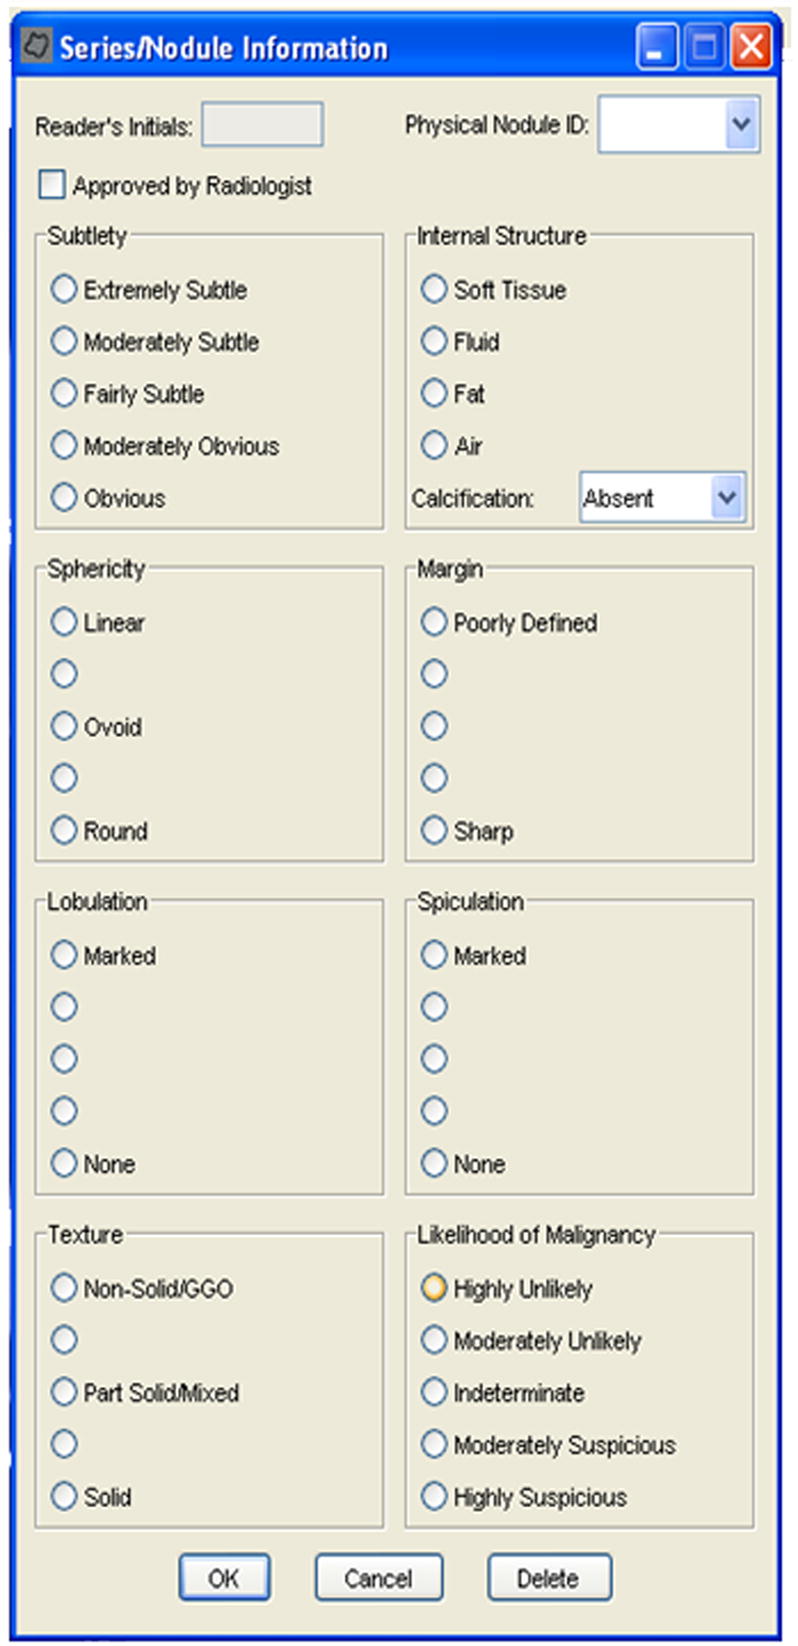
This figure shows an example implemtation of the user interface where the radiologist was to provide the subjective assessment of the nodule’s characteristics. Note that this was only used for nodules ≥ 3mm.
When this reading phase is completed, the results of each reader’s Unblinded Read are compiled into a standardized format (see below) and then sent to the Requesting Site. The results of the Unblinded Read are collected from all four Servicing Sites and then sent on to the National Cancer Insitute’s Image Archive (NCIA) for entry into the publically available database. It should be noted that when all four Unblinded Read results are available, they can be compared to determine: (a) how many radiologists detected each nodule (which can be used to determine an objective measure of subtlety) and (b) the variation of contours between readers (as described in [15]).
IMPLEMENTATION AND INFRASTRUCTURE
Prequisites
IRB approval was obtained for each institution that allowed for the inclusion of anonymized data in the LIDC database. The inclusion criteria for patients, nodules and acceptable CT scan technical parameters and image quality were specified [7]. All subjective assessment categories and vocabulary terms were defined, as well as how to code the responses in a standardized fashion.
Anonymization of CT image data
For each scan submitted for LIDC review and inclusion in the public database, the Requesting Site managed the anoymization of the scan. This involved removing protected health information (PHI) and any site identifiers from the original DICOM image files. To comply with the DICOM standard, fields were either replaced with anonymized values, set to NULL or removed completely, depending on the DICOM type of the field being anonymized. For example, patient name and identifiers were replaced with LIDC-assigned values, while patient birth date was set to NULL. Certain fields, such as study date, were handled in such a way as to preserve temporal information without retaining any of the original information. For a patient with multiple studies, the date of the first study was arbitrarily set to January 1, 2000, and any subsequent scans were assigned dates offset from January 1, 2000 (i.e. either before or after January 1, 2000) so that they preserved the actual time interval from the original study. In this way actual dates were removed, while preserving the relevant time offset information. This anonymization was performed at each site and tested among the LIDC sites for compliance.
XML-based specification of annotations
To support the data collection process, the LIDC developed a portable and interchangeable file format implemented in XML. The XML schema was designed to unambiguously represent the results of all readers’ reviews of each CT. Each XML file contains information about:
the CT being reviewed ( instance UID)
the type of reading session (blinded or unblinded)
reader id
results from the reading session, where a reading session consists of a set of annotations placed by a single reader during a single phase
-
for each nodule ≥ 3 mm marked by a reader, both the nodule characteristics and the complete volumetric boundary are reported in the following manner:
nodule id – a unique id for the nodule marked by this reader
the radiologist-assessed characteristics of the nodule
-
the 3D volumetric boundary is completely defined by a of 2D regions of interest (ROIs) for each slice in the nodule:
the overall format is to report each ROI z-position (longitudinal direction) on which the nodule is visualized and the x- and y-coordinates of the connected boundary points within each x-y plane which define the ROI.
radiologists could describe regions of exclusion (primarily regions of air within a nodule), where the exclusion ROIs are subtracted from the nodule .
-
For each nodule < 3 mm marked by this reader, ONLY a single point is reported:
a nodule id – a unique id for the nodule marked by this reader
Nodule Contour ROI – For nodules < 3 mm, this will consist of a single (x,y,z) position that represents the approximate centroid of that nodule
-
For each non-nodule ≥ 3 mm marked by this reader, ONLY a single point is reported. The data for non-nodules ≥ 3mm are similar to data recorded for nodules < 3 mm, but can be uniquely identified by a code within the XML file. This description uses data structures similar to the nodules described above:
a non-nodule id – a unique id for the non-nodule marked by this reader
location - this also consists of a single position (x,y,z) that represents the centroid point of the non-nodule marked by the reader.
The complete specification for the XML file is described by its schema and documentation, which can be found on the NCIA website (see http://ncia.nci.nih.gov/collections/ for more details and documentation).
Messaging System
To faciltiate the decentralized communication system, the LIDC used this XML file format for several purposes: (a) blinded read request messages from a Requesting Site to each Servicing Site, (b) blinded read response messages from each Servicing Site back to the Requesting Site, (c) unblinded read request messages to the Servicing Sites and (d) unblinded read response messages back to the Requesting Site. For each of these messages, the XML schema described above was used with different values in key fields (such as request type). For the blinded read request, there is no existing reading information (i.e., no information about nodule contours, etc.); therefore the request message consisted of information about the CT scan only. For the blinded read response, the message contains the information about the CT scan, reader and all annotations.
For the unblinded read request, information about the CT scan as well as the compiled blinded read responses are contained within the request file. This message contains all of the information necessary for the annotation tools (as described below) to display the results of the blinded reads, which are required to perform the unblinded reading.
For the unblinded read response, the contents of the file were similar in design to the results of the blinded read response – the results of only one reader’s annotations. This response file was sent back to the Requesting Site and compiled with other unblinded read responses. It is the compiled results from the unblinded read responses that are the basis for the XML files distributed to the NCI for release as part of the publicly available database.
Software Tools for Annotation
Software tools for image review and marking were developed based on non-commercial, existing software packages. One of these employed purely manual tracing of nodules, while two others employed semi-automated approaches in defining nodule boundaries.
Each of the three systems met the same LIDC internal specifications. These specifications included the ability to read in and display CT imaging studies, basic image manipulation functions (window/level, zoom, pan, cine view) and other important functions such as viewing DICOM headers to verify technical parameters (such as slice thickness, etc.). Other components of the specification included:
tools to draw, visualize and edit nodule boundaries, whether manual, semi-automated or fully automated
the ability to create a region of interest (ROI) for each nodule ≥ 3 mm from boundary tracings generated from the annotation tools described in (a),
tools to mark the approximate centroid of an object (for any nodule < 3 mm and non-nodules ≥ 3 mm),
the ability to read in and display ROIs drawn by other radiologists at other institutions (for unblinded reads).
RESULTS
This two-phase data collection process was designed, tested and implemented at all five LIDC sites. This process has been used by the LIDC for over 500 CT scans to date. Currently, approximately 100 scans are publicly available, with the remaining scans to be made public in the near future. Each CT scan has been reviewed and marked by four readers using this blinded and unblinded review model. Currently, the image data and XML files that contain the unblinded read results from all four readers are publicly available from the NCIA Archives (http://ncia.nci.nih.gov) under the LIDC collection.
CONCLUSION
To date, the LIDC has created a publicly available database of approximately 100 thoracic CT scans that have been marked for the location and spatial extent of lung nodules. Each scan was reviewed by four radiologists, each at a different institution. The marking process involved contouring nodules ≥ 3 mm in diameter, marking the centroid of nodules < 3 mm in diameter and also marking other objects (labeled as non-nodules) that were ≥ 3 mm in diameter, but that were not considered to be lung nodules. To establish this database, the LIDC created a unique two-phase data collection process as well as the infrastructure to support that data collection process; the effectiveness of this type of reading model has been shown in previous work [23]. The data collection process has been designed, tested and implemented; it has been used for the annotation of all scans that are included in the NCIA image archive. This data collection process will continue to be used by the LIDC, and approximately 1000 scans will ultimately be collected through the LIDC and related efforts. Currently, image data and XML files containing the annotations of each reader are available at that website. In the near future, other information such as probability maps (or pmaps) (as described in [15]), pathological diagnosis (whenever available) and other information will be available as well.
Acknowledgments
The authors would like to acknowledge the support of the National Cancer Institute’s Cancer Imaging Program and the following grants:
▪U01CA091103 (UCLA)
▪U01CA091085 (U Iowa)
▪U01CA091100 (Cornell)
▪U01CA091099 (U. Michigan)
▪U01CA091090 (U. Chicago)
Footnotes
Publisher's Disclaimer: This is a PDF file of an unedited manuscript that has been accepted for publication. As a service to our customers we are providing this early version of the manuscript. The manuscript will undergo copyediting, typesetting, and review of the resulting proof before it is published in its final citable form. Please note that during the production process errors may be discovered which could affect the content, and all legal disclaimers that apply to the journal pertain.
References
- 1.International Early Lung Cancer Action Program Investigators. Henschke CI, Yankelevitz DF, Libby DM, Pasmantier MW, Smith JP, Miettinen OS. Survival of patients with stage I lung cancer detected on CT screening. N Engl J Med. 2006 Oct 26;355(17):1763–71. doi: 10.1056/NEJMoa060476. [DOI] [PubMed] [Google Scholar]
- 2.Swensen SJ, Jett JR, Hartman TE, Midthun DE, Mandrekar SJ, Hillman SL, Sykes AM, Aughenbaugh GL, Bungum AO, Allen KL. CT screening for lung cancer: five-year prospective experience. Radiology. 2005 Apr;235(1):259–65. doi: 10.1148/radiol.2351041662. [DOI] [PubMed] [Google Scholar]
- 3.Zhao B, Schwartz LH, Moskowitz CS, Ginsberg MS, Rizvi NA, Kris MG. Lung cancer: computerized quantification of tumor response--initial results. Radiology. 2006 Dec;241(3):892–8. doi: 10.1148/radiol.2413051887. [DOI] [PubMed] [Google Scholar]
- 4.Swensen SJ, Viggiano RW, Midthun DE, Muller NL, Sherrick A, Yamashita K, Naidich DP, Patz EF, Hartman TE, Muhm JR, Weaver AL. Lung nodule enhancement at CT: multicenter study. Radiology. 2000 Jan;214(1):73–80. doi: 10.1148/radiology.214.1.r00ja1473. [DOI] [PubMed] [Google Scholar]
- 5.Petkovska I, Shah SK, McNitt-Gray MF, Goldin JG, Brown MS, Kim HJ, Brown K, Aberle DR. Pulmonary nodule characterization: a comparison of conventional with quantitative and visual semi-quantitative analyses using contrast enhancement maps. Eur J Radiol. 2006 Aug;59(2):244–52. doi: 10.1016/j.ejrad.2006.03.005. [DOI] [PMC free article] [PubMed] [Google Scholar]
- 6.Shah SK, McNitt-Gray MF, Rogers SR, Goldin JG, Suh RD, Sayre JW, Petkovska I, Kim HJ, Aberle DR. Computer aided characterization of the solitary pulmonary nodule using volumetric and contrast enhancement features. Acad Radiol. 2005 Oct;12(10):1310–9. doi: 10.1016/j.acra.2005.06.005. [DOI] [PubMed] [Google Scholar]
- 7.Armato SG, 3rd, McLennan G, McNitt-Gray MF, Meyer CR, Yankelevitz D, Aberle DR, Henschke CI, Hoffman EA, Kazerooni EA, MacMahon H, Reeves AP, Croft BY, Clarke LP Lung Image Database Consortium Research Group. Lung image database consortium: developing a resource for the medical imaging research community. Radiology. 2004 Sep;232(3):739–48. doi: 10.1148/radiol.2323032035. [DOI] [PubMed] [Google Scholar]
- 8.Clarke LP, Croft BY, Staab E, Baker H, Sullivan DC. National Cancer Institute initiative: Lung image database resource for imaging research. Acad Radiol. 2001 May;8(5):447–50. doi: 10.1016/S1076-6332(03)80555-X. [DOI] [PubMed] [Google Scholar]
- 9.Dodd LE, Wagner RF, Armato SG, 3rd, McNitt-Gray MF, Beiden S, Chan HP, Gur D, McLennan G, Metz CE, Petrick N, Sahiner B, Sayre J Lung Image Database Consortium Research Group. Assessment methodologies and statistical issues for computer-aided diagnosis of lung nodules in computed tomography: contemporary research topics relevant to the lung image database consortium. Acad Radiol. 2004 Apr;11(4):462–75. doi: 10.1016/s1076-6332(03)00814-6. [DOI] [PubMed] [Google Scholar]
- 10.Nishikawa RM, Yarusso LM. Variations in measured performance of CAD schemes due to database composition and scoring protocol. Proc SPIE. 1998;3338:840–844. [Google Scholar]
- 11.Rogers SR, Brown MS, Goldin JG, Suh R, Kim H, Aberle DR. RSNA. 2002. Automated Lung Nodule Detection in CT: Nodule Inclusion Criteria for Determining Ground Truth. abs. [Google Scholar]
- 12.Wormanns D, Ludwig K, Beyer F, Heindel W, Diederich S. Detection of pulmonary nodules at multirow-detector CT: Effectiveness of double reading to improve sensitivity at standard-dose and low-dose chest CT. European Radiology. 2005;15:14–22. doi: 10.1007/s00330-004-2527-6. [DOI] [PubMed] [Google Scholar]
- 13.Leader JK, Warfel TE, Fuhrman CR, et al. Pulmonary nodule detection with low-dose CT of the lung: Agreement among radiologists. American Journal of Roentgenology. 2005;185:973–978. doi: 10.2214/AJR.04.1225. [DOI] [PubMed] [Google Scholar]
- 14.Novak CL, Qian J, Fan L, et al. Inter-observer variations on interpretation of multislice CT lung cancer screening studies, and the implications for computer-aided diagnosis. SPIE Proceedings. 2002;4684:68–79. [Google Scholar]
- 15.Meyer CR, Johnson TD, McLennan G, Aberle DR, Kazerooni EA, MacMahon H, Mullan BF, Yankelevitz DF, van Beek EJ, Armato SG, 3rd, McNitt-Gray MF, Reeves AP, Gur D, Henschke CI, Hoffman EA, Bland PH, Laderach G, Pais R, Qing D, Piker C, Guo J, Starkey A, Max D, Croft BY, Clarke LP. Evaluation of lung MDCT nodule annotation across radiologists and methods. Acad Radiol. 2006 Oct;13(10):1254–65. doi: 10.1016/j.acra.2006.07.012. [DOI] [PMC free article] [PubMed] [Google Scholar]
- 16.Erasmus JJ, Gladish GW, Broemeling L, et al. Interobserver and intraobserver variability in measurement of non-small-cell carcinoma lung lesions: implications for assessment of tumor response. J Clin Oncol. 2003;21:2574–2582. doi: 10.1200/JCO.2003.01.144. [DOI] [PubMed] [Google Scholar]
- 17.Schwartz LH, Ginsberg MS, DeCorato D, et al. Evaluation of tumor measurements in oncology: use of film-based and electronic techniques. J Clin Oncol. 2000;18:2179–2184. doi: 10.1200/JCO.2000.18.10.2179. [DOI] [PubMed] [Google Scholar]
- 18.Tran LN, Brown MS, Goldin JG, et al. Comparison of treatment response classifications between unidimensional, bidimensional, and volumetric measurements of metastatic lung lesions on chest computed tomography. Acad Radiol. 2004;11:1355–1360. doi: 10.1016/j.acra.2004.09.004. [DOI] [PubMed] [Google Scholar]
- 19.Judy PF, Koelblinger C, Stuermer C, et al. Reliability of size measurements of patient and phantom nodules on low-dose CT, lung-cancer screening. Radiology. 2002;225(Suppl S):497–497. [Google Scholar]
- 20.Hopper KD, Kasales CJ, Van Slyke MA, Schwartz TA, TenHave TR, Jozefiak JA. Analysis of interobserver and intraobserver variability in CT tumor measurements. AJR Am J Roentgenol. 1996;167:851–854. doi: 10.2214/ajr.167.4.8819370. [DOI] [PubMed] [Google Scholar]
- 21.Goodman LR, Gulsun M, Washington L, Nagy PG, Piacsek KLM. Inherent Variability of CT Lung Nodule Measurements In Vivo Using Semiautomated Volumetric Measurements. AJR. 2006;186:989–994. doi: 10.2214/AJR.04.1821. [DOI] [PubMed] [Google Scholar]
- 22.Armato SG, Starkey A, MacMahon H, McLennan G, Yankelevitz D, McNitt-Gray M, et al. Toward a Definition of Lung Nodule: A Visual Nodule Library Resource. Radiology. 2004;233 P abstract. [Google Scholar]
- 23.Hillman BJ, Hessel SJ, Swensson RG, Herman PG. Improving diagnostic accuracy: a comparison of interactive and Delphi consultations. Invest Radiol. 1977;12(2):112–5. doi: 10.1097/00004424-197703000-00002. [DOI] [PubMed] [Google Scholar]