Abstract
The ubiquity of sexual reproduction despite its cost has lead to an extensive body of research on the evolution and maintenance of sexual reproduction. Previous work has suggested that sexual reproduction can substantially speed up the rate of adaptation in diploid populations, because sexual populations are able to produce the fittest homozygous genotype by segregation and mating of heterozygous individuals. In contrast, asexual populations must wait for two rare mutational events, one producing a heterozygous carrier and the second converting a heterozygous to a homozygous carrier, before a beneficial mutation can become fixed. By avoiding this additional waiting time, it was shown that the benefits of segregation could overcome a twofold cost of sex. This previous result ignores mitotic recombination (MR), however. Here, we show that MR significantly hastens the spread of beneficial mutations in asexual populations. Indeed, given empirical data on MR, we find that adaptation in asexual populations proceeds as fast as that in sexual populations, especially when beneficial alleles are partially recessive. We conclude that asexual populations can gain most of the benefit of segregation through MR while avoiding the costs associated with sexual reproduction.
Keywords: segregation, mitotic recombination, model, waiting times
1. Introduction
Most eukaryotes are facultatively or obligately sexual (Bell 1982; Chasnov 2000), and many prokaryotes are also capable of genetic exchange through conjugation, transduction and transformation (Redfield 2001; Xu 2004). This observation is puzzling, however, considering the substantial costs of sexual reproduction. Sexual individuals contribute only half as many genes to each offspring as do asexual individuals, a disadvantage known as the twofold cost of meiosis. Furthermore, sexual organisms need to expend the time and energy to find and court a mate, and they risk disease transmission and predation during mating. Considering the high costs of sex, its ubiquity is one of the most studied and intriguing problems in evolutionary biology (Bell 1982; Barton & Charlesworth 1998; Otto & Lenormand 2002).
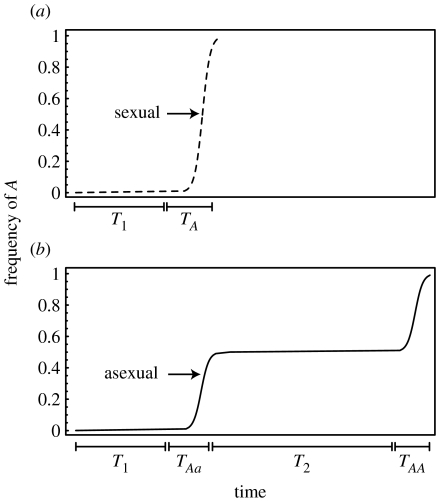
Individuals that survive to reproductive age have combinations of genes that function in the current environment. By breaking apart these gene combinations, parents that reproduce sexually also risk producing less-fit offspring. There are, however, certain circumstances under which genetic mixing can increase the fitness of an individual's descendants. Kirkpatrick & Jenkins (1989) identified one such circumstance. When a beneficial allele (A) appears by mutation within an asexual diploid population carrying the resident allele (a), the beneficial allele will rise in frequency and fix in the heterozygous state (Aa) until a second mutation converts the allele on the homologous chromosome from a to A. In this case, sexual reproduction can bring together beneficial alleles carried by different chromosomes into the same individual, creating the AA homozygote via segregation and union of gametes. They showed that after waiting for the appearance of a beneficial mutation (first time lag, T1), the frequency of the beneficial allele increases and approaches fixation at a rate determined by the selection coefficient and population size in sexual populations (figure 1a). In asexual populations, however, there is also a second time lag (T2), during which the population is fixed at the heterozygous stage (figure 1b). Based on Kirkpatrick & Jenkins' (1989) model, the benefits of segregation alone can overcome a twofold cost of sexual reproduction by eliminating the second time lag, as long as the number of loci witnessing beneficial mutations is sufficiently large. Several additional studies have examined the advantages of segregation in other settings, for example, asking how segregation affects genetic load (Chasnov 2000; Agrawal & Chasnov 2001), Muller's ratchet (Antezana & Hudson 1997a,b), Red Queen dynamics (Galvani et al. 2003; Agrawal & Otto 2006) and the spread of modifier alleles altering the frequency of sex (Uyenoyama & Bengtsson 1989; Antezana & Hudson 1997b; Dolgin & Otto 2003; Otto 2003). Here, we return to Kirkpatrick & Jenkins' (1989) original question: how does sex with the attendant segregation of chromosomes affect the rate of adaptation?
Figure 1.
Spread of a beneficial mutation in a diploid (a) sexual and (b) asexual population as a function of time. T1 and T2 are the first and second time lags, respectively. TAa and TAA are the times to fixation of the heterozygotes (Aa) and homozygotes (AA) within an asexual population after these genotypes appear and survive stochastic loss while rare. TA is the time to fixation of the A allele in a sexual population, assuming that the allele has survived stochastic loss.
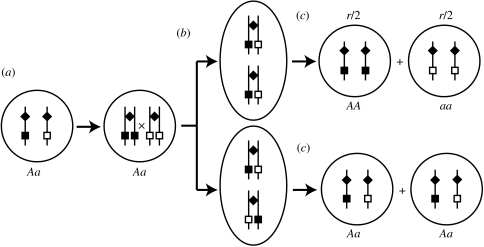
The analysis of Kirkpatrick & Jenkins (1989) assumes that the only mechanisms generating homozygotes are mutation and sex. Although generally ignored in population genetic models, mitotic recombination (MR) could potentially have a large influence on the evolution of diploid asexual populations. In both yeast and vertebrate cells, MR has been shown to be an important mechanism for the repair of double strand breaks and other DNA replication errors via homologous recombination (Tischfield 1997; Aguilera et al. 2000; Prado et al. 2003). By generating homozygotes from heterozygotes (figure 2), MR could also hasten the spread of beneficial alleles within asexual populations.
Figure 2.
Mitotic recombination can result in the loss of heterozygosity at a particular locus. Alleles A and a are represented by black and white boxes, respectively; the diamond marks the centromere on the chromosome. (a) A cell with genotype Aa replicates its DNA. (b) Mitotic recombination occurs between homologous chromosomes. (c) Depending on the alignment of chromosomes, mitotic recombination can lead to the loss of heterozygosity (AA and aa; top half) or restore heterozygosity (Aa; bottom half). We count only those mitotic recombination events resulting in loss of heterozygosity (top half), which occur at rate r.
Using a one-locus diploid model, we investigate the effect of MR on the spread of beneficial alleles. We show that MR occurring at rates consistent with existing data has a substantial effect on the speed of adaptation of asexual populations. Ignoring MR greatly exaggerates the fitness benefits of sexual reproduction.
(a) Mitotic recombination rates
Since the centromere acts as an anchor point ensuring that sister chromatids attach to spindles and separate properly during mitosis, the further a locus is from the centromere, the more probable it is to recombine away from the attachment point of the spindles and exhibit a loss of heterozygosity (Yuan & Keil 1990; Burke et al. 2000). Factors such as presence of hot and cold spots of recombination and chromatin structure are also thought to influence the rate of MR (Aguilera et al. 2000).
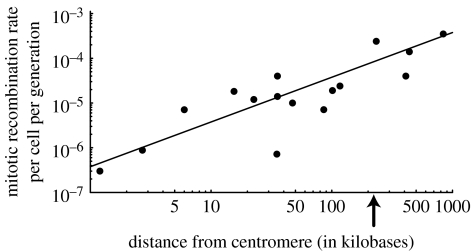
Most of the data regarding MR rates are based on studies in Saccharomyces cerevisiae (table 1). The data exhibit a nearly linear relationship between the rate of MR and distance to the centromere (figure 3). Since the average distance to the centromere is approximately 224 kb in S. cerevisiae (based on the length and centromere position of each chromosome; Saccharomyces genome database: http://www.yeastgenome.org), the regression predicts an average rate of MR of approximately 0.8×10⁻⁴ per cell per generation in S. cerevisiae.
Table 1.
MR rate as a function of distance of the midpoint of a gene to the midpoint of the centromere in S. cerevisiae with corresponding 95% confidence intervals.
| gene | distance from centromere (kb) | MR rate (cells per generation×106) | 95% CI (cells per generation×106) | reference |
|---|---|---|---|---|
| ura3 (artificial constrcuct) | 1.2 | 0.30 | 0.00–0.44 | Yuan & Keil (1990) |
| 2.7 | 0.88 | 0.00–2.28 | Yuan & Keil (1990) | |
| 6.0 | 7.08 | 1.16–11.82 | Yuan & Keil (1990) | |
| 15.5 | 18.2 | 12.34–48.54 | Yuan & Keil (1990) | |
| ura3 | 35.5a | 20–60 | not available | Puig et al. (2000) |
| lys2 | 233.6a | 240 | 160–320 | Esposito et al. (1994) |
| arg4 | 35.1a | 0.72 | 0.49–1.48 | Maloney & Fogel (1980) |
| ade6 | 116.9a | 24.0 | 0–64 | Boram & Roman (1976) |
| ade3 | 410.4a | 40 | 32–48 | Thornton & Johnston (1971) |
| ade5,7 | 439.3a | 140 | 60–220 | Thornton & Johnston (1971) |
| ade8 | 838.8a | 350 | 280–420 | Thornton & Johnston (1971) |
| leu2 | 22.6a | 12 | not available | Lichten & Haber (1989) |
| his4 | 47.3a | 10 | not available | Lichten & Haber (1989) |
| hml | 101.3a | 19 | not available | Lichten & Haber (1989) |
| mat | 85.8a | 7.1 | not available | Lichten & Haber (1989) |
| ura3 | 35.5a | 14 | not available | Lichten & Haber (1989) |
Physical location obtained from the S. cerevisiae database (http://www.yeastgenome.org/).
Figure 3.
The observed rate of mitotic recombination rises as a function of the distance to the centromere (data from table 1). The arrow marks the average distance to the centromere across the entire genome of S. cerevisiae. The mitotic recombination rate, r, given by the best linear fit to the untransformed data was r≈3.8×10⁻⁷δ (significance of slope p<0.0001), where δ is the distance to the centromere in kilobases. (The regression was fitted through the data on a linear–linear scale with an intercept forced through zero. Allowing the intercept to vary yields similar results.)
2. Model
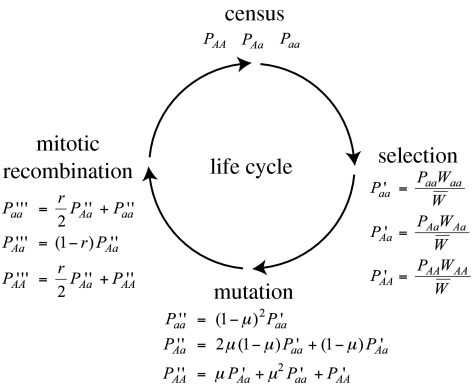
We develop a population genetic model to study the impact of such levels of MR on the spread of a beneficial allele in diploid asexual and sexual populations. We assume a finite diploid population of N unicellular individuals with non-overlapping generations. We measure the rate of adaptation in sexual versus asexual populations that are in isolation of one another (see Wiener et al. (1992) for a study that considers the advantages of segregation in directly competing sexual and asexual populations). We focus on selection at a single locus, where a is the resident allele and A is an invading beneficial allele. The three different genotypes aa, Aa and AA occur in frequencies Paa, PAa and PAA and have fitness values of 1, 1+hs and 1+s, respectively, where s is the selective coefficient of allele A (s>0) and h is the dominance coefficient (0<h<1). Each generation, allele a mutates to A at a rate μ. Back mutations from A to a slow the spread of allele A, but this effect is negligible until allele A is nearly fixed (assuming that the mutation rate is small relative to the strength of selection). We thus ignore back mutations. In heterozygous asexuals, MR generates homozygotes at rate r, half of which are aa and half AA (figure 2). In sexuals, we assume random mating among gametes. The excess homozygosity generated by MR within the sexual population is immediately destroyed by segregation and syngamy and can be ignored. Using the life cycles shown in figure 4, recursion equations describing the change in genotype frequency were developed.
Figure 4.
Life cycle of an asexual population with selection, mutation and mitotic recombination.
In the electronic supplementary material, these recursion equations are used to derive the total waiting time until fixation of a beneficial allele A that is initially absent within an asexual (Tasexual) or sexual population (Tsexual). These equations can be used to explore the influence of varying parameters on the waiting times. For example, we graphically explored the sensitivity of the waiting time to changes in population size and dominance coefficients across a range of parameters: N varied from 104 to 108, r varied from 10−10 to 10−4, h varied from 0.01 to 0.99, s varied from 0.01 to 0.1, and μ set such that mutations were either rare within the population, Nμ=1/10, or plentiful, Nμ=10 (figures available upon request). In both asexual and sexual populations, increasing the population size tends to shorten the waiting times when new genotypes are rarely produced (Nμ≪0 and Nr≪0), because larger populations produce more mutants and recombinants. Conversely, increasing the population size lengthens the waiting times when mutations are plentiful, because it takes longer for rare alleles to reach high frequency in large populations. The waiting times are typically shortest when dominance levels are intermediate; with low or high values of h, the beneficial allele spreads slowly when it is rare or when it is common, respectively, and the overall waiting times are prolonged. Furthermore, it is possible to show analytically that, as expected, increasing the rate of MR in asexual populations always decreases the waiting time until fixation of A (dTasexual/dr<0).
We next ask how much MR is needed to reduce the lag experienced by asexual populations by a factor c, by solving the following equation for r:
| (2.1) |
Assuming that selection is weak and the population size is large (Ns≫1) and measuring the waiting time until a single copy of allele a remains in the population, we find that the rate of MR must be greater than:
| (2.2) |
where we have kept only leading order terms. Equation (2.2) exhibits two regimes. When the population size is small and/or the mutation rate is low (Nμ less than approximately 1/100), the appearance of mutations limits the rate of adaptation, and equation (2.2) approaches rc=2μ(1−c)/c. In this regime, the advantage of sex is halved (c=0.5) by a MR rate that is twice the mutation rate. The advantage of sex is even more dramatically reduced by higher rates of MR (e.g. a MR rate that is 100 times the mutation rate reduces the advantage of sex to only 2% of its value when MR is absent). In the second regime (Nμ>1/100), waiting times are shorter and depend less on the mode of reproduction, so that MR has to be more prevalent to have a major impact. Even then, MR halves the advantage of sexual reproduction when h=1/2 as long as r is greater than .
In summary, when the waiting time to fix beneficial alleles is long, MR dramatically reduces the advantage of sexual reproduction. When the waiting time is short, MR has a more modest effect, but then there is little difference between sexuals and asexuals in the speed of adaptation.
(a) Stochastic simulations
To test the accuracy of these results, we used the Wright–Fisher model to perform stochastic simulations of the recursions in figure 4. Specifically, Mathematica (Wolfram 1991) was used to sample with replacement N individuals from the genotypic frequencies of offspring expected from the parental generation (figure 4), after which point all parents died. The population was initially fixed for the aa genotype, and the frequency of the beneficial allele A was measured as a function of time until it reached a frequency ≥0.99, at which point the allele was considered fixed. The time until fixation was averaged over 2000 replicate simulations.
The parameters used in the simulations were μ=10−7, N=105, varying values of r (0, 10−9, 10−8, 10−7, 10−6, 10−5, 10−4), varying values of h (0.1, 0.5, 0.9) and varying values of s (0.1, 0.05, 0.01).
3. Results
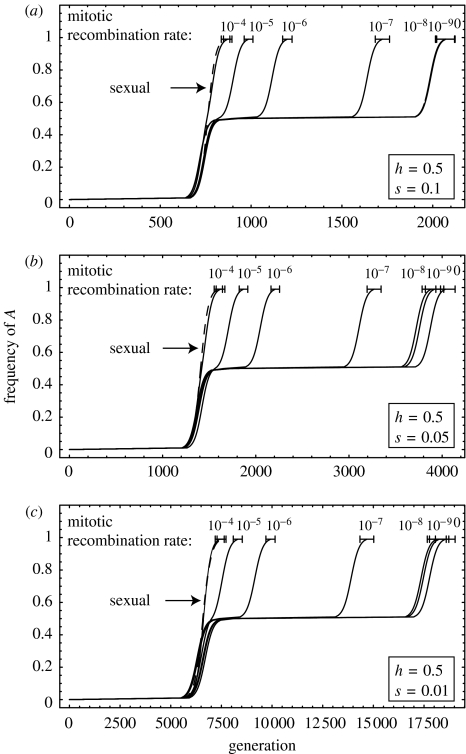
Mitotic recombination dramatically reduces the time to fix beneficial alleles within an asexual population, while having no influence on the fixation time in a sexual population that is unicellular and randomly mating. Based on the stochastic simulations, figure 5 shows the average time that it took for the A allele to reach a given frequency. As expected from our analysis, the fixation times for sexual (dashed) and asexual (solid) populations are similar when MR is much more common than mutation (MR rates of 10−5 per cell per generation or higher compared to the mutation rate of 10−7). Conversely, MR had a negligible influence when it occurred at a frequency much lower than the mutation rate (the fixation times with MR rates of 10−8, 10−9 and 0 were not significantly different in the asexual populations).
Figure 5.
Spread of a beneficial allele as a function of time for different values of mitotic recombination in sexual (dashed) and asexual (solid) populations. The value above each trajectory corresponds to the rate of mitotic recombination. Each trajectory describes the time taken for the allele frequency to first rise above 0.01, 0.02, 0.03, …, 0.99, averaged across 2000 stochastic simulations with (a) s=0.1, (b) s=0.05 and (c) s=0.01. The bars represent 95% confidence intervals for the fixation time. Other parameters: h=1/2, μ=10−7, N=105.
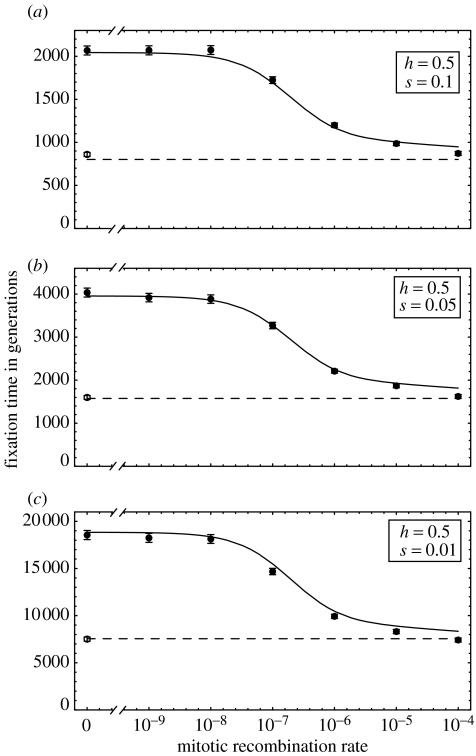
Figure 6 compares the average time to fixation observed in simulations to the time predicted by the electronic supplementary material equations (A 14) and (A 15). In general, the fixation times are in very close agreement. Within the asexual populations, a small discrepancy arises for high MR rates because the AA genotype tends to appear while Aa is still reasonably rare, making electronic supplementary material equation (A 4) an inaccurate measure of the fitness advantage of AA when it first appears. A more accurate approximation can be made by replacing electronic supplementary material equation (A 4) with the fitness of AA relative to the mean fitness in the population at the time when the first successful AA appears (available upon request).
Figure 6.
Fixation time of the beneficial allele as a function of mitotic recombination for selection coefficients of (a) 0.1, (b) 0.05 and (c) 0.01. Using electronic supplementary material equation (A 4) for σ, electronic supplementary material equations (A 14) and (A 15) were used to predict the time to fixation in an asexual (solid curve) and sexual (dashed) population, respectively. The circles give the simulated fixation times in sexual (hollow) and asexual (filled) populations based on 2000 replicates; the bars represent 95% confidence intervals. Other parameters: h=1/2, μ=10−7, N=105.
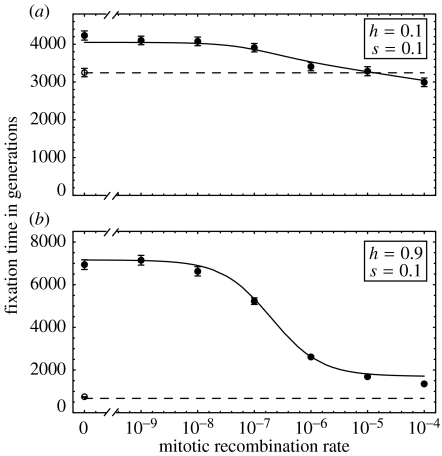
Figure 7 explores the influence of dominance on the average fixation time. When beneficial alleles are partially recessive (h<1/2), the first time lag becomes substantially longer, because the beneficial allele is more likely to be lost by chance after it first appears. Conversely, the second time lag becomes shorter, because AA individuals are much fitter than Aa individuals for partially recessive beneficial alleles, increasing the probability of establishment of the AA genotype. Since selection reduces the second time lag for partially recessive mutations, there is less of a difference between the fixation times of asexual and sexual populations, regardless of the rate of MR (figure 7a). For partially dominant beneficial mutations, these conclusions are reversed. The second time lag becomes disproportionately longer than the first time lag, and asexual populations evolve at a much slower rate when MR rates are low. Once again, however, the rates at which asexual and sexual populations fix adaptive alleles converge as MR rates approach the average level observed in yeast (approx. 10−4 per cell per generation).
Figure 7.
Fixation time of the beneficial allele as a function of mitotic recombination for dominance coefficients of (a) 0.1 and (b) 0.9. Using electronic supplementary material equation (A 4) for σ, electronic supplementary material equations (A 14) and (A 15) were used to predict the time to fixation in an asexual (solid curve) and sexual (dashed) population, respectively. The circles give the simulated fixation times in sexual (hollow) and asexual (filled) populations based on 2000 replicates; the bars represent 95% confidence intervals. Other parameters: s=0.1, μ=10−7, N=105.
Interestingly, for very high rates of MR, figure 7a suggests that asexual populations might adapt even faster than sexual populations. This occurs because the homozygous genotype, AA, is generated early on in the process and selection acts most efficiently on the homozygotes, whose fitness difference is greatest. Indeed, once the rate of MR, r, approaches the selective advantage of heterozygotes, hs, MR makes it even more likely that the A allele will become established when it first appears, raising the probability of fixation above 2hs (because AA individuals are produced by MR while the A allele is still rare and are preserved by asexual reproduction). Consequently, high rates of MR reduce the first time lag, T1, until the first successful mutation appears and establishes within the population. That asexuals could adapt faster than sexuals was confirmed by simulations with r=10−2 (other parameters: μ=10−7, N=105, s=0.1, h=0.1, 0.5, 0.9).
4. Discussion
Using a one-locus diploid model, we find that mitotic recombination significantly speeds up the spread of beneficial mutations within asexual populations. MR in asexuals acts in a similar manner to chromosomal segregation and mating during sexual reproduction, in that beneficial alleles initially present on only one homologous chromosome can be passed to both of the homologous chromosomes of an offspring. By increasing homozygosity, MR acts to improve the efficiency of selection within asexual populations subject to directional selection. The same is true of deleterious alleles, which can then be purged by selection.
Both the approximate analytical results and the stochastic simulations predict that the time to fixation of a beneficial allele will be similar in sexuals and asexuals once MR rates rise much above the mutation rate (μ=10−7 in the simulations). Given data from S. cerevisiae suggesting an average MR rate of approximately 0.8×10⁻⁴ per cell per generation, our results indicate that the stochastic lag experienced by asexual populations due to the requirement that both heterozygous and homozygous individuals must be produced is negligible. Whether such rates of MR are typical in other species remains to be seen. High rates of MR (ranging from 10−5 per cell per generation for markers near a centromere to 10−2 for distal markers) have also been observed in the asexual fungus Aspergillus niger (Debets et al. 1993). Data from animals further suggest that MR rates per individual generation are in line with these estimates from fungi. A recent analysis of microsatellite loci in asexual Daphnia (Omilian et al. 2006) observed high rates of loss of heterozygosity (1.2×10⁻⁴ per generation, on average). In fibroblast cells sampled from the ears of adult mice that were initially heterozygous at the Aprt locus, the median frequency of one type of homozygote was 1.2×10⁻⁴; in 80% of cases examined, this loss of heterozygosity was due to MR (Holt et al. 1999). Similarly, among leukocytes sampled from adult humans, the median frequency of either type of homozygote at the HLA-A locus was 5.8×10⁻⁶ (Shao et al. 1999). Contributing to the difference between these two frequencies, Aprt lies further from its centromere (125MB) than HLA-A (30MB) (http://www.ncbi.nlm.nih.gov). These estimates suggest that the probability that a heterozygous zygote produces a homozygous cell at the end of development is of the order needed to hasten the spread and fixation of beneficial alleles within asexual populations.
In conclusion, current data suggest that MR occurs frequently enough to be an important factor in the spread of beneficial alleles in asexuals. The contribution of MR has been neglected in most previous population genetic models of asexuals (for an exception, see Krafzig et al. (1993), who consider the equilibrium between MR and mutation or heterozygous advantage). Here, we have taken the first step towards a theory of adaptation in asexuals that accounts for this important phenomenon. Our analysis indicates that, owing to MR, diploid asexuals are not likely to experience a substantial lag between the appearance of a beneficial mutation in a heterozygote and the production of a mutant homozygote. MR might thus facilitate the persistence of diploid asexuals. (MR does not, however, allow alleles carried by different individuals to be mixed, another problem faced by asexuals; Bell 1982; Barton & Charlesworth 1998; Otto & Lenormand 2002). In future studies, it would be interesting to measure MR rates across a range of organisms with different reproductive modes and investigate if higher MR rates occur among organisms that are predominantly asexual.
Acknowledgments
Our special thanks go to Alex Grant, whose initial work on this subject inspired this study. We gratefully acknowledge comments provided by Michael Whitlock on a previous version of this manuscript. This work was supported by the Natural Science and Engineering Research Council of Canada (NSERC) through an Undergraduate Summer Research Award to M.A.M. and a Discovery Grant to S.P.O. and by a sabbatical fellowship to S.P.O. from the National Evolutionary Synthesis Center.
Supplementary Material
Supplementary materials
References
- Agrawal A.F, Chasnov J.R. Recessive mutations and the maintenance of sex in structured populations. Genetics. 2001;158:913–917. doi: 10.1093/genetics/158.2.913. [DOI] [PMC free article] [PubMed] [Google Scholar]
- Agrawal A.F, Otto S.P. Host–parasite coevolution and selection on sex through the effects of segregation. Am. Nat. 2006;168:617–629. doi: 10.1086/508029. doi:10.1086/508029 [DOI] [PubMed] [Google Scholar]
- Aguilera A, Chavez S, Malagon F. Mitotic recombination in yeast: elements controlling its incidence. Yeast. 2000;16:731–754. doi: 10.1002/1097-0061(20000615)16:8<731::AID-YEA586>3.0.CO;2-L. doi:10.1002/1097-0061(20000615)16:8<731::AID-YEA586>3.0.CO;2-L [DOI] [PubMed] [Google Scholar]
- Antezana M, Hudson R.R. Before crossing over: the advantages of eukaryotic sex in genomes lacking chiasmatic recombination. Genet. Res. 1997a;70:7–25. doi: 10.1017/s0016672397002875. doi:10.1017/S0016672397002875 [DOI] [PubMed] [Google Scholar]
- Antezana M, Hudson R.R. Era reversibile! Point mutations, the ratchet, and the initial success of eukaryotic sex: a simulation study. Evol. Theory. 1997b;11:209–235. [Google Scholar]
- Barton N.H, Charlesworth B. Why sex and recombination? Science. 1998;281:1986–1990. doi:10.1126/science.281.5385.1986 [PubMed] [Google Scholar]
- Bell G. University of California Press; Berkeley, CA: 1982. The masterpiece of nature: the evolution and genetics of sexuality. [Google Scholar]
- Boram W.R, Roman H. Recombination in Saccharomyces cerevisiae: a DNA repair mutation associated with elevated mitotic gene conversion. Proc. Natl Acad. Sci. USA. 1976;73:2828–2832. doi: 10.1073/pnas.73.8.2828. doi:10.1073/pnas.73.8.2828 [DOI] [PMC free article] [PubMed] [Google Scholar]
- Burke D, Dawson D, Stearns T. Cold Spring Harbor Laboratory Press; Plainview, NY: 2000. Methods in yeast genetics: a cold spring Harbor laboratory course manual. [Google Scholar]
- Chasnov J.R. Mutation selection balance, dominance and the maintenance of sex. Genetics. 2000;156:1419–1425. doi: 10.1093/genetics/156.3.1419. [DOI] [PMC free article] [PubMed] [Google Scholar]
- Debets F, Swart K, Hoekstra R.F, Bos C.J. Genetic maps of eight linkage groups of Aspergillus niger based on mitotic mapping. Curr. Genet. 1993;23:47–53. doi: 10.1007/BF00336749. doi:10.1007/BF00336749 [DOI] [PubMed] [Google Scholar]
- Dolgin E.S, Otto S.P. Segregation and the evolution of sex under overdominant selection. Genetics. 2003;164:1119–1128. doi: 10.1093/genetics/164.3.1119. [DOI] [PMC free article] [PubMed] [Google Scholar]
- Esposito M.S, Ramirez R.M, Bruschi C.V. Nonrandomly-associated forward mutation and mitotic recombination yield yeast diploids homozygous for recessive mutations. Curr. Genet. 1994;26:302–307. doi: 10.1007/BF00310493. doi:10.1007/BF00310493 [DOI] [PubMed] [Google Scholar]
- Galvani A.P, Coleman R.M, Ferguson N.M. The maintenance of sex in parasites. Proc. R. Soc. B. 2003;270:19–28. doi: 10.1098/rspb.2002.2182. doi:10.1098/rspb.2002.2182 [DOI] [PMC free article] [PubMed] [Google Scholar]
- Holt D, Dreimanis M, Pfeiffer M, Firgaira F, Morley A, Turner D. Interindividual variation in mitotic recombination. Am. J. Hum. Genet. 1999;65:1423–1427. doi: 10.1086/302614. doi:10.1086/302614 [DOI] [PMC free article] [PubMed] [Google Scholar]
- Kirkpatrick M, Jenkins C.D. Genetic segregation and the maintenance of sexual reproduction. Nature. 1989;339:300–301. doi: 10.1038/339300a0. doi:10.1038/339300a0 [DOI] [PubMed] [Google Scholar]
- Krafzig D, Klawonn F, Gutz H. Theoretical analysis of the effects of mitotic crossover in large yeast populations. Yeast. 1993;9:1093–1098. doi: 10.1002/yea.320091008. doi:10.1002/yea.320091008 [DOI] [PubMed] [Google Scholar]
- Lichten M, Haber J.E. Position effects in ectopic and allelic mitotic recombination in Saccharomyces cerevisiae. Genetics. 1989;123:261–268. doi: 10.1093/genetics/123.2.261. [DOI] [PMC free article] [PubMed] [Google Scholar]
- Maloney D.H, Fogel S. Mitotic recombination in yeast—isolation and characterization of mutants with enhanced spontaneous mitotic gene conversion rates. Genetics. 1980;94:825–839. doi: 10.1093/genetics/94.4.825. [DOI] [PMC free article] [PubMed] [Google Scholar]
- Omilian A.R, Cristescu M.E.A, Dudycha J.L, Lynch M. Ameiotic recombination in asexual lineages of Daphnia. Proc. Natl Acad. Sci. USA. 2006;103:18 638–18 643. doi: 10.1073/pnas.0606435103. doi:10.1073/pnas.0606435103 [DOI] [PMC free article] [PubMed] [Google Scholar]
- Otto S.P. The advantages of segregation and the evolution of sex. Genetics. 2003;164:1099–1118. doi: 10.1093/genetics/164.3.1099. [DOI] [PMC free article] [PubMed] [Google Scholar]
- Otto S.P, Lenormand T. Resolving the paradox of sex and recombination. Nat. Rev. Genet. 2002;3:252–261. doi: 10.1038/nrg761. doi:10.1038/nrg761 [DOI] [PubMed] [Google Scholar]
- Prado F, Cortes-Ledesma F, Huertas P, Aguilera A. Mitotic recombination in Saccharomyces cerevisiae. Curr. Genet. 2003;42:185–198. doi: 10.1007/s00294-002-0346-3. [DOI] [PubMed] [Google Scholar]
- Puig S, Querol A, Barrio E, Perez-Ortin J.E. Mitotic recombination and genetic changes in Saccharomyces cerevisiae during wine fermentation. Appl. Environ. Microbiol. 2000;66:2057–2061. doi: 10.1128/aem.66.5.2057-2061.2000. doi:10.1128/AEM.66.5.2057-2061.2000 [DOI] [PMC free article] [PubMed] [Google Scholar]
- Redfield R.J. Do bacteria have sex? Nat. Rev. Genet. 2001;2:634–639. doi: 10.1038/35084593. doi:10.1038/35084593 [DOI] [PubMed] [Google Scholar]
- Shao C, Deng L, Henegariu O, Liang L, Raikwar N, Sahota A, Stambrook P.J, Tischfield J.A. Mitotic recombination produces the majority of recessive fibroblast variants in heterozygous mice. Proc. Natl Acad. Sci. USA. 1999;96:9230–9235. doi: 10.1073/pnas.96.16.9230. doi:10.1073/pnas.96.16.9230 [DOI] [PMC free article] [PubMed] [Google Scholar]
- Thornton R.J, Johnston J.R. Rates of spontaneous mitotic recombination in Saccharomyces cerevisiae. Genet. Res. 1971;18:147–151. doi: 10.1017/s0016672300012544. [DOI] [PubMed] [Google Scholar]
- Tischfield J.A. Loss of heterozygosity or: how I learned to stop worrying and love mitotic recombination. Am. J. Hum. Genet. 1997;61:995–999. doi: 10.1086/301617. doi:10.1086/301617 [DOI] [PMC free article] [PubMed] [Google Scholar]
- Uyenoyama M.K, Bengtsson B.O. On the origin of meiotic reproduction: a genetic modifier model. Genetics. 1989;123:873–885. doi: 10.1093/genetics/123.4.873. [DOI] [PMC free article] [PubMed] [Google Scholar]
- Wiener P, Feldman M.W, Otto S.P. On genetic segregation and the evolution of sex. Evolution. 1992;46:775–782. doi: 10.1111/j.1558-5646.1992.tb02083.x. doi:10.2307/2409645 [DOI] [PubMed] [Google Scholar]
- Wolfram S. Addison-Wesley; New York, NY: 1991. Mathematica. [Google Scholar]
- Xu J.P. The prevalence and evolution of sex in microorganisms. Genome. 2004;47:775–780. doi: 10.1139/g04-037. doi:10.1139/g04-037 [DOI] [PubMed] [Google Scholar]
- Yuan L.W, Keil R.L. Distance-independence of mitotic intrachromosomal recombination in Saccharomyces cerevisiae. Genetics. 1990;124:263–273. doi: 10.1093/genetics/124.2.263. [DOI] [PMC free article] [PubMed] [Google Scholar]
Associated Data
This section collects any data citations, data availability statements, or supplementary materials included in this article.
Supplementary Materials
Supplementary materials


