Abstract
It has been hypothesized that a major factor in the progression of mitochondrial disease resulting from defects in oxidative phosphorylation (OXPHOS) is the stimulation of the mitochondrial production of reactive oxygen species (ROS) and the resulting damage to the mtDNA. To test this hypothesis, we examined the mitochondria from mice lacking the heart/muscle isoform of the adenine nucleotide translocator (Ant1), designated Ant1tm2Mgr (−/−) mice. The absence of Ant1 blocks the exchange of ADP and ATP across the mitochondrial inner membrane, thus inhibiting OXPHOS. Consistent with Ant1 expression, mitochondria isolated from skeletal muscle, heart, and brain of the Ant1-deficient mice produced markedly increased amounts of the ROS hydrogen peroxide, whereas liver mitochondria, which express a different Ant isoform, produced normally low levels of hydrogen peroxide. The increased production of ROS by the skeletal muscle and heart was associated with a dramatic increase in the ROS detoxification enzyme manganese superoxide dismutase (Sod2, also known as MnSod) in muscle tissue and muscle mitochondria, a modest increase in Sod2 in heart tissue, and no increase in heart mitochondria. The level of glutathione peroxidase-1 (Gpx1), a second ROS detoxifying enzyme, was increased moderately in the mitochondria of both tissues. Consistent with the lower antioxidant defenses in heart, the heart mtDNAs of the Ant1-deficient mice showed a striking increase in the accumulation of mtDNA rearrangements, whereas skeletal muscle, with higher antioxidant defenses, had fewer mtDNA rearrangements. Hence, inhibition of OXPHOS does increase mitochondrial ROS production, eliciting antioxidant defenses. If the antioxidant defenses are insufficient to detoxify the ROS, then an increased mtDNA mutation rate can result.
It has been proposed that the symptoms of mitochondrial disease are the result of two pathophysiological effects of oxidative-phosphorylation (OXPHOS) deficiency: reduced mitochondrial energy (ATP) production and increased production and toxicity of mitochondrial reactive oxygen species (ROS; ref. 1). The mitochondria are one of the major sources of endogenous ROS, the ROS encompassing superoxide anion (O2⨪), hydrogen peroxide (H2O2), and hydroxyl radical (⋅OH) in the cell (2). Inhibiting the mitochondrial electron transport chain in vitro by using the respiratory complex III inhibitor antimycin A results in a significant increase in the mitochondrial production of O2⨪ (3–5) and H2O2 (6). This increase suggests that when the respiratory chain is blocked, electrons accumulate in the initial steps, specifically respiratory complex I and coenzyme Q, where they can be transferred directly to molecular oxygen to give O2⨪ (4, 7). The mitochondrial O2⨪ is dismutated to H2O2 by manganese superoxide dismutase (Sod2), and the H2O2 is converted to H2O by glutathione peroxidase-isoform 1 (Gpx1). However, in the presence of reduced transition metals, H2O2 can be converted to the highly toxic ⋅OH (8). Because of its proximity to OXPHOS in the mitochondrial inner membrane, the mtDNA has been hypothesized to be a major target for ROS damage. Hence, inhibition of OXPHOS would be predicted to result in the progressive destruction of the mtDNA.
We have succeeded in inhibiting mouse heart and skeletal muscle OXPHOS by genetically knocking out the adenine nucleotide translocator (Ant1) gene. Mice have two Ant genes: Ant1, which is expressed in skeletal muscle, heart, and brain, and Ant2, which is expressed in all tissues but skeletal muscle. Hence, skeletal muscle expresses only Ant1 and is completely Ant-deficient in the Ant1tm2Mgr (−/−) mice, whereas heart and brain express both Ant1 and Ant2 and are partially deficient. Consequently, the muscles of Ant1tm2Mgr (−/−) mice have classical mitochondrial myopathy with ragged-red fibers, a dramatic proliferation of mitochondria, and a marked exercise intolerance; whereas the hearts of Ant1tm2Mgr (−/−) mice become hypertrophic and show mitochondrial proliferation (9). Liver, which expresses only Ant2, is unaffected in the mutant mice.
Because the Ant1tm2Mgr (−/−) mice have partial or complete OXPHOS defects in skeletal muscle, heart, and brain, we hypothesized that the mitochondria of these mice also should produce higher levels of ROS such as H2O2. The increased ROS should induce antioxidant defenses and damage mitochondrial macromolecules such as the mtDNA. Consistent with this expectation, we report that the skeletal muscle, heart, and brain mitochondria of the Ant1tm2Mgr (−/−) mice do have increased H2O2 production; that antioxidant defense enzymes are induced in muscle and heart; and that mtDNA damage does accumulate more rapidly in heart, apparently as a function of the tissue’s increased ROS production, with only modest induction of its antioxidant defenses.
MATERIALS AND METHODS
Genotyping and Animal Maintenance.
Newborn pups were genotyped at 7–9 days of age as described (9). Adult mice were fed Purina Labdiet 5021 and housed under standard conditions. For biochemical analyses, animals were killed by cervical dislocation in accordance with Emory University’s ethical guidelines outlined by protocol 027-98(B) of the Institutional Animal Care and Use Committee.
Tissue Harvesting for Mitochondrial Isolation.
All manipulations were performed at 4°C or on ice to minimize mitochondrial-membrane and protein degradation. Whole hearts, gastrocnemius skeletal muscle, brain, and liver from 5- to 6-month-old animals were harvested and immersed in isotonic homogenization buffer (H buffer: 225 mM mannitol/75 mM sucrose/10 mM Mops/1 mM EGTA/0.5% BSA, pH 7.2; ref. 10). The brain’s cerebellum was separated and placed in H buffer. The remaining brain was then sectioned coronally into 1-mm slices by using an RBM-2000C rodent brain template (Pelco International, Redding, CA), and the sections containing the cortex were collected.
Mitochondrial Isolation.
Mitochondria were isolated by differential centrifugation (10). Heart and gastrocnemius muscle were finely minced by using a Thomas tissue slicer; other tissues were minced with scissors. Tissues were then homogenized in a 15-ml Wheaton Scientific Teflon-to-glass homogenizers with (heart and muscle) or without (liver and brain) the aid of a motor (Eurostar power-b, IKA Works, Wilmington, NC). Mitochondrial pellets were resuspended in 150–600 μl of H buffer, and protein concentration was determined by using the Coomassie Stain kit (Pierce). The values obtained were corrected for BSA in the resuspension buffer.
Mitochondrial Hydrogen Peroxide Generation Assay.
Hydrogen peroxide efflux was measured with the p-hydroxyphenylacetate fluorescence method (6, 11) by using 100–200 μg of mitochondrial protein per assay. Succinate was added as a substrate at a final concentration of 6.5 mM. Fluorescence intensity (320-nm excitation; 400-nm emission) was measured for each 10-min reaction in a Perkin–Elmer LS50B fluorescence spectrometer by using flwinlab software. After the measurement of basal levels of H2O2 production for the first 5 min of the reaction, antimycin A was added to give a final concentration of 60 μM. Catalase (1,000 units) was added 3 min after the antimycin A addition, and a brief decrement in p-hydroxyphenylacetate fluorescence was observed. Pure H2O2 (Fisher Scientific) was used to construct a standard curve by adding 11.8, 23.6, 47.2, 70.8, and 94.4 pmol of H2O2 per 3-ml reaction.
Mitochondrial Membrane Electrochemical Potential (ΔΨ).
The mitochondrial ΔΨ was measured by the mitochondrial uptake of tetraphenylphosphonium cation (12, 13). The concentration was measured by using a tetraphenylphosphonium-cation-sensitive electrode, and ΔΨ was calculated by using the Nernst equation.
Western Blot Analysis.
Western blots were prepared by using affinity purified polyclonal antibodies. Antibodies for Ant1 and Ant2 were raised against the 15 N-terminal amino acids (9). Antibodies against Sod2 were raised against the “near” N-terminal residues 25–41 by using the oligopeptide acetyl-KHSLPDLPYDYGALEPH[C]-amide. Antibodies against Gpx1 were raised against the C-terminal oligopeptide acetyl-[C]DIETLLSQQSGNS-carboxyl. Each peptide was conjugated to the carrier protein keyhole limpet hemocyanin via the foreign cysteine [C] and injected into rabbits at Quality Controlled Biochemicals (Hopkinton, MA). Antisera were collected and purified by affinity chromatography on the respective peptide-Sepharose columns. Tissues for Western blots were dissected, rinsed in PBS, and frozen at −80°C. Tissues were homogenized in (1:10 wt/vol) H buffer (without BSA) by using an Omni 5000 blender (Omni International, Waterbury, CT) on setting 5 for 20 s, followed by sonication (10). Mitochondria for Western blots were obtained from the same preparations used for the H2O2 assays and kept frozen at −20°C until used for Western analysis. Cellular lysate (20 μg) or isolated mitochondrial protein (15 μg) was electrophoresed, blotted onto nitrocellulose (9), and probed with Ant1, Ant2, Gpx1, or Sod2 antiserum by using the Western Blot Kit (Kirkegaard & Perry Laboratories) and Western Breeze chemiluminescence substrate with enhancer (NOVEX, San Diego). To assure approximately equal loading of total protein on SDS/PAGE gels, immunoblots were reversibly stained with Ponceau S dye [2 g/liter in 1% (vol/vol) acetic acid solution] and photographed. Ponceau S was removed by rinsing for 10 min in PBS, pH 7.2/0.5 ml/liter Tween 20 before incubation in primary antibody. Densitometry was performed on a Personal Densitometer SI by using high resolution scans (Molecular Dynamics). The specificities of the Gpx1 and Sod2 antibodies were confirmed by probing immunoblots prepared from tissue extracts obtained from Gpx1 (−/−) and Sod2 (−/−) mice, respectively. For each antibody, a single band was obtained from the (+/+) tissues; this band was absent in the (−/−) tissues (data not shown).
RNA Isolation and Northern Blot Analysis.
Total RNA was extracted from frozen heart and gastrocnemius skeletal muscle of 5- to 6-month-old mice, and Northern blots were prepared (9). Membranes were hybridized with a 32P-labeled probe corresponding to 650 bp of the mouse Sod2 cDNA, 250 bp of the mouse Gpx1 cDNA, or 1.1 kilobases (kb) of the mouse 18S RNA cDNA. Blots were visualized by phosphorimager analysis, followed by exposure to XAR film (Eastman Kodak). Band intensities were quantified by using imagequant software (Molecular Dynamics).
DNA Isolation and Long-Extension (LX)-PCR.
DNA was prepared from frozen heart and skeletal muscle of 16- to 20-month-old mice by using the Puregene DNA Isolation Kit (Gentra Systems). LX-PCR was carried out on 50 ng of total DNA with Taq polymerase with a 10-min extension time by using the PCR primers MSFlFor and MSFlRev (14). LX-PCR on skeletal muscle was carried out as in heart, except that the Intermountain Scientific (Kaysville, UT) Bio-X-Act PCR kit was used with an extension time of 5 min. All amplifications were carried out in a Perkin–Elmer 9700 thermocycler. For all tissues tested, there was amplification of the 15.9-kb mtDNA molecule; however, batch variability of Bio-X-Act polymerase was noted, with one batch permitting amplification of 15.9-kb mtDNA to the exclusion of truncated mtDNAs.
Minicircle PCR.
Minicircle PCR was carried out on 50 ng of total heart DNA (14). The PCR primers were MC1For and MC1Rev (14).
Sequencing of mtDNA Breakpoints.
Sequencing of mtDNA rearrangement breakpoints was carried out with LX-PCR products excised and extracted from the agarose gel (14). The PCR fragment was reamplified and subjected to cycle sequencing by using an Applied Biosystems Corporation ABI 373 automated sequencer (Perkin–Elmer). Sequence data were analyzed with the sequencher software (Gene Codes, Ann Arbor, MI).
Southern Blot Analysis of mtDNA.
For each sample, total DNA (2 μg) was digested with SacI (Boehringer Mannheim), and Southern blots were prepared. Membranes first were probed with the 18S rRNA cDNA probe. Washed blots were imaged by using the phosphorimager, and the hybridization was quantified. The unstripped blots were then reprobed with the 15.9-kb mtDNA probe obtained from LX-PCR reactions on wild-type heart DNA. Washed blots were visualized, and intensities were quantified. After mtDNA quantitation, the blots were exposed to Kodak XAR film. The percentage increase was calculated from the change in the ratio of mtDNA to 18S rRNA calculated from the Ant1 (+/+), (+/−), and (−/−) samples run on the same gel.
Mitochondrial Aconitase Activity.
Aconitase activity was measured on supernatants from mitochondrial extracts (15). Extracts were produced via one round of freeze–thawing of isolated mitochondria from 5- to 6-month-old mice, followed by sonication (10).
Statistical Analysis.
Statistical analysis was carried out with graphpad prism software (GraphPad, San Diego). P values represent the results of the Mann–Whitney nonparametric two-tailed t test.
RESULTS
To determine the effects of the Ant1 mutation on mitochondrial ROS production, we examined mitochondria from skeletal muscle, heart, and brain, which express significant levels of Ant1. Because of the complex structure of the mouse brain, we examined the expression of Ant1 and Ant2 in cerebral cortex, striatum, cerebellum, and brainstem by Western blot by using isoform-specific antibodies (9). All of these brain regions were found to express both Ant1 and Ant2.
Based on the logic that the lack of Ant would potentiate ROS production, we predicted that mitochondria isolated from tissues with the greatest proportion of Ant1 gene expression would have the highest H2O2 production rate in the Ant1tm2Mgr (−/−) mouse. To test this prediction, we isolated mitochondria from the skeletal muscle, heart, brain, and liver of 5- to 6-month-old Ant1tm2Mgr (−/−) and control mice and measured their levels of H2O2 production by using succinate as the electron donor with and without antimycin A inhibition. To assure the integrity of the mitochondrial inner membrane in these preparations, we determined the ΔΨ of the isolated mitochondria by measuring the uptake of tetraphenylphosphonium cation. In skeletal muscle mitochondria, the ΔΨ was −172 mV for the Ant1tm2Mgr (−/−) mitochondria and −151 mV for control animals (n = 2), a consistent difference that may reflect the reduced proton flux through the stalled ATP synthase. In heart, the ΔΨ was −197 mV for the mutant mitochondria and −191 mV for the normal mitochondria (n = 2). These results show that the mitochondria isolated by the present procedures are tightly coupled, such that the inhibition of ATP and ADP exchange will be linked to the inhibition of the electron transport chain.
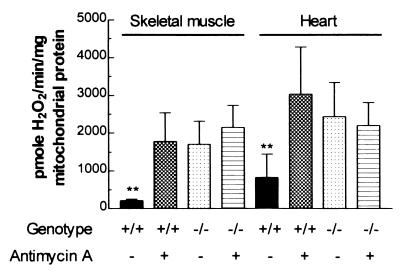
The skeletal muscle mitochondria of Ant1tm2Mgr (−/−) mice produced H2O2 at an ≈8-fold greater rate than the mitochondria from normal mice when antimycin A was absent. On addition of 60 μM antimycin A, the H2O2 production rate of the Ant1tm2Mgr (−/−) mitochondria did not change, but that of the normal mitochondria rose to the same level as the mutant mitochondria (Fig. 1). Hence, the H2O2 production rate of the Ant1tm2Mgr (−/−) skeletal muscle mitochondria is constitutively set at maximum, proving that inhibition of OXPHOS in vivo results in increased mitochondrial production of ROS. Similarly, heart mitochondria from Ant1tm2Mgr (−/−) mice showed a 3-fold increase in H2O2 production, relative to normal heart mitochondria. Moreover, as in skeletal muscle, antimycin A inhibition increased the H2O2 production of the normal heart mitochondria but not the mutant mitochondria (Fig. 1). Thus, the heart mitochondria of the Ant1tm2Mgr (−/−) mice also produce the maximum ROS.
Figure 1.
Mitochondrial H2O2 production is maximized in Ant1tm2Mgr (−/−) skeletal muscle and heart. The bars represent the mean ± SD level of H2O2 production for mitochondria from normal (+/+) and Ant1tm2Mgr (−/−) animals with and without antimycin A. ∗∗, P < 0.01 for normal (+/+) as compared with (−/−) mitochondria for the same tissue; n = 5 for each group.
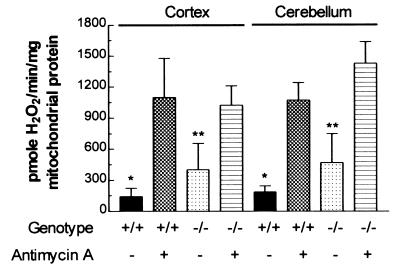
Mitochondria from the different regions of the brain of the Ant1tm2Mgr (−/−) animals also produce increased levels of H2O2. The cortex mitochondria of the Ant1tm2Mgr (−/−) animals produced 3-fold more H2O2 than control mitochondria, and the cerebellum mitochondria of the Ant1tm2Mgr (−/−) animals produced 2.5-fold more H2O2 than control mitochondria. However, unlike mutant skeletal muscle and heart mitochondria, antimycin A inhibition further increased the H2O2 production of the mutant mitochondria (Fig. 2). This additional increase implies that the partial Ant defect in the cortex and cerebellum increases ROS production but is not sufficient to maximize ROS production. This result correlates with the lack of an obvious neurological phenotype in the Ant1tm2Mgr (−/−) mice.
Figure 2.
Mitochondrial H2O2 production is increased partially in Ant1tm2Mgr (−/−) brain cortex and cerebellum. Data are presented as in Fig. 1. ∗, P < 0.05 for normal (+/+) as compared with (−/−) mitochondria from the same tissue without inhibitor; ∗∗, P < 0.01 for (−/−) without inhibitor as compared with (−/−) with inhibitor; n = 4–6 for each group.
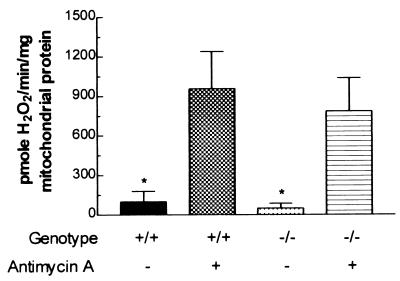
Finally, H2O2 production from the liver mitochondria of Ant1tm2Mgr (−/−) mice was not increased relative to normal mitochondria, and H2O2 production was stimulated comparably by antimycin A in both types of mitochondria (Fig. 3). Hence, genetic inactivation of Ant1 had no effect on H2O2 production in the liver, which expresses only Ant2.
Figure 3.
Mitochondrial H2O2 production is normal in Ant1tm2Mgr (−/−) livers. Data are presented as in Fig. 1. ∗, P < 0.05 for comparison of (+/+) or (−/−) mitochondria with or without inhibitor; n = 5 for each group.
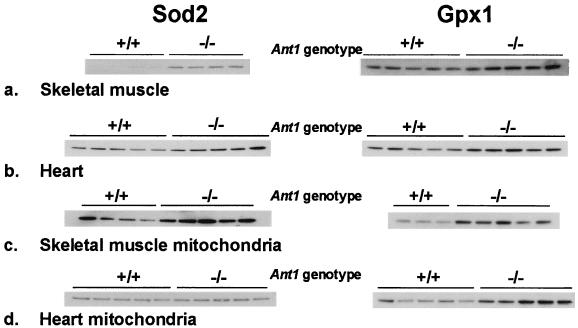
To determine whether increased ROS would result in the compensatory up-regulation of mitochondrial antioxidant defenses, we measured the steady-state protein levels for both Sod2 and Gpx1 in wild-type and Ant1tm2Mgr (−/−) mice. Western blot analysis of total tissue lysates from skeletal muscle (Fig. 4a) and heart (Fig. 4b) identified an up-regulation of both Sod2 (Fig. 4 Left) and Gpx1 (Fig. 4 Right), consistent with the increased H2O2 production of the Ant1tm2Mgr (−/−) mitochondria. As determined by densitometric analysis of chemiluminescent signals, the skeletal muscle Sod2 level was increased 15-fold, and the Gpx1 level was increased 3-fold, relative to wild-type controls. Similarly, the Ant1tm2Mgr (−/−) heart Sod2 level was increased 2-fold, and Gpx1 was increased 3-fold.
Figure 4.
Increased Sod2 and Gpx1 protein levels in Ant1tm2Mgr (−/−) skeletal muscle and heart. Western blot analysis was performed on total tissue lysates (a and b) or isolated mitochondria (c and d). Each of the channels of the blots was loaded with equal amounts of protein from a different animal, and the blots were probed with polyclonal antibodies raised against Sod2 (Left) or Gpx1 (Right). The molecular mass of the Sod2 monomer is 24 kDa, and that of the Gpx1 monomer is 22 kDa.
To determine whether the increased tissue levels of Sod2 and Gpx1 were caused by increased enzyme levels within the mitochondria or merely caused by increased numbers of mitochondria within each cell, the Sod2 and Gpx1 levels were identified in isolated skeletal muscle (Fig. 4c) and heart (Fig. 4d) mitochondria. Using Western blots with approximately equal amounts of mitochondrial protein, we found that skeletal muscle mitochondria from Ant1tm2Mgr (−/−) animals had a 6-fold increase in Sod2 and a 3-fold increase in Gpx1, whereas heart mitochondria had no increase in Sod2 levels but a 3-fold increase in Gpx1 levels, relative to controls. These results indicate that the very large increase in Sod2 levels seen in skeletal muscle is caused by both increased Sod2 per mitochondrion as well as by an increased number of mitochondria per muscle cell. By contrast, the modest increase of Sod2 in heart is not caused by an increase in the level of Sod2 per mitochondrion but reflects the modest increase in the number of mitochondria in each cardiomyocyte. The increased Gpx1 in both heart and muscle seems to be caused primarily by increased Gpx1 in the mitochondria.
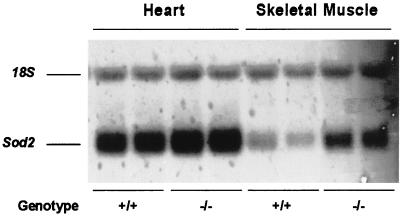
To determine whether the increases in the Sod2 and Gpx1 protein levels in heart and skeletal muscle extracts were the result of increased steady-state mRNA levels, we analyzed Northern blots of total RNA from these tissues. The Sod2 mRNA levels were increased 2-fold in the skeletal muscle of Ant1tm2Mgr (−/−) animals, relative to controls (Fig. 5), and also increased, though less so, in the hearts of the Ant1tm2Mgr (−/−) animals (Fig. 5). The Gpx1 mRNA levels were not increased significantly in the skeletal muscle and hearts of the mutant animals, relative to controls (n = 2; data not shown). Hence, Sod2 mRNA was increased modestly in Ant1tm2Mgr (−/−) mouse skeletal muscle and heart, though not to the same extent as the Sod2 protein levels.
Figure 5.
Increased Sod2 mRNA in Ant1tm2Mgr (−/−) skeletal muscle and heart as determined by Northern blot analysis of heart and skeletal muscle. The mean mRNA levels were calculated from a total of five determinations. For skeletal muscle, P < 0.01 for (+/+) as compared with (−/−) mice.
To determine the effects of the increased ROS production on the Ant1tm2Mgr (−/−) mitochondrial macromolecular structure and function, we examined mitochondrial aconitase activity and assayed for mtDNA rearrangements. The mitochondrial aconitase activity of the skeletal muscle and heart mitochondria was not reduced significantly in the Ant1tm2Mgr (−/−) mice relative to controls (data not shown). Hence, unlike the acute ROS toxicity observed in mice lacking Sod2 where mitochondrial aconitase is inactivated (16–18), the chronic ROS production associated with the Ant1 deficiency is insufficient to diminish aconitase activity.
The mtDNA of the Ant1tm2Mgr (−/−) mice skeletal muscle and heart then was analyzed for possible changes in mtDNA levels and rearrangement mutations. The amount of mtDNA in these tissues was determined by using the ratio of mtDNA to nuclear DNA, as determined by Southern blotting. This ratio indicated that the mtDNA level in skeletal muscle was increased ≈60% in the Ant1tm2Mgr (−/−) mice relative to heterozygous (+/−) or homozygous wild-type (+/+) controls (data not shown), which is consistent with the marked proliferation of mitochondria seen in the mutant skeletal muscle. By contrast, the ratio of mtDNA to nuclear DNA in heart was not increased significantly (data not shown).
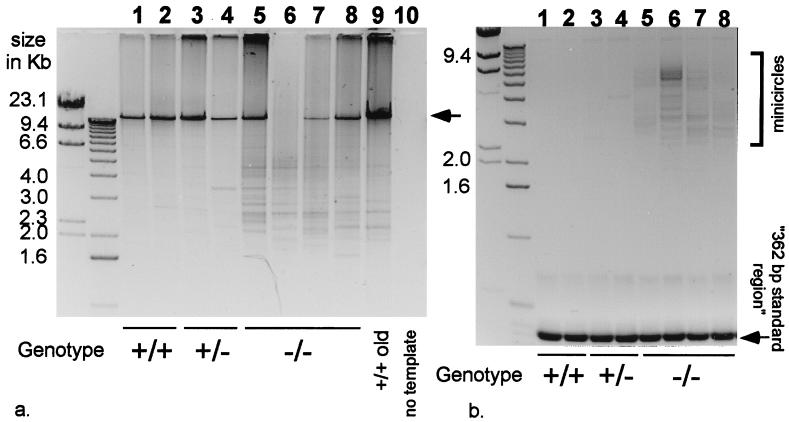
The extent of the mtDNA rearrangements, which accumulate in the Ant1tm2Mgr (−/−) mouse heart and skeletal muscle, relative to controls, was then analyzed by LX-PCR. In LX-PCR, the entire length of the mtDNA is amplified by using adjacent cytochrome b PCR primers whose 3′ hydroxyls point away from each other. The lengths of the various mtDNA PCR products are then determined by agarose gel electrophoresis (14). The hearts of middle-aged, 16- to 20-month-old Ant1tm2Mgr (−/−) animals were found to have a large number of different-length mtDNA rearrangements (Fig. 6a, lanes 5–8), whereas comparably aged control hearts (+/+ and +/−) had only a few rearrangements (Fig. 6a, lanes 1–4). In fact, the rearrangements found in the 16- to 20-month-old Ant1tm2Mgr (−/−) hearts were more comparable to those seen in very old mice, 32 months of age (Fig. 6a, lane 9). The breakpoints of three of the Ant1tm2Mgr (−/−) heart mtDNAs were analyzed by sequencing (Table 1) and found to be comparable to those that have been studied previously in old mice (14, 19–21).
Figure 6.
Increased mtDNA rearrangements in 16- to 20-month-old Ant1tm2Mgr (−/−) heart. (a) Heart LX-PCR products: lanes 1–2, wild-type (+/+); lanes 3–4, Ant1tm2Mgr (+/−); lanes 5–8, Ant1tm2Mgr (−/−); lane 9, 32-month-old wild-type heart DNA; and lane 10, no template DNA. Each lane (1–9) represents the products of a reaction that used template DNA from a different animal. The arrow indicates a 15.9-kb mtDNA product. (b) Heart minicircle PCR products. Sample order as in a. The “362-bp standard region” is the product encompassed between the two primers (14).
Table 1.
mtDNA rearrangement breakpoints in Ant1tm2Mgr (−/−) hearts
| mtDNA size | 5′ breakpoint | Deleted region | 3′ breakpoint |
|---|---|---|---|
| 16,118 | 13,936 | ||
| 1.8 kb | TAATGCCAAACCC | AAAAAAACAC … AAACCCTAAA | ACCATTAAACAA |
| 15,928 | 13,099 | ||
| 2.5 kb | TTATTTTGGCCTA | CTTTCATCAA … ACCCAATCAA | ACGCCTAGCATT |
| 16,101 | 12,533 | ||
| 3.2 kb | CCCCCACCCCCTC | CTCTTAATGC … CCACCCCCTC | ACGACTAATAAT |
Nucleotide numbers coincide with the published mouse mtDNA sequence (31). Direct repeats are underlined.
Minicircle mtDNAs have been observed in the hearts of very old mice (14). To determine whether the hearts of the Ant1tm2Mgr (−/−) animals prematurely developed minicircles, we analyzed heart DNAs by minicircle LX-PCR with cytochrome b primers that have their 3′ hydroxyls directed toward each other. This reaction yields two types of products: a prominent 362-bp cytochrome b product and a heterogeneous array of larger products encompassing the entire minicircle mtDNA, flanked by 362-bp cytochrome b repeats (14). We applied this procedure to the middle-aged, 16- to 20-month-old Ant1tm2Mgr (−/−) hearts and identified numerous minicircles (Fig. 6b, lanes 5–8), comparable in frequency and size to the minicircle mtDNAs found in the hearts of very old control animals (14). The middle-aged control hearts, by contrast, had no minicircles (Fig. 6b, lanes 1–4).
The skeletal muscle mtDNAs of the Ant1tm2Mgr (−/−) mice also had some increase in mtDNA rearrangements relative to age-matched controls. However, this increase was much more modest than that seen in heart (data not shown).
Therefore, in the hearts of the Ant1tm2Mgr (−/−) mice, the mtDNA mutation rate was increased dramatically in the context of maximal mitochondrial ROS production and of minimal induction of the antioxidant enzyme defenses. For the skeletal muscle of the Ant1tm2Mgr (−/−) mice, the mtDNA mutation rate was elevated only mildly in the context of maximal mitochondrial ROS production and also of maximum induction of antioxidant enzyme defenses.
DISCUSSION
The pathophysiology of mitochondrial diseases was attributed initially to deficiencies in mitochondrial energy output. However, more recent observations (22, 23) have led to the hypothesis that inhibition of the mitochondrial electron transport chain also might increase mitochondrial ROS production, increasing oxidative stress on the mitochondria and further eroding mitochondrial function (1). Oxidative stress results when the balance of prooxidants and antioxidants is altered in favor of the oxidants (24, 25).
To determine whether oxidative stress is an important factor in mitochondrial disease, we have examined the mitochondria from various tissues of the Ant1tm2Mgr (−/−) mice for increased production of ROS, induction of antioxidant enzyme defenses, and increased mtDNA damage. All of these parameters were found to be affected by the OXPHOS defect of the Ant1tm2Mgr (−/−) mice.
Analysis of H2O2 production by isolated mitochondria indicated that mutant heart and skeletal muscle mitochondria with the lowest residual Ant levels had maximal H2O2 production, whereas liver mitochondria with more normal Ant levels had lower, more normal H2O2 production. Because inactivation of Ant would inhibit ATP and ADP exchange across the mitochondrial inner membrane, matrix ADP would be depleted. This depletion would inhibit the mitochondrial proton-translocating ATP synthase because of a lack of substrate. Inhibition of the ATP synthase would inhibit the proton flux back through the mitochondrial inner membrane via the ATP synthase, F0 proton channel. Therefore, the electrochemical gradient (ΔP = ΔΨ + ΔμpH) would remain at its maximum potential difference, inhibiting proton pumping by complexes I, III, and IV and stalling electron flow through the electron transport chain. Electrons would then accumulate around complex I and coenzyme Q where they would be available to be donated to O2 to give O2⨪, the first of the toxic ROS. Because rates of mitochondrial H2O2 production are increased in Ant1tm2Mgr (−/−) heart, skeletal muscle, and brain, our data confirm that inhibition of OXPHOS increases oxidative stress.
In addition, tissues with high oxidative stress showed increased levels of Sod2 and Gpx1, indicating that cells can respond to increased ROS by increasing antioxidant countermeasures. However, different tissues responded differently; skeletal muscle dramatically induced Sod2, whereas heart increased Sod2 only modestly, even though both tissues increased Gpx1 levels similarly. These results recapitulate previous work in which Sod2 mRNA (26, 27), protein (26–28), and Gpx1 mRNA and activity (29) were found to be induced in response to oxidative stress. Also, Gpx1 activity was found to be increased in cultured cells overexpressing Sod2 (30).
The level of mtDNA rearrangements in the Ant1-deficient mouse tissues also was found to increase with oxidative stress. Although both heart and skeletal muscle had maximal levels of ROS production, the skeletal muscle mitochondria had a comparable increase in mitochondrial Sod2 levels, whereas the heart did not. Furthermore, the absolute rate of H2O2 production was higher in heart than in skeletal muscle. Thus, our data are consistent with the idea that heart mitochondria are exposed to much higher levels of oxidative stress than skeletal muscle mitochondria. This idea corresponds nicely with the observation of very high levels of mtDNA rearrangements in the Ant1tm2Mgr (−/−) heart but not in the skeletal muscle. Thus, it does seem that increased mitochondrial oxidative stress is associated with increased mtDNA damage.
Inhibition of mitochondrial OXPHOS has been shown to result in increased mitochondrial ROS production. In some tissues, the increased ROS levels are countered by increased antioxidant enzyme levels, whereas it is not in other tissues. In those tissues in which the increased ROS production rate exceeds the capacity of the detoxification systems, mtDNA damage ensues. Presumably, the rise in mtDNA damage results in a functional decline of the mitochondria, which exacerbates the inherited defect of OXPHOS. Therefore, the Ant1-deficient mouse provides strong support for the concept that both reduced mitochondrial energy output and increased mitochondrial oxidative stress are important factors in the pathophysiology of mitochondrial disease.
Acknowledgments
We thank R. Sohal for assistance with the H2O2 and aconitase assays, D. Murdock for helpful discussions, and B. Graham for technical assistance. This work was supported by National Institutes of Health Grants HL45572, AG13154, and NS21328 (to D.C.W.).
ABBREVIATIONS
- OXPHOS
oxidative phosphorylation
- ROS
reactive oxygen species
- LX
long extension
- kb
kilobase
References
- 1.Wallace D C. In: The Molecular and Genetic Basis of Neurological Disease. Rosenberg R N, Prusiner S B, DiMauro S, Barchi R L, editors. Boston: Butterworth–Heinemann; 1997. pp. 237–269. [Google Scholar]
- 2.Wallace D C, Melov S. Nat Genet. 1998;19:105–106. doi: 10.1038/448. [DOI] [PubMed] [Google Scholar]
- 3.Turrens J F, Freeman B A, Levitt J G, Crapo J D. Arch Biochem Biophys. 1982;217:401–410. doi: 10.1016/0003-9861(82)90518-5. [DOI] [PubMed] [Google Scholar]
- 4.Turrens J F, Boveris A. Biochem J. 1980;191:421–427. doi: 10.1042/bj1910421. [DOI] [PMC free article] [PubMed] [Google Scholar]
- 5.Boveris A, Chance B. Biochem J. 1973;134:707–716. doi: 10.1042/bj1340707. [DOI] [PMC free article] [PubMed] [Google Scholar]
- 6.Kwong L K, Sohal R S. Arch Biochem Biophys. 1998;350:118–126. doi: 10.1006/abbi.1997.0489. [DOI] [PubMed] [Google Scholar]
- 7.Turrens J F, Alexandre A, Lehninger A L. Arch Biochem Biophys. 1985;237:408–414. doi: 10.1016/0003-9861(85)90293-0. [DOI] [PubMed] [Google Scholar]
- 8.Goldstein S, Meyerstein D, Czapski G. Free Radical Biol Med. 1993;15:435–445. doi: 10.1016/0891-5849(93)90043-t. [DOI] [PubMed] [Google Scholar]
- 9.Graham B H, Waymire K G, Cottrell B, Trounce I A, MacGregor G R, Wallace D C. Nat Genet. 1997;16:226–234. doi: 10.1038/ng0797-226. [DOI] [PubMed] [Google Scholar]
- 10.Trounce I A, Kim Y L, Jun A S, Wallace D C. Methods Enzymol. 1996;264:484–509. doi: 10.1016/s0076-6879(96)64044-0. [DOI] [PubMed] [Google Scholar]
- 11.Hyslop P A, Sklar L A. Anal Biochem. 1984;141:280–286. doi: 10.1016/0003-2697(84)90457-3. [DOI] [PubMed] [Google Scholar]
- 12.Rottenberg H. J Membr Biol. 1984;81:127–138. doi: 10.1007/BF01868977. [DOI] [PubMed] [Google Scholar]
- 13.Demura M, Kamo N, Kobatake Y. Biochim Biophys Acta. 1987;894:355–364. doi: 10.1016/0005-2728(87)90113-7. [DOI] [PubMed] [Google Scholar]
- 14.Melov S, Hinerfeld D, Esposito L, Wallace D C. Nucleic Acids Res. 1997;25:974–982. doi: 10.1093/nar/25.5.974. [DOI] [PMC free article] [PubMed] [Google Scholar]
- 15.Gardner P R, Nguyen D D, White C W. Proc Natl Acad Sci USA. 1994;91:12248–12252. doi: 10.1073/pnas.91.25.12248. [DOI] [PMC free article] [PubMed] [Google Scholar]
- 16.Li L, Huang T-T, Carlson E J, Melov S, Ursell P C, Olson J L, Noble L J, Yoshimura M P, Berger C, Chan P H, et al. Nat Genet. 1995;11:376–381. doi: 10.1038/ng1295-376. [DOI] [PubMed] [Google Scholar]
- 17.Melov S, Coskun P, Patel M, Tuinstra R, Cottrell B, Jun A S, Zastawny T H, Dizdaroglu M, Goodman S I, Huang T T, et al. Proc Natl Acad Sci USA. 1999;96:846–851. doi: 10.1073/pnas.96.3.846. [DOI] [PMC free article] [PubMed] [Google Scholar]
- 18.Melov S, Schneider J A, Day B J, Hinerfeld D, Coskun P, Mirra S S, Crapo J D, Wallace D C. Nat Genet. 1998;18:159–163. doi: 10.1038/ng0298-159. [DOI] [PubMed] [Google Scholar]
- 19.Tanhauser S M, Laipis P J. J Biol Chem. 1995;270:24769–24775. doi: 10.1074/jbc.270.42.24769. [DOI] [PubMed] [Google Scholar]
- 20.Eimon P M, Chung S S, Lee C M, Weindruch R, Aiken J M. Dev Genet. 1996;18:107–113. doi: 10.1002/(SICI)1520-6408(1996)18:2<107::AID-DVG3>3.0.CO;2-D. [DOI] [PubMed] [Google Scholar]
- 21.Chung S S, Eimon P M, Weindruch R, Aiken J M. Age. 1996;19:117–128. [Google Scholar]
- 22.Ohkoshi N, Mizusawa H, Shiraiwa N, Shoji S, Harada K, Yoshizawa K. Muscle Nerve. 1995;18:1265–1271. doi: 10.1002/mus.880181108. [DOI] [PubMed] [Google Scholar]
- 23.Pitkanen S, Robinson B H. J Clin Invest. 1996;98:345–351. doi: 10.1172/JCI118798. [DOI] [PMC free article] [PubMed] [Google Scholar]
- 24.Packer L. In: Oxidative Stress and Aging. Cutler R G, Packer L, Bertram J, Mori A, editors. Basel: Birkhauser; 1995. pp. 1–14. [Google Scholar]
- 25.Halliwell B, Gutteridge J M C. Free Radicals in Biology and Medicine. Oxford: Clarendon; 1989. pp. 86–135. [Google Scholar]
- 26.Akashi M, Hachiya M, Paquette R L, Osawa Y, Shimizu S, Suzuki G. J Biol Chem. 1995;270:15864–15869. doi: 10.1074/jbc.270.26.15864. [DOI] [PubMed] [Google Scholar]
- 27.Wong G H, Goeddel D V. Science. 1988;242:941–944. doi: 10.1126/science.3263703. [DOI] [PubMed] [Google Scholar]
- 28.Lewis-Molock Y, Suzuki K, Taniguchi N, Nguyen D H, Mason R J, White C W. Am J Respir Cell Mol Biol. 1994;10:133–141. doi: 10.1165/ajrcmb.10.2.8110468. [DOI] [PubMed] [Google Scholar]
- 29.de Haan J B, Bladier C, Griffiths P, Kelner M, O’Shea R D, Cheung N S, Bronson R T, Silvestro M J, Wild S, Zheng S S, et al. J Biol Chem. 1998;273:22528–22536. doi: 10.1074/jbc.273.35.22528. [DOI] [PubMed] [Google Scholar]
- 30.Keller J N, Kindy M S, Holtsberg F W, St Clair D K, Yen H C, Germeyer A, Steiner S M, Bruce-Keller A J, Hutchins J B, Mattson M P. J Neurosci. 1998;18:687–697. doi: 10.1523/JNEUROSCI.18-02-00687.1998. [DOI] [PMC free article] [PubMed] [Google Scholar]
- 31.Bibb M J, Van Etten R A, Wright C T, Walberg M W, Clayton D A. Cell. 1981;26:167–180. doi: 10.1016/0092-8674(81)90300-7. [DOI] [PubMed] [Google Scholar]


