Abstract
Carotenoids are involved in a variety of biological functions, yet the underlying mechanisms are poorly understood, in part because of the long-standing difficulty in assigning the location of the first excited (S1) state. Here, we present a method for determining the energy of the forbidden S1 state, on the basis of ultrafast spectroscopy of the short lived level. Femtosecond transient absorption spectra and kinetics of the S1 → S2 transition revealed the location of the intermediate level in two carotenoid species involved in the xanthophyll cycle, zeaxanthin and violaxanthin, and yielded surprising implications regarding the mechanism of photoregulation in photosynthesis.
The diversity and abundance of carotenoids in nature reflect their importance in protecting and supporting the organisms in which they are found (1). In photosynthetic and physiological systems alike, carotenoids are antioxidants that prevent damage by quenching triplet states and scavenging singlet oxygen. Furthermore, they play an integral role in photoregulation in plants, assisting with light harvesting or dissipating excess energy as needed (2). The mechanisms that underlie their functions are poorly understood, in part because of the long standing difficulty in assigning the location of their first excited (S1) states. In higher conjugated carotenoids, the S1 state is spectroscopically “dark,” hence previous assignments of its energy have relied on extrapolation of data from shorter-chain carotenoids (3). Whereas application of the “energy-gap law” (4) to carotenoids of similar composition (i.e., with changes only in conjugation length) may yield reasonable estimates of S1 energies (5), quantitative information for markedly different species is not reliable.
The S1 level of carotenoids is likely involved in numerous functions and may be particularly relevant to the xanthophyll cycle of higher plants. In this photoprotection function, carotenoids are involved in regulating the amount of light energy funneled into the reaction centers according to the given environmental conditions. The equilibrium within an interconversion reaction cycle involving three carotenoid species, zeaxanthin ⇔ antheraxanthin ⇔ violaxanthin, is shifted according to the amount of light available. In high light, the concentration of zeaxanthin increases, and correspondingly excess energy is dissipated out of the antenna complexes (as monitored by fluorescence quenching), whereas in low light violaxanthin is the predominant carotenoid and no quenching is observed. The S1 states of both carotenoids have been implicated in the mechanism of this function, according to estimates of the energy levels via application of the energy gap law (3, 6). However, without precise knowledge of the S1 energetics, this interpretation is highly speculative.
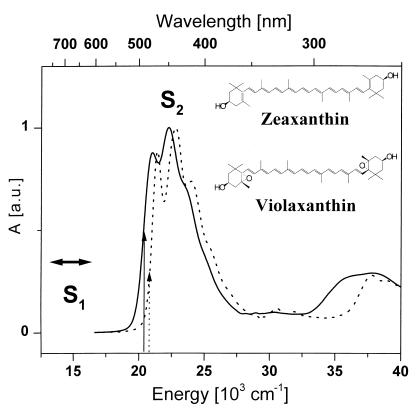
Here we present a general method for measuring the S1-state energy of carotenoids directly, with specific application to zeaxanthin and violaxanthin. The key factor of this experiment lies in the ability to prepare and probe a population of molecules on the excited S1 state within the time window dictated by the lifetime of the state (≈10 ps). The S1 state, having the same symmetry as the ground state, is dipole-forbidden via one-photon transitions and therefore absent from linear absorption measurements (see Fig. 1) (7). Yet, the S1 state is readily populated after excitation of the carotenoids in the UV/visible region to their S2 state; internal conversion to the S1 level has been measured to occur within a few hundred femtoseconds (8). The lifetime of the S1 state is on the order of 10 ps; too short for appreciable fluorescence, yet long enough to be probed by femtosecond techniques (a similar approach using a 20-ns laser was performed on short polyene systems; see ref. 9). Previous studies have exploited the S1 → SN transition in the visible region to accurately measure the S1 lifetime (6), but the inability to assign and locate the higher-excited SN state precluded determination of the S1 state energy.
Figure 1.
Molecular structures and steady-state absorption spectra of zeaxanthin (solid line) and violaxanthin (dashed line) at room temperature. Predicted position of the forbidden S1 level is marked by a solid arrow. Excitation wavelengths are indicated by arrows.
Our approach focuses on the S1 → S2 transition. An initial femtosecond excitation pulse transfers population to the well characterized S2 state, which then relaxes to the S1 level. By scanning the probe pulse shortly after excitation, the S1 → S2 resonance can be found and given the spectral resolution of the detection system, the band shape of the S1(v = 0) → S2 (v = 0, 1, 2) can be determined, yielding the precise location of the carotenoid 0–0 level of the first excited state. In the following, we detail the methodology and illustrate the technique via application to the xanthophyll carotenoids zeaxanthin and violaxanthin in vitro. The surprising implications of the measured S1 energetics are discussed in relation to the mechanism of the xanthophyll cycle.
MATERIALS AND METHODS
The femtosecond spectrometer used in these studies is based on an amplified Ti:Sapphire laser system, with tunable pulses obtained from optical parametric amplifiers (OPAs). The amplified Ti:Sapphire laser system was operated at a repetition rate of 1 kHz producing ≈150 fs pulses with an average output power of 1 W and central wavelength of 790 nm. The output was divided to pump two independent OPAs for generation of the excitation and probe pulses. The excitation wavelength was determined by the carotenoid S2 0–0 absorption: 20,410 cm−1 (490 nm) for zeaxanthin and 20,835 cm−1 (480 nm) for violaxanthin. The low-energy edge of the absorption spectrum was chosen to avoid contribution from vibrational relaxation within the S2 state. The probe wavelength was tuned to the infrared, 11,000–6,000 cm−1 (0.91–1.67 μm), where the S1 → S2 transition was expected. For measurements of the S1 → SN transition, visible light from 400–900 nm was generated by focusing part of the fundamental light into a 1.0-cm sapphire plate to produce a white-light continuum. The instrument response function was measured by frequency mixing the excitation and probe pulses in a LiIO3 crystal; the crosscorrelation signal obtained by this method was fit to a Gaussian function with full width half maximum ≈200 fs. To prevent sample degradation, the excitation pulses were attenuated to typical energies of 400 nJ/pulse.
Violaxanthin was extracted from spinach leaves according to the following procedure (10): 20 g of dark and cold (4°C) adapted leaves were ground in a mortar with 1 g CaCO3 and 40 ml ice-cold acetone and filtered. The extract was directly applied to thin-layer chromatography plates (Silica gel 60, Merck) and developed in n-hexane:ethylacetate:triethylamine in the proportions of 40:48:12 (by volume). Violaxanthin, the second band from the start position, was extracted with methanol bubbled with nitrogen and stored at −20°C until use. The purity was verified by HPLC according to Thayer and Björkman (11). Zeaxanthin was a generous gift from Hoffman–La Roche. The carotenoid samples were dissolved in methanol and maintained at room temperature in a 2-mm quartz rotating optical cell. No sample degradation was observed throughout the course of the measurements.
The absorption spectra and structures of both studied carotenoids are shown in Fig. 1. A characteristic three-peak band shape caused by the vibrational structure of the strongly allowed S0 → S2 transition is the dominant feature of both spectra. The main peaks in the absorption spectrum are attributed to the 0–0, 0–1, and 0–2 vibrational transitions, based on the assignment of a single dominant C = C stretching mode. Zeaxanthin, containing 11 conjugated double bonds, has its 0–0 peak at 21,010 cm−1, while a blue shift is observed for violaxanthin (21,420 cm−1), as only nine conjugated double bonds are present.
RESULTS AND DISCUSSION
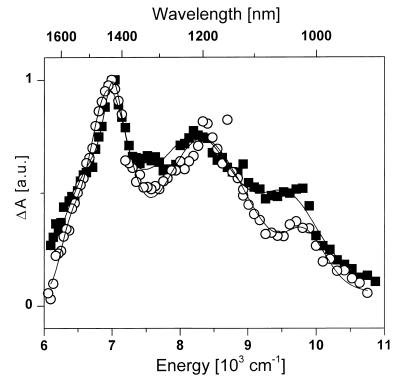
As shown in Fig. 2, transient absorption spectra recorded in the IR region 3 ps after the excitation pulse exhibit features that are very similar to the vibrational structure of the S0 → S2 electronic transition. Furthermore, the energy gaps between peaks located at 7,010 cm−1 (6,950 cm−1), 8,210 cm−1 (8,300 cm−1), and 9,525 cm−1 (9,730 cm−1) for zeaxanthin (violaxanthin) match extremely well with those observed in the strongly allowed S0 → S2 transition presented in Fig. 1. Consequently, the three-peak structure of the transient absorption spectra of zeaxanthin and violaxanthin can be directly interpreted as the S1 → S2 transition with resolved vibrational structure of the S2 level.
Figure 2.
Transient absorption spectra of zeaxanthin (squares) and violaxanthin (open circles) in the spectral region 11,000–6,000 cm−1 (0.91–1.67 μm). The spectra are recorded 3 ps after excitation at 490 nm (zeaxanthin) and 480 nm (violaxanthin).
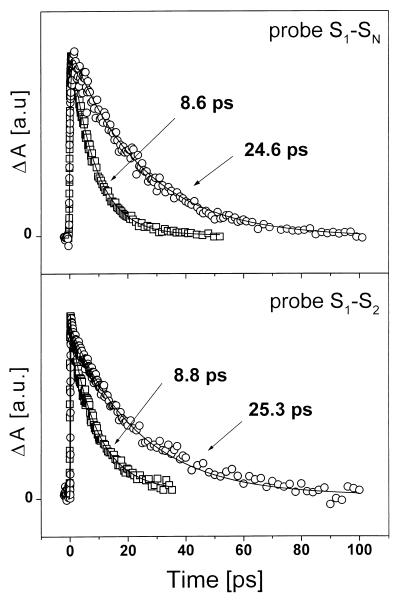
To be certain that the observed transient absorption spectra corresponds to the S1 → S2 transition, we have measured kinetics at the most pronounced band of the transient absorption spectra (6,900 cm−1) of the two species. These kinetics were then compared with those measured in the well known S1 → SN absorption maxima (6), at 19,420 cm−1 (violaxanthin) and 18,050 cm−1 (zeaxanthin). If the assignment of our transient absorption spectra to the S1 → S2 transition is correct, then the S1 → SN kinetics must exhibit decays with the same time constants as were observed at 6,900 cm−1, as both correlate to excited state absorption from the same excited state S1. All measured traces show a single-exponential decay (see Fig. 3). The data were fitted to an exponential function convoluted with a Gaussian response function. The extracted time constants for the kinetics measured at 6,900 cm−1 were 8.8 ps for zeaxanthin and 25.3 ps for violaxanthin. These decay times match well with those determined via measurements probing the S1 → SN transition, where we observed time constants of 8.6 ps and 24.6 ps, consistent with previously published S1 → SN decay times for violaxanthin (6) and zeaxanthin (6, 12). These results support the conclusion that the observed transient absorption spectrum indeed reflects the S1 → S2 transition.
Figure 3.
Transient absorption kinetics of zeaxanthin (squares) and violaxanthin (circles) recorded at the maximum of the S1 → SN transition of both carotenoids (Upper), and at 6,900 cm−1 corresponding to the S1 → S2 transition (Lower). See text for details.
It is worth noting that the S1 → S2 kinetics include a subpicosecond decay component with amplitude less than 10%. In the S1 → SN traces, this component appears as a rise time [as was previously observed for zeaxanthin (12)] and is fitted to time constants of 0.38 ps (violaxanthin) and 0.22 ps (zeaxanthin). This fast process obviously can be ascribed to the fast relaxation from the S2 to the S1 level of both carotenoids. Interestingly, kinetics corresponding to the S1 → S2 transition show this fast component as a decay, indicating that an excited state absorption from the S2 state takes place when probed in the infrared region. The time constants of this decay were found to be 0.32 ps (violaxanthin) and 0.23 ps (zeaxanthin), in good agreement with the observed rise times in the S1 → SN kinetics. The ultrafast part of the decay also contains vibrational relaxation in the S1 state as no other slower kinetic component is observed in addition to the 8.8 and 25.3 ps S1 decay times. Transient absorption spectra measured for various time delays (0.5 ps, 1 ps, 3 ps, 5 ps, 10 ps, and 30 ps; data not shown) in addition show no spectral evolution as would be the expected signature of relaxation of vibrationally hot modes in the S1 state. Andersson and Gillbro found that the relaxation of vibrationally hot modes in the S1 state occurs on the subpicosecond time scale (13). All these observations thus show that any vibrational relaxation is complete within the first picosecond, and hence the transient absorption spectra presented in Fig. 2 (τdelay = 3 ps) indeed represent excited state absorption from the relaxed S1 state.
Now, with knowledge of the S1 → S2 and S0 → S2 transition energies in hand, we can easily locate the position of the S1 level of both carotenoids. Simple subtraction E(S0→S2) − E(S1→S2) by using both the 0–0 and 0–1 transitions and including experimental errors, leads to a S1 (v = 0) energy of (14,030 ± 90) cm−1 for zeaxanthin and (14,470 ± 90) cm−1 for violaxanthin. Previous assignments of the S1 energy were predicted via the energy-gap law (3, 6) involving extrapolations from shorter-chain carotenoids (which yield observable S1 fluorescence); the accepted values were 14,200 cm−1 for zeaxanthin and 15,150 cm−1 for violaxanthin (6). As we can see, the location of the energy level as observed here by direct measurements differs from the values predicted by the energy-gap law. The location of the S1 level of zeaxanthin is in fact close to the previous estimate, but our direct measurements revealed a significant shift to lower energy in the case of violaxanthin, leading to important implications regarding the xanthophyll cycle.
To date, two possible mechanisms of driving fluorescence quenching by means of the xanthophyll cycle have been proposed (14): (i) the “molecular gear shift” mechanism involving singlet–singlet energy transfer via direct carotenoid–chlorophyll interaction; (ii) the aggregation model, where carotenoid-mediated alterations of the organization of antenna complexes induce quenching. The “molecular gear shift” mechanism proposed by Frank et al. (6) requires the S1 level of violaxanthin to be above the Qy of chlorophyll such that it can serve as a light-harvesting pigment in transferring energy to chlorophyll under low-light conditions. Zeaxanthin, with its S1 level below the Qy transition of chlorophyll, could then act as a quencher of excess energy during high-light conditions. In contrast, the aggregation model suggests a mechanism in which the structural differences of violaxanthin and zeaxanthin moderate changes in the organization of antenna complexes. Zeaxanthin enables efficient quenching, while the presence of violaxanthin prepares an arrangement that leads to an antiquenching process (15).
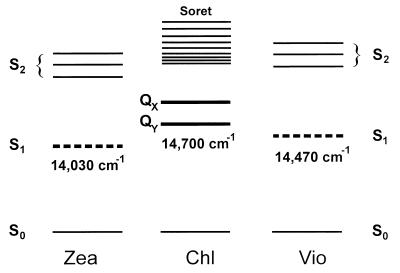
Recalling the location of the Qy band of chlorophyll-a in the light-harvesting complexes of Photosystem II (≈14,700 cm−1) (16), this result leads to a striking conclusion: the S1 levels of both major carotenoids involved in the xanthophyll cycle are located below the Qy band of chlorophyll. Of course, our experiments were performed in vitro and hence in a dielectric environment different from that in the protein complexes of natural systems; a shift of the energy levels may be expected in vivo. A red shift of the S2 level as a result of an environment with higher polarizability has been observed for different types of carotenoids. For violaxanthin and zeaxanthin, the values of this shift observed when the medium was changed from ethanol (absorption peak positions are the same as those for methanol) to benzene were 560 cm−1 for zeaxanthin and 580 cm−1 for violaxanthin (17). It has been shown that with short-chain carotenoids (n = 5, 7, 9), the S1 level is shifted in the same direction as the S2 state, but the corresponding shift is a few times smaller (18). In a protein environment, a significant red shift of the S2 levels of carotenoids has been observed (17). Overall, these observations suggest that in the natural protein environment of the light-harvesting systems, the S1 levels of violaxanthin and zeaxanthin are expected to be red-shifted in comparison to methanol solution, putting the carotenoid S1 levels even further below the Qy level of chlorophyll.
The observation that the S1 level of both zeaxanthin and violaxanthin lies below the Qy level of chlorophyll, depicted schematically in Fig. 4, has significant implications regarding the mechanism of xanthophyll cycle photoregulation in plants. The “molecular gear shift” mechanism involving direct quenching via singlet–singlet energy transfer is not likely to be valid. In fact, violaxanthin could even be a more efficient quencher, because its S1 level lies below but closer to the chlorophyll Qy transition than the S1 level of zeaxanthin. In this respect, the aggregation model based on indirect participation of the xanthophyll cycle carotenoids in the process of photoprotection is a more favorable candidate to explain the function of the xanthophyll cycle in the quenching of excess energy in the antenna complexes of higher plants.
Figure 4.
Energy level diagram of carotenoids and chlorophylls as relevant to the xanthophyll cycle. The S1 energy level of both zeaxanthin (14,030 cm−1) and violaxanthin (14,470 cm−1) lies below the Qy transition of chlorophyll-a.
The experimental technique described here offers a direct means of determining the S1 energy level for any type of carotenoid, including carotenoids with particular importance in living organisms (e.g., lutein, spheroidene, spirilloxanthin, lycopene, etc.). Previously, the S1 level of these species could be estimated only via extrapolation from shorter-chain carotenoids, in which a weak fluorescence from the S1 state can be observed (19). As has been shown in our experiments, such extrapolations easily can be quite inaccurate, especially for carotenoids with various end groups. A different promising approach, in principle, is two-photon spectroscopy, but assignment of the S1 level relies on laser-induced fluorescence that cannot easily be observed in longer-chain carotenoids (20).
Usage of our method certainly will be directed to an investigation of carotenoids in their natural protein environment, where the energy location of the S1 level is of extreme importance and no reliable methods of its determination are now available.
Acknowledgments
We are grateful to Eva Åkesson, Torbjörn Pascher, and Alexander Tarnovsky for assistance with the measurements. We thank Tõnu Pullerits for a critical reading of manuscript and Hoffmann–LaRoche for the gift of zeaxanthin. This work was supported by the Swedish Natural Science Research Council and the Swedish Institute.
References
- 1.Frank H A, Cogdell R. Photochem Photobiol. 1996;63:257–264. doi: 10.1111/j.1751-1097.1996.tb03022.x. [DOI] [PubMed] [Google Scholar]
- 2.Demmig-Adams B, Adams W W. Trends Plant Sci. 1996;1:21–26. [Google Scholar]
- 3.Chynwat V, Frank H A. Chem Phys. 1995;194:237–244. [Google Scholar]
- 4.Engelman R, Jortner J. J Mol Phys. 1970;18:145–164. [Google Scholar]
- 5.Frank H A, Desamero R Z B, Chynwat V, Gebhard R, van der Hoef I, Jansen J F, Lugtenburg J, Gosztola D, Wasielewski M R. J Phys Chem A. 1997;101:149–157. [Google Scholar]
- 6.Frank H A, Cua A, Chynwat V, Young A, Gosztola D, Wasielewski M R. Photosynth Res. 1994;41:389–395. doi: 10.1007/BF02183041. [DOI] [PubMed] [Google Scholar]
- 7.Koyama Y, Kuki M, Andersson P-O, Gillbro T. Photochem Photobiol. 1996;63:243–256. [Google Scholar]
- 8.Macpherson A, Gillbro T. J Phys Chem A. 1998;102:5049–5058. [Google Scholar]
- 9.Bachilo S M, Bondarev S L. Opt Spectrosc (USSR) 1988;65:295–300. [Google Scholar]
- 10.Arvidsson P-O, Bratt E C, Carlsson M, Åkerlund H-E. Photosynth Res. 1996;49:119–129. doi: 10.1007/BF00117662. [DOI] [PubMed] [Google Scholar]
- 11.Thayer S S, Björkman O. Photosynth Res. 1990;23:331–343. doi: 10.1007/BF00034864. [DOI] [PubMed] [Google Scholar]
- 12.Debreczeny M P, Wasielewski M R, Shinoda S, Osuka A. J Am Chem Soc. 1997;119:6407–6414. [Google Scholar]
- 13.Andersson P O, Gillbro T. J Chem Phys. 1995;103:2509–2519. [Google Scholar]
- 14.Young A J, Phillip D, Ruban A V, Horton P, Frank H A. Pure Appl Chem. 1997;69:2125–2130. [Google Scholar]
- 15.Ruban A V, Young A J, Horton P. Biochemistry. 1996;35:674–678. doi: 10.1021/bi9524878. [DOI] [PubMed] [Google Scholar]
- 16.Kwa S L S, Groeneveld F G, Dekker J P, van Grondelle R, van Amerongen H, Lin S, Struve W S. Biochim Biophys Acta. 1992;1101:143–146. [Google Scholar]
- 17.Britton G. In: Carotenoids. Britton G, Liaaen-Jensen S, Pfander H, editors. 1B. Basel: Birkhäuser; 1995. pp. 13–64. [Google Scholar]
- 18.Andersson P-O, Bachilo S M, Chen R-L, Gillbro T. J Phys Chem. 1995;99:16199–16209. [Google Scholar]
- 19.Fujii R, Onaka K, Kuki M, Koyama Y, Watanabe Y. Chem Phys Lett. 1998;288:847–853. [Google Scholar]
- 20.Birge R R. Acc Chem Res. 1986;19:138–146. [Google Scholar]


