

Abstract
This study addresses the problem of thermal stress development in bulky specimens during cryopreservation via vitrification (vitreous means glassy in Latin). While this study is a part of an ongoing effort to associate the developing mechanical stress with the relevant physical properties of the cryopreserved media and to its the thermal history, the current paper focuses exclusively on the role of temperature gradients. Temperature gradients arise due to the high cooling rates necessary to facilitate vitrification; the resulting non-uniform temperature distribution leads to differential thermal strain, possibly resulting in cracking. The cooling rate is assumed constant on the outer surface in this study, and the material properties are assumed constant. It is demonstrated that under these assumptions, mechanical stress develops only when the temperature distribution in the specimen approaches thermal equilibrium at a cryogenic storage temperature. It is shown that the maximum possible stresses for a given cooling rate can be computed with a simple thermo-elastic analysis; these stresses are associated with cooling to sufficiently low temperatures and are independent of the variation of viscosity with temperature. Analytic estimates for these stresses are obtained for several idealized shapes, while finite element analysis is used to determine stresses for geometries used in cryopreservation practice. Stresses that develop under a wider range of storage temperatures are also studied with finite element analysis, and the results are summarized with suitable normalizations. It is found that no stresses arise if cooling ceases above the set-temperature, which defines the transition from viscous-dominated to elastic-dominated behavior; the set-temperature is determined principally by the dependency of viscosity upon temperature. Strategies for rapidly reaching low temperatures and avoiding high stresses are inferred from the results.
Keywords: Vitrification, Solidification, Solid Mechanics, Thermal Stress, Set-Temperature
Introduction
Since the advent of transplantation science, cryopreservation has been recognized as a highly desirable method for facilitating availability of the highest quality material. This goal has been achieved in some cellular systems, but extrapolation to organized tissues and organs is fraught with additional problems that have only recently been addressed. Application of the principles of cryobiology to the growing needs of the emerging tissue engineering field, for example tissue-engineered blood vessels, has emphasized the need for greater understanding of the fundamentals of low temperature preservation as they apply to three-dimensional multi-cellular tissues. In particular, an understanding of the thermo-mechanical stresses that arise during cryopreservation of complex biological systems, and their tendency to cause fracture, is crucial for the development of improved methods of storage. This important aspect of cryobiology has thus far received little attention, whereas the basic tools necessary for the study of these fundamental problems have not been available.
Most theoretical studies of the development of mechanical stress during cryopreservation have presumed an elastic response in the tissue [1–5]. This assumption could be justified in the case of tissue crystallization, which is not typical in cryopreservation. In the case of a tissue permeated with a cryoprotective agent (CPA) and cooled at a sufficiently high rate, crystallization can potentially be avoided; instead, the material transitions to glass as it undergoes a steady but dramatic increase in viscosity. Glass transition in the context of cryopreservation is typically referred to as vitrification, where “vitreous” in Latin means glass. However, pure vitrification can only be associated with pure CPAs, while in the tissue-CPA system partial vitrification is expected, and the quality of vitrification is the subject matter of many cryobiology studies [6–8]. Analysis of mechanical stress during vitrification has been paid very little attention over the years, and only recent studies have begun to address modeling and worst case scenarios of mechanical stress during cryopreservation via vitrification [9–12]. The resulting mechanical stresses during vitrification can potentially exceed the strength of the material, leading to its fracturing, which is a significant barrier to the cryopreservation of three-dimensional multi-cellular tissues.
While the quality of cryopreservation is dependent on the level of mechanical stress developed in the tissue, vitrification as an alternative to cryopreservation has several potential advantages from the biological standpoint [6,7,13,14]. Here, ice crystallization can be avoided, which is known to be the cornerstone of cryoinjury. No appreciable degradation occurs over time in living matter trapped within a vitreous matrix, and vitrification is potentially applicable to all biological systems. However, vitrification is associated with a high CPA concentration, which is potentially very toxic, and CPA cocktails are currently studied by various research groups to overcome this obstacle. Other difficulties with vitrification are known to be associated with uniform permeation of the tissue with the CPA.
The current study represents another step in an ongoing effort to develop tools to quantify mechanical stress and the propensity for fracture during vitrification. Previous work focused on the consequences of constraining the thermal contraction of the vitrifying specimen; theoretical and experimental studies of a CPA droplet vitrifying on a substrate gave insight into the role of viscosity and the level of strain at which vitrified CPA may crack [12]. The constraining effect of vial walls on the thermal contraction of the contained CPA medium was later studied and used to rationalize crack propagation patterns in the CPA [10]. Also recently, the potential effect of partial vitrification and partial crystallization on cracking was investigated [11], including its dependency on various mechanical properties of the CPA. The current study sets aside effects of constraint and inhomogeneity in properties and addresses exclusively the effect of temperature gradients on stress and cracking in a homogeneous region of CPA. Significant temperature gradients arise when a specimen of a significant size is cooled from outside in and become increasingly severe as the cooling rate increases.
The current report starts with a presentation of the material model used, including the important variation in viscosity by over twelve orders of magnitude during vitrification. Next, the recently presented concept of the “set-temperature” is reviewed; this temperature represents the transition from viscous to elastic dominance of straining that is associated with rapidly rising viscosity. It is shown in the current study that the effect of temperature gradients is fully captured with merely an elastic analysis, if the specimen is cooled to well below the set-temperature. Elastic analysis is then applied to several cases, including close-form solutions for idealized shapes, and finite element analysis (FEA) for more complex geometries. From the close-form solutions, size limitations to avoid fractures, which depend on cooling rate, are identified. Finally, cooling to temperatures in the vicinity of the set-temperature, which must account for both viscous and elastic responses, is studied numerically.
Material Model and Solution Techniques
The cryopreserved medium is assumed to have uniform and isotropic physical properties, with the only exception of the viscosity, which is the key property associated with vitrification. The viscosity of CPAs is largely unknown, but limited data is available on DMSO, which is the key ingredient in many CPA cocktails. The viscosity of DMSO at various molar concentrations has been measured in the temperature range of 20°C to −45°C with falling ball viscometry [15]; the authors are unaware of viscosity measurements of DMSO at lower temperatures. While the physical properties of DMSO are concentration dependent, a reference concentration of 7.05M DMSO has been selected in the current study. This concentration has been demonstrated to have similar physical properties to two CPA cocktails currently under investigation in parallel studies: DP6 (3M DMSO, 3M propylene glycol, and 2.4 g/ℓ HEPES in EuroCollins solution) and VS55 (3.1M DMSO, 2.2M propylene glycol, 3.1M formamide, and 2.4 g/ℓ HEPES in EuroCollins solution) [12,16,17]. Nevertheless, results presented in the current study are rather general, and the conclusions presented in the current study are not limited to a specific CPA and concentration.
The viscosity of DMSO in the temperature range of interest (in the vicinity of the glass transition temperature, Tg) is orders of magnitude higher than that in the range of available experimental data [15]. While Tg is commonly measured with differential calorimetry techniques (DSC), an alternative definition of glass transition is the temperature at which the viscosity reaches a value of 1012 Pa-s (1013 Poise). In the absence of viscosity data on cryoprotectants at low temperatures, the following functional behavior is assumed in the current study [15]:
| (1) |
where η is the shear viscosity, and the parameters b = 8.607 K and T0 = 111.1 K are selected to best-fit the available experimental data on 7.05M DMSO at higher temperatures [12], and the glass transition temperature was taken to be −132°C, measured with DSC for 7.05M DMSO [16].
In uniaxial tension, the CPA is modeled with a simple visco-elastic law of the form:
| (2) |
where ε̇ is the strain rate, σ is the stress, E is the Young’s modulus, and β is the coefficient of thermal expansion. This model describes the total strain rate as a linear superposition of (from left to right in Eq. (2)) the elastic strain rate, the viscous strain rate, and the thermal strain rate [18]. The uniaxial stress-strain behavior is generalized to multi-axial stresses assuming an isotropic response; the viscous strains are assumed to be incompressible, and the transverse elastic strains are based on a Poisson ratio ν. For all numerical solutions the following parameters were used: E = 1 GPa, ν = 0.2, and β = 2×10⁻⁴ K−1. The Poisson ratio, ν, would describe the behavior at low temperatures when viscous flow has ceased, and the CPA has solidified and become highly brittle; the value chosen is typical of glass and other brittle materials [19]. For simplicity, the variation in the thermal expansion β with temperature [16,20], which was accounted for in earlier studies, is neglected here; β = 2×10⁻⁴ K−1 is a representative value at cryogenic temperatures. Preliminary data from experiments [unpublished] on the flow of DMSO near glass transition are consistent with the simple combination of linear elastic and Newtonian viscous behavior.
While the elastic solutions presented below for idealized geometries are based on exact closed-form solutions, solutions to more complex geometries and to visco-elastic problems were obtained using the general purpose finite element program, ANSYS 8.1. For axi-symmetric problems, elements of type Plane183 were used; for fully 3D problems, twenty-noded SOLID186 brick elements were used. In calculations that account for the viscous deformation, special steps were taken to accommodate the variation in viscosity over many orders of magnitude within the simulated temperature range as discussed in [10–11].
Transition from Viscous to Elastic Strain Regime
In a previous experimental study [12], droplets of CPA were cooled on a very stiff substrate to low temperatures at which fractures occurred. Due to the higher thermal expansion of the CPA compared to the substrate, the CPA droplet develops tensile stress. The droplet was modeled as a circular thin film; under this assumption, the stresses are equi-biaxial and uniform. The resulting stress in the CPA can be determined by integrating Eq. (2), adapted for biaxial stress, using the viscosity as a function of temperature given in Eq. (1). The resulting stress is presented in Fig. 1 along with the viscosity as a function of temperature. It can be seen from Fig. 1 that the stress in the droplet remains negligible at higher temperatures. Eventually, the stress increases and becomes linear with decreasing temperature, when the viscosity becomes sufficiently high. The set-temperature is defined as the temperature obtained by back extrapolating from the linear portion of stress down to a zero stress value, as illustrated in Fig. 1.
Figure 1.
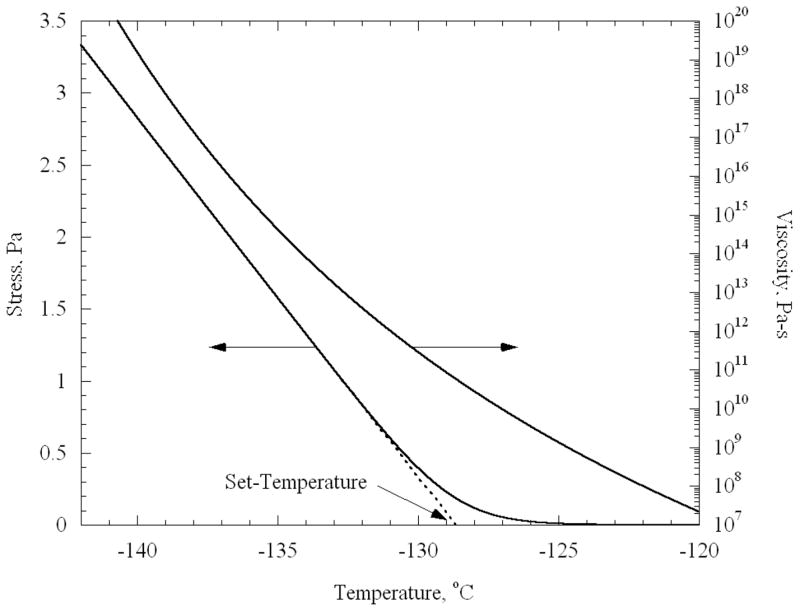
Temperature-dependent viscosity used in the current study, and the resulting stress in a thin film of CPA.
Based on the strain rate relationship presented in Eq. (1), the set-temperature can be estimated as the temperature at which the effects of viscous strain rate and elastic strain rate are similar in magnitude; this has been shown to take place when [Rabin et al., 2006]:
| (3) |
where H is the cooling rate. For a baseline case of E = 1 GPa and H = 1°C/min, one finds P equal to 0.988. Table 1 presents a comparison of set-temperatures obtained in two ways: (i) by direct integration of Eq. (2) for a thin film of CPA and back extrapolation, as illustrated in Fig. 1, and (ii) by using the estimate presented in Eq. (3), based on P=0.988. Good agreement is found between the two methods of calculation. The set-temperature is found to be a relatively weak function of E and H, due to the strong dependence of viscosity on temperature. Either way, given the viscosity function of Eq. (1) and the associated parameters b and T0, the set-temperature is found to be within a relatively narrow range, at least over the range of cooling rates relevant to cryopreservation and for the plausible range of elasticity modulus for CPA [12].
Table 1.
Comparison of the set-temperature calculated by back extrapolation of the linear portion of stress with temperature for constrained thin film of cryoprotectant, Tset,film (see also Fig. 1), and approximated based on P=0.988 in Eq. (3), Tset,P=0.988.
| H, °C/min | E, GPa | Tset,film | Tset,P=0.988 |
|---|---|---|---|
| 1 | 10 | −130.6 | −130.6 |
| 1 | 100 | −132.3 | −132.3 |
| 1 | 1000 | −133.6 | −133.8 |
| 10 | 1 | −126.5 | −126.6 |
| 100 | 1 | −124.1 | −124.1 |
| 1000 | 1 | −121.1 | −121.4 |
It has thus been established that the set-temperature is a useful indicator of the relative contributions to deformation. Well above the set-temperature, the elastic strain rate is insignificant, and the material behaves practically as a fluid. By contrast, well below the set-temperature, the viscous strain is insignificant, and the material behaves practically as an elastic solid. This transition in behavior is critical to rationalizing two distinct responses to the temperature gradients induced by the cooling protocol.
The effect of cooling is captured in this study through a simple thermal history: a constant cooling rate on the specimen’s outer surface, starting from a uniform initial temperature distribution, down to a prescribed storage temperature; the outer surface temperature remains constant thereafter. With temperature-independent properties, a quasi-steady distribution of temperature is reached during the period of cooling, with the temperature at all points decreasing at the same constant rate as the outer surface. If this steady distribution is achieved during sufficiently high temperatures, no stresses will exist in the material as it is cooled steadily to arbitrarily low temperatures, since the thermal strains are decreasing uniformly in space. Once the temperature at the outer surface reaches the storage temperature and is held constant, the temperature distribution in the domain gradually equilibrates towards a uniform final temperature distribution (the term “thermal equilibrium” is used in the text below in reference to a uniform temperature distribution in the domain, equal to the storage temperature). If this storage temperature is well below the set-temperature, then upon approaching thermal equilibrium, the body will develop stresses that correspond to the thermo-elastic problem of transitioning from the non-uniform, stress-free temperature distribution, associated with the constant cooling rate, to the final uniform temperature distribution. However, if the storage temperature is nearer to the set-temperature, the deformations associated with temperature equilibration includes viscous and elastic strains occurring simultaneously, which must both be included in the analysis.
Figure 2 presents results of a representative process of cooling a bag of CPA well below the set-temperature. While the specific parameters of the particular case are described in detail below (in the Numerical Solutions for Practical Shapes section), Fig. 2 is discussed here in a qualitative manner only, for the purpose of identifying the effects of quasi-steady cooling (constant cooling rate) and equilibration of temperature. A cross section of the CPA containing bag is illustrated in the inset of Fig. 2, where the geometrical center point A and a point on the surface B are identified. As discussed above, stresses only begin to rise when cooling of the outer surface ceases and is held at constant temperature thereafter; these stresses are dictated by the elastic response of the material during the subsequent thermal equilibration.
Figure 2.

Representative thermal and stress histories for cooling a pillow-like rectangular bag (Fig. 3) containing CPA; the inset schematically illustrates a cross section of the bag, where A is the geometrical center point.
Analysis of Elasticity Below the Set-Temperature
Analytical results for ideal shapes of an infinite plate, an infinite cylinder, and a solid sphere are presented in the next sub-section. Numerical results for the more practical shapes of a finite cylinder (representing a vial of CPA) and two pillow-like shapes (representing a bag of CPA) are presented in the following sub-section.
Analytic Solutions for Ideal Shapes
For the ideal shapes, the temperature distribution during steady cooling and the stress distribution after thermal equilibration are dependent on a single coordinate. The temperature distribution is given by:
| (4) |
where α is the thermal diffusivity (k/ρcp), t is the time and, x is the relevant coordinate, and n equals 0, 1, and 2 for the Cartesian, cylindrical, and spherical geometry, respectively. Equation (4) is subject to the boundary condition of:
| (5) |
where Ω is the outer surface, Ts is the storage temperature, Ti is the initial temperature, and H is the cooling rate.
The solutions to the ideal shapes subject to zero normal and shear stresses at the boundary, are given by Boley and Weiner [21] for an arbitrary function of temperature; in those solutions, the stresses are zero at an initial uniform temperature. In the current study, however, the initial stress distribution is zero, while the initial temperature distribution is non-uniform, corresponding to the quasi-steady temperature distribution resulting from Eqs. (4)–(5); stresses develop only as the temperature distribution equilibrates to the storage temperature, as described above. Hence, the final stress distributions are identical in magnitude, but negative in sign, to the stress distributions obtained by substituting the solutions to Eqs. (4)–(5) for the temperature distribution into the equations presented by Boley and Weiner [21].
It can be seen from Eq. (4) that if the cooling rate is constant, the temperature distribution is parabolically dependent on x, and the maximum temperature difference is dependent on d squared:
| (6) |
where the coefficient f is listed in Table 2. The characteristic length is the thickness for an infinite plate, and the diameter for a sphere and an infinite cylinder.
Table 2.
| Plate | Cylinder | Sphere | |
|---|---|---|---|
| f | 1/8 | 1/16 | 1/24 |
| g | 1/3 | 1/2 | 2/5 |
The order of magnitude of temperature differences that can be produced may be deduced as follows. The thermal conductivity, k, of 7.05M DMSO at 273 K is 0.2 W/m-K [22], while its value at very low temperatures is unknown; this value can impact the result substantially. Since DMSO is a water-based solution, and since the thermal conductivity of water increases exponentially with decreasing temperature [23], a similar dependency might be assumed for DMSO [10]. Thus, the thermal conductivity of DMSO is assumed to be similar to that of ice, but shifted down to agree with the thermal conductivity value of DMSO at 273 K. It follows that the actual values for conductivity plausibly lies in the range of 0.2 W/m-K and 6.5 W/m-K [10]. The density and specific heat are given representative values of 1100 kg/m3 and 2400 J/kg-K [10]. For the case of a cylinder, for example (f = 1/16), a temperature difference of 25°C is produced for a vial diameter of 25 mm, cooling rate of 45°C/min, and thermal conductivity of 3 W/m-K; this case is studied below. Note that a much more substantial temperature difference would arise with the same cooling rate at higher temperatures, when the thermal conductivity is lower. While the underlying assumption that a steady-state temperature distribution is achieved might be questioned with such large temperature differences, the consequences of relaxing this assumption are left for future studies.
The maximum tensile stress corresponds to the in-plane stress for the plate, the axial stress for the cylinder, and the circumferential stress for the sphere; in all shapes, the stress is maximum at the geometric center of the domain. From the equations in [21], the resulting maximum stresses for these ideal shapes can be presented in the form:
| (7) |
where the coefficient g is listed in Table 2 for various geometries.
Numerical Solutions for Practical Shapes
To test its accuracy, FEA was applied to the prediction of the stresses in a plate and a sphere, subject to a constant cooling rate. This analysis predicted stresses that differed from the analytical result of Eq. (7) by only 0.3% and 0.1%, respectively. With these reassuring results, FEA was applied to the pillow-like shapes illustrated in Fig. 3, and to two cases of finite cylinders having length-to-diameter ratios of 9/5 (consistent with the vial used for prior studies [24]) and 1 (designated as the squat cylinder). Circular and rectangular pillow-like shapes were modeled as having maximum thickness 2h, with parabolic surfaces of the form:
Figure 3.

Schematic illustration of pillow-like shapes analyzed by FEA: (a) cross section of the pillow, (b) top view of a circular pillow, Eq. (8), and (c) top view of a rectangular pillow, Eq. (9).
| (8) |
| (9) |
as illustrated in Fig. 3. For heart valve cryopreservation, reasonable values of 2Lx = 122 mm, 2Ly = 85 mm, and h = 13 mm, were selected. Since the rectangular pillow-like bags are sealed in various ways to produce different ratios of Ly/Lx, and for purpose of simplicity in this study, only the square case of 2Lx = 122 mm, 2Ly = 122 mm, and h = 13 mm is considered. The circular pillow (R = 61 mm, and h = 13 mm) is given here for comparison purposes only, which has no direct application to cryopreservation.
The infinite cylinder solution over-predicts the maximum temperature difference in the vial by 3%, and the infinite flat plate solution over-predicts the maximum temperature difference in the rectangular pillow by 7%; the latter solution over-predicts the maximum temperature difference in the circular pillow by 1%. The maximum temperature difference in the squat cylinder is between the predictions of an infinite cylinder and a sphere having the same radii. Comparisons for the maximum stress, normalized by EβΔT/(1−ν), are listed in Table 3, where the temperature difference ΔT was taken from FEA. For the most part, maximum stresses from the idealized shapes serve as reasonable approximations for those found from the more realistic shapes. One exception is the pillow-like shapes, where the predicted stresses are up to 50% higher than the corresponding flat plate solution.
Table 3.
Maximum stress normalized by EβΔT/(1−ν): comparison of FEA predictions and analytical results by Eq. (7) for an infinite cylinder, σic, sphere, σs, and an infinite plate, σip. Axial stress is maximum for vial and squat cylinder; in-plane stress is maximum for the pillow-like shapes.
| Configuration | FEA | Ideal Shape Approximation |
|---|---|---|
| Vial (h/d = 9/5) | 0.52 | σic = 0.5 |
| Squat cylinder (h/d = 1) | 0.43 | σic = 0.5, σs = 0.4 |
| Pillow (square) | 0.48 | σip = 0.33 |
| Pillow (circular) | 0.45 | σip = 0.33 |
Critical Characteristic Length for Fracture
It is commonly accepted that fracture is more likely to occur when the cooling rate is higher and the cryopreserved specimen is larger; this is consistent with the stress dependency exhibited in Eqs. (6)–(7). Quantitative estimates of the propensity for fracture can be obtained if the maximum tensile stress reached is compared with the critical stress for fracture σcrit. Alternatively, the critical characteristic length, dcrit, above which the specimen is likely to fracture, can be calculated from:
| (10) |
To gain insight into the critical characteristic length of the ideal shapes, Eq. (10) was evaluated and the following material properties were applied. Based on experiments and analysis of the spontaneous fracture of a thin film of DMSO on a cooling substrate [12], a critical stress of 3.2 MPa was assumed; this corresponded to an elastic modulus value of 1 GPa, to which the inferred critical stress is proportional.
Figure 4 presents the critical characteristic length as a function of the cooling rate, for the ideal shapes, and for two extreme values of thermal conductivity, k = 0.2 W/m-K and 6.5 W/m-K. It can be seen from Fig. 4 that the critical characteristic length is strongly dependent upon the thermal conductivity. For example, for a cooling rate of 20°C/min, the critical characteristic length varies by an order of magnitude from 10 mm to 100 mm. It can further be seen that a spherical shape generates the lowest stress, and that an infinite plate generates the highest stress, out of the three cases under consideration; thus the former permits a greater critical size then the latter. However the thermal conductivity effect overwhelms the shape effect, in the range of properties studied here. For each set of conditions, the critical characteristic length is inversely proportional to the square root of the cooling rate, Eq. (8).
Figure 4.
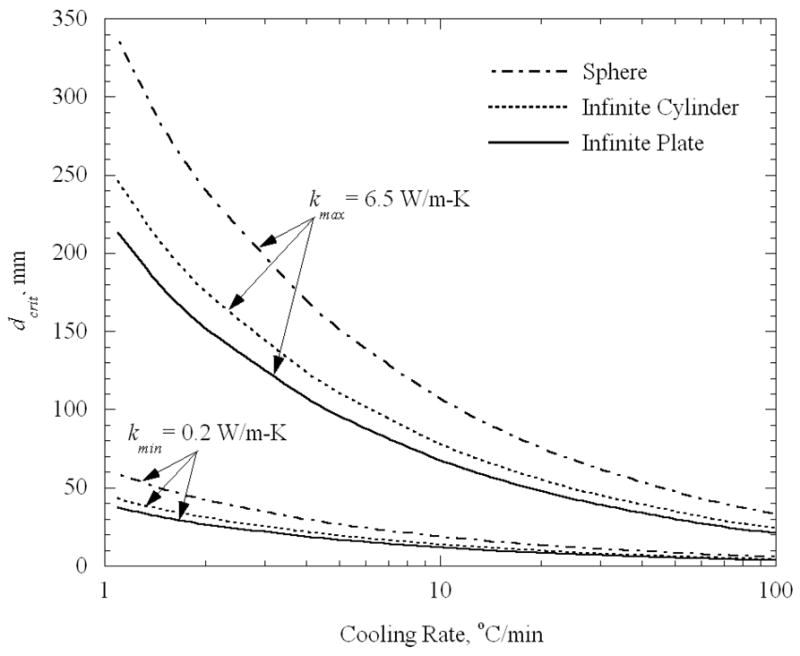
Critical characteristic length as a function of the cooling rate for extreme values of thermal conductivity of 0.2 W/m-K and 6.5 W/m-K (corresponding to a critical stress level of 3.2 MPa, taken from [12]).
Stresses upon Cooling to Intermediate Temperatures
The discussion now turns to the effect of the storage temperature on stress. Thus far, the specimen was presumed to be cooled at a constant cooling rate to well below the set-temperature, where the viscosity is effectively infinite. If cooling of the specimen is to be halted at higher temperatures, in the vicinity of the set-temperature, the resulting stresses would be lower.
Figure 5 presents results for a finite cylinder representing a vial, with a 25°C temperature difference between the outer surface and the center during steady cooling. The axial stress σz is plotted in Fig. 5 for several radial locations across the central plane of the vial as a function of the storage temperature; this is the stress reached when the distribution throughout the volume has effectively equilibrated to the storage temperature. (After a very long period of time, the stresses would relax to zero if storage temperature were not sufficiently low.) Notice that no stress develops if the storage temperature is too high. In addition, all stresses approach asymptotically the values corresponding to fully elastic stress development (addressed in the previous section) if the storage temperature is sufficiently low.
Figure 5.

Axial stress at the mid-height of a finite cylinder after it reaches thermal equilibrium, as a function of the storage temperature. The various curves represent the stress at several radial locations, where the cylinder height is 45 mm, its diameter is 25 mm, the cooling rate is 45°C/min, and the maximum temperature difference across the cylinder is 25°C.
Note that stresses begin to rise only when the storage temperature reaches −127.0°C. For the cooling rate that produces a 25°C difference in the vial (H = 45°C/min), and for an elastic modulus of 1 GPa, the set-temperature was determined from Eq. (3) to be −125.0°C. Thus, the set-temperature determined for a thin film on a substrate [12] has relevance to the current, quite distinct but technologically important, problem of stress development due to temperature gradients in a vial. Note that the center point in the domain has the highest tensile stress regardless of the final temperature. The same behavior is observed for the cases of the plate and the sphere (Fig. 6 and 7). Using the appropriate cooling rates of 50°C/min and 66°C/min, the set-temperature is determined to be −124.9°C and −124.6°C for the plate and sphere, respectively, therefore it is not surprising that the stress tends to rise from zero at approximately the same temperature of −127°C. For the purpose of a more detailed analysis, a “transition temperature” is defined in the current study, as the storage temperature at which the stress first begins to rise noticeably upon thermal equilibration. While the transition temperature cannot be quantified precisely, it approximately equals −127°C in the current case, which is a few degrees below the set-temperature. One could expect the stresses to depend on the temperature difference between the storage temperature and the transition temperature, as well as on the maximum temperature difference within the body during constant cooling.
Figure 6.

In-plane stress in an infinite plate after it reaches thermal equilibrium, as a function of the storage temperature. The various curves represent the stress at several distances from the plate centerline, where the plate thickness is 2.5 mm, the cooling rate is 50°C/min, and the maximum temperature difference across the plate is 25°C.
Figure 7.
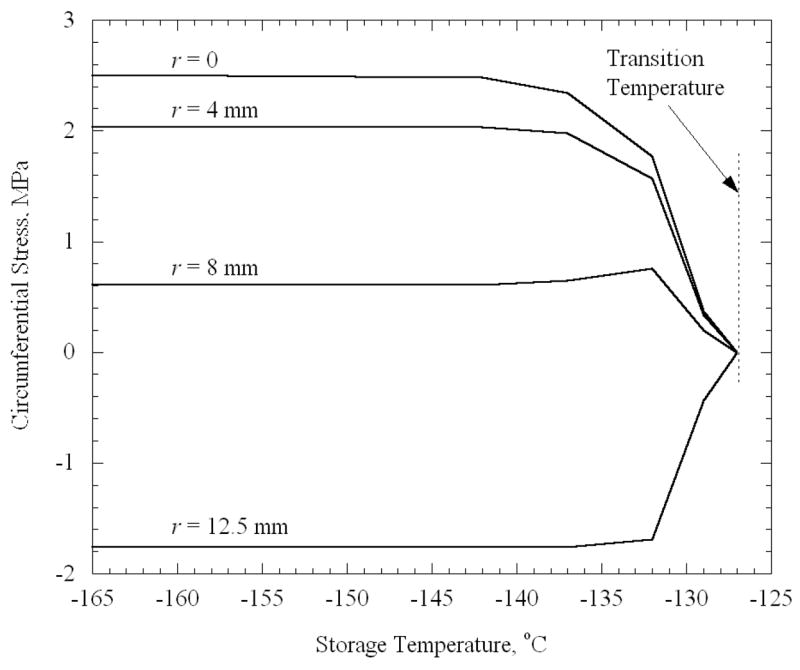
Circumferential stress in a sphere after it reaches thermal equilibrium as a function of the storage temperature. The various curves represent stress at several radial locations, where the sphere diameter is 25 mm, the cooling rate is 66°C/min, and the maximum temperature difference is 25°C.
To allow one to approximate stress for intermediate storage temperatures, while avoiding the need to repeatedly perform full scale viscoelastic calculations, which are computationally expensive, results are re-plotted in Fig. 8 as normalized stress versus dimensionless storage temperature. Here, the stress is normalized by its elastic value, corresponding to the same geometry and same temperature difference between inside and outside. The dimensionless storage temperature is defined as:
Figure 8.

Maximum normalized stress as a function of dimensionless storage temperature, Eq. (12), for ideal shapes.
| (12) |
where Ttrans is the transition temperature, Tstorage is the storage temperature, and ΔT is the maximum temperature difference during steady cooling. The dimensionless storage temperature indicates the extent to which the body is cooled below transition, relative to the temperature difference between the outside and inside during steady cooling. At θ = 1, the center point of the domain (the point for which stresses are presented) reaches transition just as the steady cooling ceases. The maximum temperature difference during constant cooling is 25°C for all the cases shown in Fig. 8. While the curves for the different cases presented in Fig. 8 differ in details, they display a similar general trend, that the stress exceeds 90% of its elastic value before θ = 1.
Based on the current observations, a method of approximating the maximum stress, for other parameter values and viscosity functions of temperature, is proposed as follows. First, elastic calculations (requiring no viscoelastic analysis) are to be performed for the geometry in question. These calculations may be performed for a single cooling rate, since the stresses are linearly proportional to the cooling rate, provided that there is sufficient time for a quasi-steady temperature distribution to develop. (One may further choose to use one of the idealized shapes presented above.) Next, the set-temperature is determined, either through integration of Eq. (2), or through the approximation discovered above, namely P = 0.988; either way, the appropriate viscosity function of temperature must be used. Based on the current results for DMSO, the transition temperature at which the stresses first start rising is estimated as 2°C below the set-temperature. Finally, the normalized stress as a function of the dimensionless temperature presented in Fig. 8 is used to estimate the specific maximum stress developed in the specimen.
To validate the new method of approximating the maximum stress, several additional cases for the vial shape were studied. As discussed above, the thermal conductivity at low temperatures is associated with a significant level of uncertainty, which may have an impact on the calculated stress, where the temperature gradient increases with decreasing thermal conductivity. (The specific heat is assumed constant in the current case; therefore, the thermal conductivity is proportional to the thermal diffusivity). Here, calculations were carried out for cooling to a specific storage temperature of −132 °C, for various cooling rates and thermal conductivity values. In all cases, the set-temperature was recomputed (for the given cooling rate), and the transition temperature was set to be 2°C below the set-temperature. The temperature difference is distinct for each set of parameters; this difference determines the elastic stress and, hence, the normalization of the stress and the storage temperature. It can be seen in Fig. 9 that for all studied cases, the new results agree very well with the baseline curve of normalized stress versus dimensionless storage temperature (H = 45°C/min and k = 3 W/m-K). These results validate the proposed simplified method of maximum stress approximation.
Figure 9.
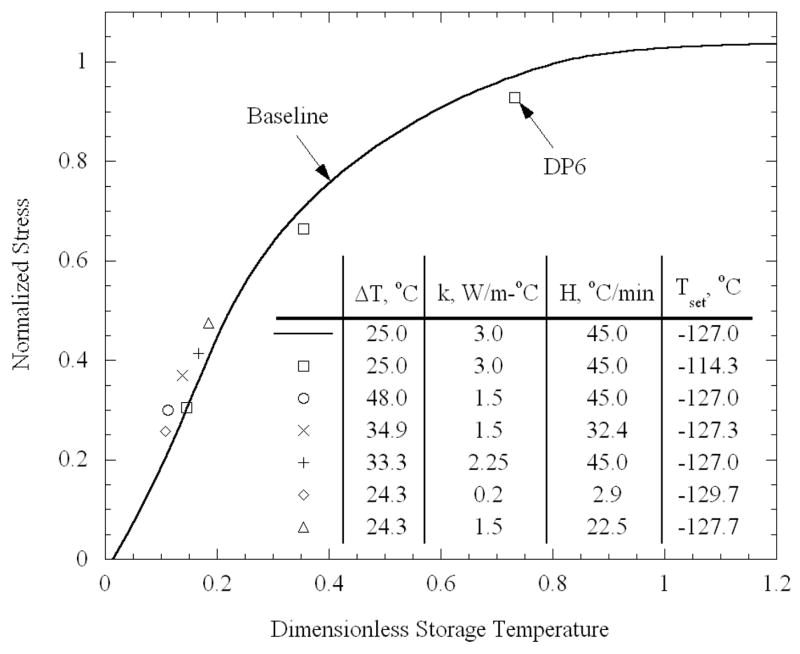
Comparison of normalized stress as a function of the dimensionless storage temperature, Eq. (12), subject to various thermal parameters; all results correspond to a cylinder having a length of 45 mm and a diameter of 25 mm, representative of a vial in previous studies [10]. Except for the three data points identified for the CPA cocktail DP6, all other data points refer to DMSO properties.
As a second validation test for the method, the effect of a different CPA, DP6, was analyzed. The temperature-dependence of the viscosity of DP6 was fit to Eq. (1) in a previous study [12], with b = 5.45 K and T0 = 132.3 K. The set-temperature was found by integration to be −116.3 °C, for the baseline case of E = 1 GPa and H = 1°C/min; the ratio of P was found to be 0.990, nearly the same value as for DMSO. Using the viscosity function of temperature for DP6, stresses were determined by means of FEA for the vial shape, when cooled to three different storage temperatures, and subject to the same temperature difference of 25°C (H = 45°C/min and k = 3 W/m-K). The normalizing elastic stresses are the same for DP6 as they were for DMSO, and are independent of the viscosity. The dimensionless storage temperature requires the transition temperature, which is estimated as 2°C below the set-temperature, following the procedure described above. The set-temperature for DP6 in this case, was found to be −113.4 °C, using the fixed value of the ratio P. Therefore, the transition temperature was presumed to be −115.4 °C. The dimensionless storage temperature corresponding to the three different storage temperatures, as well as the stresses, are also presented in Fig, 9. It can be seen from Fig. 9 that good agreement is found between the new data points and the previously drawn curve for DMSO, further supporting the generality of the newly proposed method.
Summary and Conclusions
To gain insight into the propensity for cracking to occur during cryopreservation via vitrification, stresses which develop in a mass of cryoprotectant, subject to a constant cooling rate down to a pre-set storage temperature, have been studied. The temperature dependent viscosity is shown to play a critical role in the development of stresses. In particular, the recently defined set-temperature, which depends primarily on the temperature dependency of viscosity, separates the storage temperature into stress development regimes. Negligible stresses arise when the storage temperature is above the set-temperature, while far below the set-temperature, stresses approach levels that are independent of the viscosity and can be determined by merely an elastic analysis. At temperatures slightly below the set-temperature, analysis accounting for both viscous and elastic straining is necessary.
For storage temperatures far below the set-temperature, the stresses have been found to be proportional to the cooling rate, the elastic modulus, the characteristic dimension of the domain to the second power, and the thermal expansion coefficient; these stresses are inversely proportional to the thermal conductivity. Analytic expressions for the stress have been found for simple shapes, which are demonstrated to be credible approximations for stresses in more complex shapes, where the latter can only be found from computationally expensive FEA. FEA simulations accounting for viscoelastic material behavior were used to determine stresses when the storage temperature is not well below the set-temperature. A normalization of stress and storage temperature approximately condenses the predicted stresses, as shown for a number of different geometries and cooling conditions, enabling one to estimate stresses for the entire range of storage temperatures, without resorting to viscoelastic analysis. Stresses are found to approach those based on elastic modeling, provided that the location of highest temperature (usually at the center of the domain) exceeds the set-temperature during the period of steady cooling.
This work has indicated the importance of measuring the key properties of CPAs, such as viscosity and thermal conductivity, in the cryogenic temperature range. The current study suggests potential strategies for simplified calculations of mechanical stresses, with the goal of establishing tools for efficient optimization of cryopreservation. Specifically, it is demonstrated that one could produce very low stresses by cooling down very rapidly to just above the set-temperature and allowing thermal equilibration to occur; further cooling could then be accomplished much more slowly to the final temperature. Experiments to test this prediction are also underway.
Acknowledgments
This study has been supported by National Heart Lung and Blood Institute - NIH, grant number R01 HL069944-01,02,03,04.
References
- 1.Lin S, Gao DY, Yu XC. Thermal Stress Induced by Water Solidification in a Cylindrical Tube. ASME J of Heat Trans. 1990;112:1079–1082. [Google Scholar]
- 2.Rubinsky B, Cravalho EG, Mikic B. Thermal Stress in Frozen Organs. Cryobiology. 1980;17:66–73. doi: 10.1016/0011-2240(80)90009-7. [DOI] [PubMed] [Google Scholar]
- 3.Gao DY, Lin S, Watson PF, Crister JK. Fracture phenomena in an isotonic salt solution during freezing and their elimination using glycerol. Cryobiology. 1995;32:270–284. doi: 10.1006/cryo.1995.1026. [DOI] [PubMed] [Google Scholar]
- 4.Rabin Y, Steif PS. Thermal stress modeling in cryosurgery. International Journal of Solids and Structures. 2000;37:2363–2375. [Google Scholar]
- 5.Rabin Y, Steif PS. Analysis of thermo-mechanical stress in cryopreservation. CryoLetters. 2005;26(6):409–411. [PMC free article] [PubMed] [Google Scholar]
- 6.Taylor MJ, Song YC, Brockbank KGM. Vitrification in tissue preservation: new developments. In: Fuller BJ, Lane N, Benson EE, editors. Life in the Frozen State. CRC Press; New York: 2004. pp. 603–641. [Google Scholar]
- 7.Fahy GM, MacFarlane DR, Angell CA, Meryman HT. Vitrification as an approach to cryopreservation. Cryobiology. 1984;21:407–426. doi: 10.1016/0011-2240(84)90079-8. [DOI] [PubMed] [Google Scholar]
- 8.Pegg DE, Wusteman MC, Boylan S. Fractures in cryopreserved elastic arteries. Cryobiology. 1997;34(2):183–192. doi: 10.1006/cryo.1996.1997. [DOI] [PubMed] [Google Scholar]
- 9.Steif PS, Palastro M, Wen CR, Baicu S, Taylor MJ, Rabin Y. Cryomacroscopy of vitrification, Part II: Experimental observations and analysis of fracture formation in vitrified VS55 and DP6. Cell Preservation Technology. 2005;3(3):184–200. doi: 10.1089/cpt.2005.3.184. Website in conjunction with this paper: http://www.me.cmu.edu/faculty1/rabin/CryomacroscopyImages01.html. [DOI] [PMC free article] [PubMed] [Google Scholar]
- 10.Steif PS, Palastro MC, Rabin Y. Continuum mechanics analysis of fracture progression in the vitrified cryoprotective agent DP6. ASME Biomechanical Engineering. 2007 doi: 10.1115/1.2898716. in press. [DOI] [PMC free article] [PubMed] [Google Scholar]
- 11.Steif PS, Palastro MC, Rabin Y. Analysis of the effect of partial vitrification on stress development in cryopreserved blood vessels. Medical Engineering & Physics. 2007;29(6):637–728. doi: 10.1016/j.medengphy.2006.07.010. [DOI] [PMC free article] [PubMed] [Google Scholar]
- 12.Rabin Y, Steif PS, Hess KC, Jimenez-Rios JL, Palastro MC. Fracture formation in vitrified thin films of cryoprotectants. Cryobiology. 2006;53:75–95. doi: 10.1016/j.cryobiol.2006.03.013. Website in conjunction with this paper: http://www.me.cmu.edu/faculty1/rabin/CryomacroscopyImages02.html. [DOI] [PMC free article] [PubMed] [Google Scholar]
- 13.Luyet BJ. The Vitrification of Organic Colloids and of Protoplasm. Biodynamica. 1937;1(29):1–14. [Google Scholar]
- 14.Song YC, Khirabadi BS, Lightfoot FG, Brockbank KGM, Taylor MJ. Vitreous cryopreservation maintains the function of vascular grafts. Nature Biotechnology. 2000;18:296–299. doi: 10.1038/73737. [DOI] [PubMed] [Google Scholar]
- 15.Schichman SA, Amey RL. Viscosity and local liquid structure in dimethyl sulfoxide - water mixtures. J of Phys Chem. 1971;75(1):98–102. [Google Scholar]
- 16.Plitz J, Rabin Y, Walsh JR. The effect of thermal expansion of ingredients on the cocktails VS55 and DP6. Cell Preservation Technology. 2004;2(3):215–226. [Google Scholar]
- 17.Rabin Y, Plitz J. Thermal expansion of blood vessels and muscle specimens permeated with DMSO, DP6, and VS55 in cryogenic temperatures. Annals of Biomedical Engineering. 2005;33(9):1213–1228. doi: 10.1007/s10439-005-5364-0. [DOI] [PubMed] [Google Scholar]
- 18.Malvern LE. Introduction to the mechanics of a continuous medium. Prentice-Hall, Englewood Cliffs; New Jersey: 1969. [Google Scholar]
- 19.Richerson DW. Modern ceramic engineering: properties, processing, and use in design. Marcel Dekker, Inc; New York: 1992. [Google Scholar]
- 20.Jimenez Rios JL, Rabin Y. Thermal expansion of blood vessels in low cryogenic temperatures. Part II: Measurements of blood vessels vitrified with VS55, DP6, and 7.05M DMSO. Cryobiology. 2006;52(2):284–294. doi: 10.1016/j.cryobiol.2005.12.006. [DOI] [PMC free article] [PubMed] [Google Scholar]
- 21.Boley BA, Weiner JH. Theory of Thermal Stresses. Wiley; New York: 1960. [Google Scholar]
- 22.Nieto-Draghi C, Avalos JB. Transport Properties of Dimethyl Sulfoxide Aqueous Solutions. Journal of Chemical Physics. 2003;119(9):4782–4789. [Google Scholar]
- 23.Rabin Y. The Effect of Temperature-Dependent Thermophysical Properties in Heat Transfer Simulations of Biomaterials in Cryogenic Temperatures. CryoLetters. 2000;21:163–170. [PubMed] [Google Scholar]
- 24.Rabin Y, Taylor MJ, Walsh JR, Baicu S, Steif PS. Cryomacroscopy of vitrification, Part I: A prototype and experimental observations on the cocktails VS55 and DP6. Cell Preservation Technology. 2005;3(3):169–183. doi: 10.1089/cpt.2005.3.169. Website in conjunction with this paper: http://www.me.cmu.edu/faculty1/rabin/CryomacroscopyImages01.html. [DOI] [PMC free article] [PubMed] [Google Scholar]