

Abstract
As immune responses in the CNS are highly regulated, cell-specific differences in IFNγ signaling may be integral in dictating the outcome of host cell responses. In comparing the response of IFNγ-treated primary neurons to control MEF, we observed that neurons demonstrated lower basal expression of both STAT1 and STAT3, the primary signal transducers responsible for IFNγ signaling. Following IFNγ treatment of these cell populations, we noted muted and delayed STAT1 phosphorylation, no detectable STAT3 phosphorylation, and a 3-10-fold lower level of representative IFNγ-responsive gene transcripts. Moreover, in response to a brief pulse of IFNγ, a steady increase in STAT1 phosphorylation and IFNγ gene expression over 48 h was observed in neurons, as compared to rapid attenuation in MEF. These distinct response kinetics in IFNγ-stimulated neurons may reflect modifications in the IFNγ negative feedback loop, which may provide a mechanism for the cell-specific heterogeneity of responses to IFNγ.
Keywords: cytokine, signal transduction, gene regulation, neuron, interferon gamma, STAT1, STAT3
1. INTRODUCTION
Interferon gamma (IFNγ), a pluripotent cytokine made primarily by T cells and NK cells, triggers the induction of genes that lead to antiviral and antibacterial responses, and modulates the expression of genes governing immune function, including components of the MHCI and MHCII antigen presentation pathways. IFNγ plays a crucial role in noncytolytic clearance of viruses in the “immune-privileged” environment of the central nervous system (CNS), including vesicular stomatitis virus (VSV) (Komatsu et al., 1996), measles virus (Patterson et al., 2002), Theiler’s murine encephalomyelitis virus (Rodriguez et al., 2003), Sindbis virus (Burdeinick-Kerr and Griffin, 2005), and West Nile virus (Shrestha et al., 2006). IFNγ is also crucial for the resolution of some intracellular bacterial infections within the brain (Jin et al., 2004). However, IFNγ has also been implicated in the immunopathogenesis of demyelinating diseases such as multiple sclerosis (reviewed in Sanders and De Keyser, 2007), ischemia (Takagi et al., 2002), and other neurodegenerative disorders, such as Alzheimer’s Disease (Bate et al., 2006). Moreover, IFNγ also plays a key role in CNS homeostasis, development, and neurotransmitter receptor expression (Barish et al., 1991; Kraus et al., 2006; Wong et al., 2004).
Activation of IFNγ-stimulated gene expression occurs via a well-characterized signal transduction pathway (reviewed in Darnell, 1997 and Stark et al., 1998). Briefly, IFNγ binding and subsequent assembly of its receptor complex (consisting of a heterotetramer of IFNγR1 and R2 subunits), stimulates the activation of receptor-associated JAK1 and JAK2 protein tyrosine kinases, resulting in the tyrosine phosphorylation of the cytoplasmic tail of the IFNγR1 subunits. Upon docking to the phosphorylated R1 subunit, signal transducer and activator of transcription (STAT)-1 is phosphorylated on tyrosine 701 (pY701), resulting in its homodimerization. The STAT1(pY701) homodimer then translocates to the nucleus and binds to Gamma Activated Sequence (GAS) elements within the promoters of IFNγ-responsive genes, thus influencing their expression. In addition to STAT1, IFNγ stimulation also results (to a lesser degree) in phosphorylation of STAT3. Upon activation, STAT3 can homodimerize or form a heterodimer with phosphorylated STAT1, translocate to the nucleus and also bind to GAS elements.
In spite of the relatively straightforward nature of these well-characterized signal transduction pathways, the cellular response to IFNγ is complex and cell-specific. The genes that are induced in IFNγ-stimulated cells can result in a wide range of consequences, including cellular activation, proliferation, or the induction of apoptosis (reviewed in Stark et al., 1998). While it is clear that IFNγ can elicit varied outcomes, the mechanisms governing the way a given cell responds to IFNγ remain largely unclear. Previous studies have examined differences in GAS element binding and transcription factor specificity (e.g. Horvath et al., 1995; reviewed in Ramana et al., 2000; Schroder et al., 2004) to elucidate mechanisms of cell-specific responses to IFNγ. In addition, many of the studies characterizing the IFNγ response have focused on a single cell type (such as hepatocytes, fibroblasts, or transformed cell lines). This has resulted in the impression that the cytoplasmic signaling pathways triggered in response to IFNγ are somewhat generic, and potential cellular or developmental differences in upstream IFNγ signaling events have therefore been largely overlooked. Recently however, Qing and Stark demonstrated that in the absence of STAT1, IFNγ signals through STAT3 and induces overlapping but distinct gene products (Qing and Stark, 2004). These investigators proposed that differential use of signaling pathways could therefore explain some of the differences observed in IFNγ responses by diverse cell types. In addition, Costa-Pereira et al. demonstrated that cell lines expressing two IFNγ receptors differing in a single amino acid showed altered kinetics of STAT phosphorylation, which resulted in diverse profiles of downstream gene transcription (Costa-Pereira et al., 2005).
While a number of studies underscore the ability of neurons to make and respond to both type I and type II interferons (Chesler et al., 2004; Delhaye et al., 2006; Goody et al., 2007; Massa et al., 1999; Samuel et al., 2006; Trottier et al., 2005; Wang and Campbell, 2005; Yang et al., 2006), a direct comparison of IFNγ signaling in otherwise unmanipulated primary cells of varied tissue origin is lacking. Because immunity in the CNS is highly regulated, cell-specific differences in IFNγ signaling pathways may be particularly important in dictating the outcome of the host cell response in various pathogenic settings. We have therefore directly and quantitatively compared the responses of primary hippocampal neurons and matched primary fibroblasts to IFNγ. We have investigated expression and phosphorylation of STAT1 and STAT3, as well as the duration of the cellular response to IFNγ. We found that the neuronal response was remarkably distinct from that of control fibroblasts, providing support for the notion that differences at the level of signal transduction exist between cell types of distinct tissue origin. Furthermore, we demonstrated alterations in the expression of several IFNγ-responsive genes in treated neurons and fibroblasts, underscoring the importance of both the timing and magnitude of STAT signaling pathways in orchestrating the cell-specific response to exogenous IFNγ.
2. MATERIALS AND METHODS
Cells and culture conditions
Primary hippocampal neurons were prepared from embryonic (E14-15) inbred, c57Bl/6 mice (Rall et al., 1997) as previously described (Banker and Goslin, 1991; Pasick et al., 1994; Rall et al., 1995), with the exception that neurons were maintained in serum-free neurobasal medium (Life Technologies, Grand Island, NY) supplemented with B27 supplement (Life Technologies), glutamate (4 μg/ml), penicillin (100 U/ml), streptomycin (100 ng/ml), and glutamine (2 mM) in the absence of an astrocyte feeder layer. These cultures are routinely >95% pure, as assessed by MAP-2 immunostaining. Primary mouse embryonic fibroblasts (MEF) were isolated from the same embryos and maintained in complete DMEM medium (DMEM supplemented with 10% fetal calf serum, 2 mM L-glutamine, 100 U/ml penicillin, and 100 ng/ml streptomycin). Briefly, liver tissue was excised and discarded, and the remaining tissue was then dissociated in 0.4% trypsin, followed by trituration with a 10 ml pipette. The suspension was incubated for 10 minutes at 37°C; 5 ml fresh trypsin was then added and the suspension was incubated for an additional 10 minutes at 37°C. The suspension was added to a 15 ml conical tube, in which undigested tissue was allowed to settle for 2 minutes. The supernatant (containing MEF) was mixed with complete DMEM medium and centrifuged at 400×g for 5 minutes. The resulting pellet was resuspended in complete DMEM medium and plated into culture flasks. All cells were maintained at 37°C, 5% CO2 in a humidified incubator.
“Continual” IFNγ treatment
Neurons were plated on poly-L-lysine (Sigma, St. Louis, MO) coated glass coverslips or poly-L-lysine coated tissue culture plastic at a density of 560 cells/mm2, and cultured for 5 days (unless specified otherwise). MEF were plated at a density of 280 cells/mm2 one day prior to treatment. On the day of treatment, the culture medium was supplemented with either recombinant mouse IFNγ (BD Biosciences Pharmingen, San Jose, CA; 100 U/ml in Dulbecco’s phosphate buffered saline (DPBS)), or with an equal volume of DPBS alone. Cells were incubated for the indicated times, and then lysed for protein or RNA isolation (described below).
“Pulsed” IFNγ treatment
Neurons and MEF were plated and treated as described above, with the exception that cells were incubated with or without IFNγ (100U/ml) for only 30 min. After incubation, cells were washed 10 times with DPBS, to ensure removal of exogenously-added IFNγ. Unsupplemented conditioned culture medium was then added back to the cells, which were incubated for the indicated times. At each timepoint, whole cell lysates were collected for immunoblot analysis or RNA isolation (described below).
IL-6 treatment
Neurons and MEF were prepared as above, and treated with 250 ng/ml IL-6 (Invitrogen, Carlsbad, CA) for the indicated times before lysis (described below).
Immunoblots
Untreated and IFNγ-treated cells cultured on tissue culture plastic were lysed directly with Tri reagent (Sigma, St. Louis, MO) or protein solubilization buffer (106 mM Tris HCl, 141 mM Tris Base, 0.51 mM EDTA, 2% SDS). For the cells lysed in Tri reagent, total protein was isolated as per the manufacturer’s protocol, and quantified using the DC protein assay (Bio-Rad Laboratories, Hercules, CA) and a plate reader (SpectraMax, Molecular Devices, Sunnyvale, CA), using bovine serum albumin as a standard. Where indicated, 20 μg of total protein (or protein isolated from 5.32×10⁵ cells) per sample were separated on a NuPAGE 7% Tris-Acetate gel (Invitrogen), and transferred (semi-dry) to PVDF (Bio-Rad). Within an experiment, corresponding samples from neurons and MEF were run on the same gel, to allow direct comparisons to be made. The blots were blocked overnight in PBS containing 0.1% Tween-20 (PBS-T) and 5% BSA. The blots were subsequently incubated in primary antibody solution (anti-STAT1 C-terminus (1:1000), anti-phospho-specific STAT1 (pY701; 1:1000), both from BD Biosciences Pharmingen; anti-STAT3 (1:200), anti-phospho-specific STAT3 (pY705; 1:200), both from Santa Cruz Biotechnology Inc., Santa Cruz, CA; and anti-glyceraldehyde-3-phosphate dehydrogenase (GAPDH; 1:200; Chemicon International Inc., Temecula, CA) diluted in PBS-T containing 3% BSA) for 1 h at room temperature. After three washes in PBS-T (5 min each), the blots were incubated in secondary antibody solution (goat anti-rabbit horseradish peroxidase (HRP; 1:1000; Vector Laboratories Inc.) for anti-STAT1 and anti-STAT3, goat anti-mouse HRP (1:2000; Santa Cruz Biotechnology Inc.) for anti-STAT1pY701 and anti-STAT3pY705; all diluted in PBS-T) for 1 h at room temperature. The blots were washed as described above, incubated in ECL detection solution (Amersham Biosciences, Little Chalfont, Buckinghamshire UK), and exposed to autoradiography film until a suitable image was obtained. For quantitative analysis of immunoblots, densitometric analysis of autoradiography films was performed using NIH Image (v.1.63) or ImageJ (v.1.36b) software. When necessary, blots were stripped by incubation in stripping buffer (100 mM 2-mercaptoethanol, 2% SDS, 62.5 mM Tris-HCl pH 6.7) at 50°C for 30 min, then reprobed with the appropriate antibody as described above.
Reverse transcriptase quantitative real-time PCR (RT-qPCR)
RNA was purified from whole cell lysates using the RNeasy Mini kit (Qiagen, Valencia, CA). Contaminating DNA in RNA preparations was removed using TURBO DNA-free™ (Ambion, Austin, TX). RNA was quantified using the Agilent 2100 BioAnalyzer in combination with a RNA 6000 Nano LabChip. RNA was reverse-transcribed using M-MLV reverse transcriptase (Ambion) and a mixture of anchored oligo-dT and random decamers. For each sample, 2 RT reactions were performed with inputs of 100 and 20 ng. An aliquot of the cDNA was used for 5’-nuclease assays using Taqman chemistry. Assay-on-Demand Mm00445235_m1 (CXCL10), Mm00515191_m1 (IRF1), Mm00782550_s1 (SOCS1), Mm00545913_s1 (SOCS3), Mm00599890_m1 (IFNγR1), and Mm00492626_m1 (IFNγR2) in combination with Universal Master mix were run on a 7900 HT sequence detection system (Applied Biosystems, Foster City, CA). Cycling conditions were 95°C, 15 min followed by 40 (2-step) cycles (95°C, 15 sec; 60°C, 60 sec). Relative quantification to the control was done using the comparative Ct method. The values plotted are the average from 2 PCR reactions.
3. RESULTS
The kinetics of IFNγ-stimulated STAT1 phosphorylation in neurons is distinct from that in MEF
To explore the response of CNS neurons to IFNγ, we determined baseline levels of STAT1 expression and monitored the kinetics of STAT1 phosphorylation following IFNγ exposure (Figure 1a) in both primary hippocampal neurons and in mouse embryo fibroblasts (MEF). MEF were used as a control because IFNγ signaling has been well-characterized in these cells (e.g. Qing and Stark, 2004). Purified total protein (20 μg/lane) from untreated neurons and MEF, and from neurons and MEF treated with 100 U/ml IFNγ for various times was analyzed by immunoblot. Immunoblotting was done using a STAT1 antibody (to detect total STAT1) and a phospho-specific STAT1 antibody (to determine the kinetics and extent of STAT1 activation). The housekeeping protein glyceraldehyde-3-phosphate dehydrogenase (GAPDH) was used as a loading control, since the expression of STAT1 itself is IFNγ-responsive. The use of β-actin as a loading control produced identical results (not shown).
Figure 1. Basal STAT1 expression and activation kinetics differ between primary neurons and primary fibroblasts following IFNγ exposure.
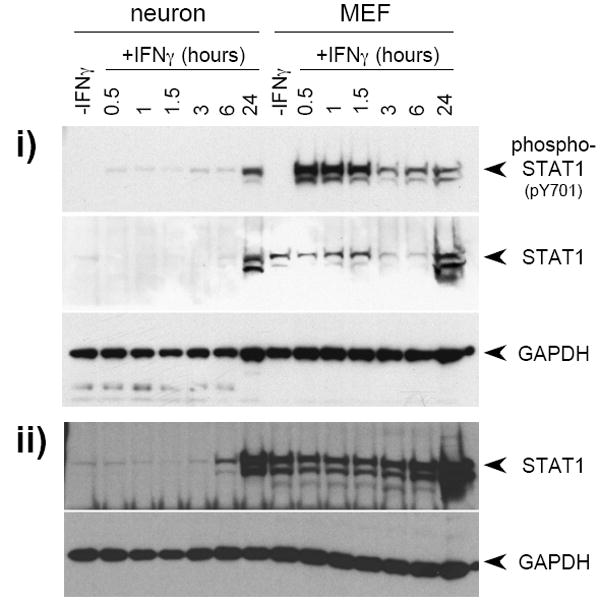
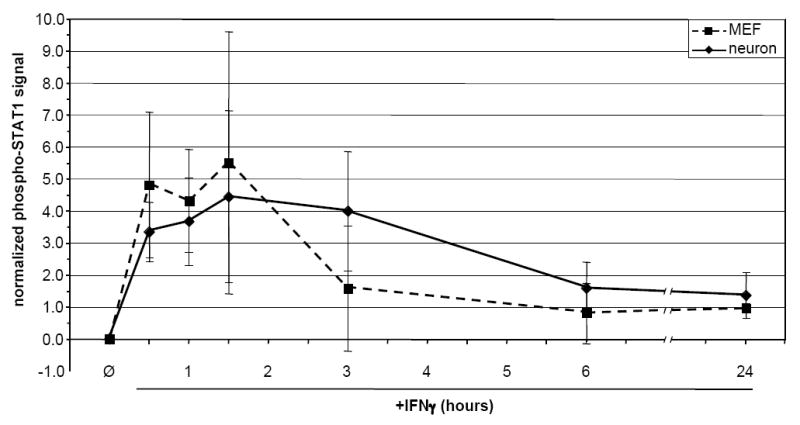
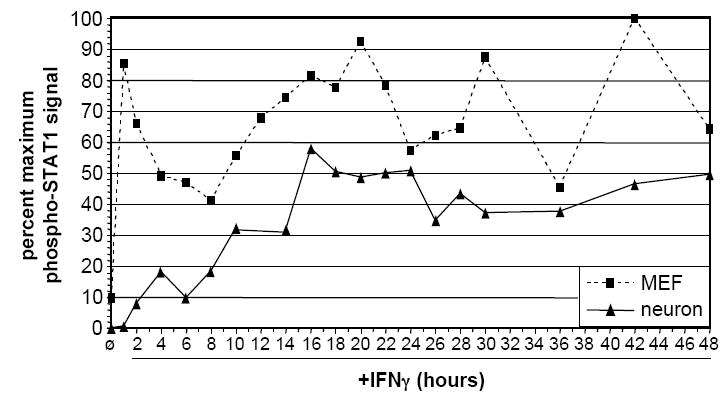
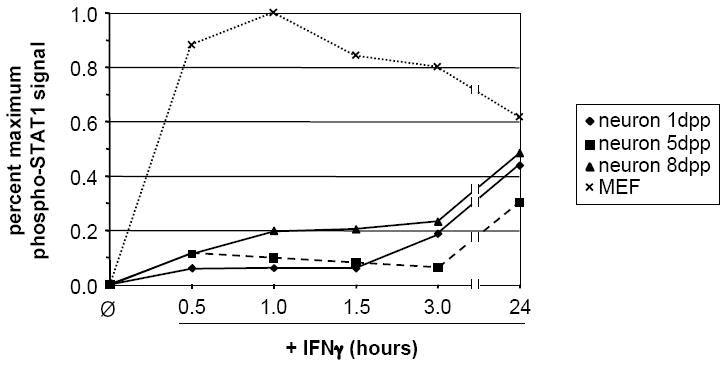
The kinetics of STAT1 phosphorylation in response to IFNγ (100U/ml) were examined in neurons and MEF. a) Quantitative timecourse immunoblot analysis of i) purified total protein (20 μg/lane) isolated from untreated and IFNγ-treated neurons and MEF, and ii) samples from whole cell lysates of equal numbers (5.32×10⁵ cells per condition) of neurons and MEF, using antibodies specific for phospho-STAT1 (pY701), STAT1, and GAPDH. Blots were first analyzed for phospho-STAT1 (pY701) and GAPDH, and were then stripped and analyzed for STAT1. The presence of phospho-STAT1 in the apparent absence of total STAT1 in neurons is likely due to differences in antibody affinity. b) “Per-molecule” response of STAT1 activation in neurons and MEF as assessed by normalization of phospho-STAT1 signal to STAT1 and GAPDH signals. Data from two timecourse studies similar to that described in (a) above was analyzed using densitometry; mean normalized phospho-STAT1 signal is shown. c) Densitometric quantitation of 48 h IFNγ timecourse. Purified total protein (20 μg/lane) isolated from untreated and IFNγ-treated neurons and MEF was analyzed by immunoblot with antibodies specific for phospho-STAT1 and GAPDH. The phospho-STAT1 signal was normalized to the GAPDH signal to control for loading, and is presented as percent maximum phospho-STAT1 signal. d) Densitometric quantitation of STAT1 phosphorylation in response to continual IFNγ stimulation in neurons 1, 5, and 8 d post-plating, and in MEF. IFNγ was added to cultures, whole cell lysates were collected at indicated timepoints post-IFNγ addition, and the lysates were analyzed by immunoblot with antibodies specific for phospho-STAT1 and GAPDH. The phospho-STAT1 signal is presented as described in (a).
When the blot was probed with an antibody against the carboxy-terminus of total STAT1, the protein was barely detectable in untreated neurons, as compared to robust expression in unstimulated MEFs (Figure 1a, i; see “-IFNγ” lanes). As expected, no phospho-STAT1 was detected in either cell population in the absence of IFNγ exposure. When cells were treated with IFNγ, rapid and robust STAT1 activation was observed in MEF, whereas only a weak (approximately 20-fold less) signal was detected in treated neurons, even after 6 h of exposure. Activated STAT1 was notable only after approximately 24 h post-exposure in neurons, coincident with an increase in available total STAT1 protein. Presumably, the low levels of activated STAT1 in neurons at early times post-IFNγ exposure were sufficient to induce transcription of STAT1, leading to the increased presence of available STAT1 protein by 24 h. An identical pattern of STAT1 expression was observed when samples from equal numbers of neurons and MEF were analyzed (Figure 1a, ii). Differential expression of STAT1, coupled with muted STAT1 activation in neurons after IFNγ exposure, was observed in at least five different primary culture preparations, and the altered response kinetics between the two cell types was unaffected when 10-fold higher and lower doses of IFNγ were tested (10-1000 U/ml; data not shown). From these data, we conclude that expression of STAT1 in primary neurons obtained from the embryonic mouse hippocampus is lower than in MEFs on a total cell protein basis, leading to muted and delayed STAT1 activation.
Importantly, when phospho-STAT1 was normalized to total STAT1 and GAPDH to determine the kinetics of STAT1 phosphorylation on a “per-STAT1 molecule” basis, no significant differences between the two cell types were seen (Figure 1b). This suggests that the cellular processes responsible for STAT1 recruitment to the receptor complex and subsequent events leading to STAT1 phosphorylation are similar between neurons and MEFs, and that the differences in the kinetics of STAT1 activation are likely due to the bioavailability of STAT1, rather than to cell-specific differences in the activation or function of STAT1 in IFNγ-treated cells.
To gain a more detailed picture of the kinetics of STAT1 phosphorylation in neurons and MEF, we quantified STAT1 phosphorylation every 2 h post-IFNγ addition, up to 48 h (Figure 1c). Densitometric analysis of immunoblots demonstrated that STAT1 phosphorylation in neurons remained lower than in MEF throughout the timecourse. Moreover, while levels of phospho-STAT1 in MEF followed a cyclic pattern (with a periodicity of approximately 12 h), phospho-STAT1 levels in neurons did not: in neurons, phospho-STAT1 levels began to slowly increase at approximately 2 h of sustained IFNγ treatment, continued to increase until around 16 h, and then remained approximately constant thereafter. We confirmed the bioavailability of IFNγ over the 48 h timecourse by demonstrating that IFNγ-supplemented culture medium from representative timepoints was able to stimulate STAT1 phosphorylation to equivalent levels when transferred to fresh MEF (data not shown).
Neuronal STAT1 activation kinetics are not dependent on differentiation stage
Cultured primary hippocampal neurons differentiate for up to 72-96 h post-plating, during which time functional synapses are formed and the expression of neuron-specific markers is initiated (Banker and Goslin, 1991; Pasick et al., 1994). To control for the possibility that the observed alterations in IFNγ-stimulated STAT1 phosphorylation were a function of neuronal culture age, we examined STAT1 phosphorylation in response to continual IFNγ treatment over a 24 h time course in neurons that had been cultured for 1, 5, and 8 d, and compared it to IFNγ-induced STAT1 phosphorylation in MEF. As shown in Figure 1d, STAT1 phosphorylation patterns over 24 h were virtually identical for neurons that had been cultured for 1 and 5 d. Neurons that had been cultured for 8 d showed a slightly higher level of phosphorylation at early timepoints as compared to the 1 and 5 d neurons (Figure 1d). Nevertheless, the characteristic “neuronal” profile of STAT1 phosphorylation was maintained, regardless of culture time.
IFNγ-stimulated STAT3 phosphorylation in neurons is undetectable
Although IFNγ signals predominantly via STAT1 activation and nuclear translocation (reviewed in Stark et al., 1998), it has been reported that STAT1-deficient MEF treated with IFNγ utilize STAT3 for the transduction of the IFNγ signal (Qing and Stark, 2004). As constitutive STAT1 expression was markedly reduced in neurons (Figure 1a), we tested the hypothesis that STAT3 was playing a predominant role in IFNγ signal transduction in these cells. However, in IFNγ-treated neurons, phospho-STAT3 was not detected at any time post-IFNγ addition, even though total STAT3 protein was upregulated after extended (e.g. 24 h) IFNγ treatment (Figure 2a). In contrast, MEF demonstrated an early induction of STAT3 phosphorylation, and expressed unphosphorylated STAT3 constitutively (Figure 2a). This modest activation of STAT3 in wild-type MEF (expressing STAT1) was consistent with previous work (Qing and Stark, 2004). Treatment of neurons and MEF with another STAT3-activating cytokine, IL-6, gave identical results (Figure 2b), supporting the hypothesis that bioavailability, rather than proximal signals following receptor binding, are the basis for cell-specific differences in STAT activation.
Figure 2. STAT3 phosphorylation in response to continual IFNγ treatment is undetectable in neurons.
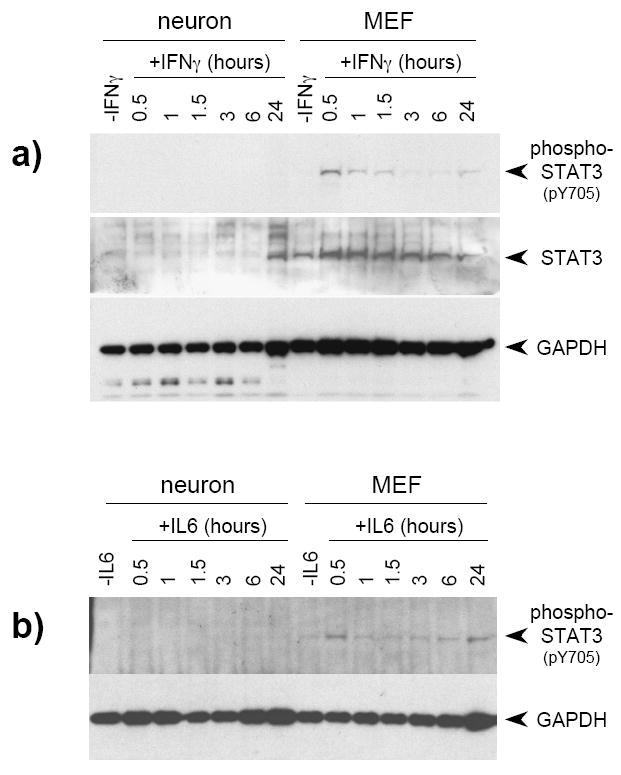
a) Quantitative timecourse immunoblot analysis of purified total protein (20 μg/lane) isolated from untreated and IFNγ-treated (100 U/ml) neurons and MEF using antibodies specific for phospho-STAT3, STAT3, and GAPDH. Blots were first analyzed for phospho-STAT3 and GAPDH, and were then stripped and analyzed for STAT3. b) Neurons and MEF were prepared as described, but treated with 250 ng/ml IL-6. Lysates were collected at the indicated timepoints, and were subsequently immunoblotted with antibodies to phospho-STAT3 and GAPDH.
The expression of IFNγR2, but not IFNγR1, is equivalent in neurons and MEF
To compare the expression of the IFNγ receptor subunits in neurons to that in MEF, we used quantitative RT-qPCR to examine the levels of R1 and R2 subunit transcripts in total RNA isolated from untreated neurons and MEF. Although no differences were observed in the expression of the R2 subunit between the two cell types, we found that expression of the R1 subunit was approximately 8-fold lower in neurons as compared to MEF (Figure 3). Expression of neither subunit was affected by IFNγ treatment (data not shown).
Figure 3. Expression of IFNγR2, but not IFNγR1, is equivalent in neurons and MEF.
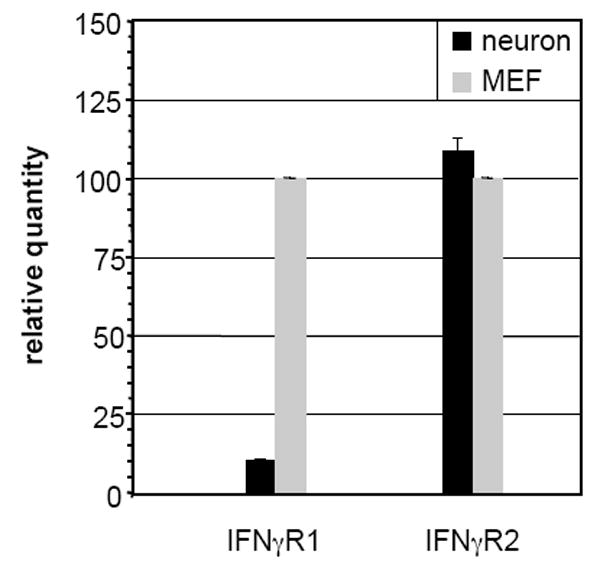
Total RNA isolated from neurons and MEF was analyzed using RT-qPCR for the presence of IFNγR1 and IFNγR2 as described in Materials and Methods.
The responsiveness of IFNγ-stimulated gene transcription is attenuated in neurons as compared to MEF during continual IFNγ exposure
To address whether the marked differences in signaling between neurons and MEF resulted in differences in downstream IFNγ-responsive gene expression, RNA purified from cells treated with IFNγ over a 48-h time course was examined by RT-qPCR to measure the levels of four representative IFNγ-responsive transcripts (CXCL10, IRF-1, SOCS-1, and SOCS-3) (Figure 4a-d). The induction of CXCL10 mRNA expression in MEF was approximately three-fold higher than in neurons during the first 24 h of IFNγ exposure, increasing to approximately 5-fold higher levels during the next 18 h (Figure 4a); similar results were observed for IRF-1 expression (Figure 4b). In both cell types, the overall induction of SOCS-1 and SOCS-3 transcription was markedly lower (Figure 4c/d; note y-axis scales). However, MEF again demonstrated two- to three-fold higher levels of IFNγ-induced SOCS-1 transcription as compared to neurons throughout the time course (Figure 4c). In the case of SOCS-3, while MEF demonstrated a rapid induction, no significant expression was observed in neurons at any point during the time course (Figure 4d).
Figure 4. Expression of selected IFNγ-responsive genes is lower in neurons as compared to MEF during continual IFNγ exposure.
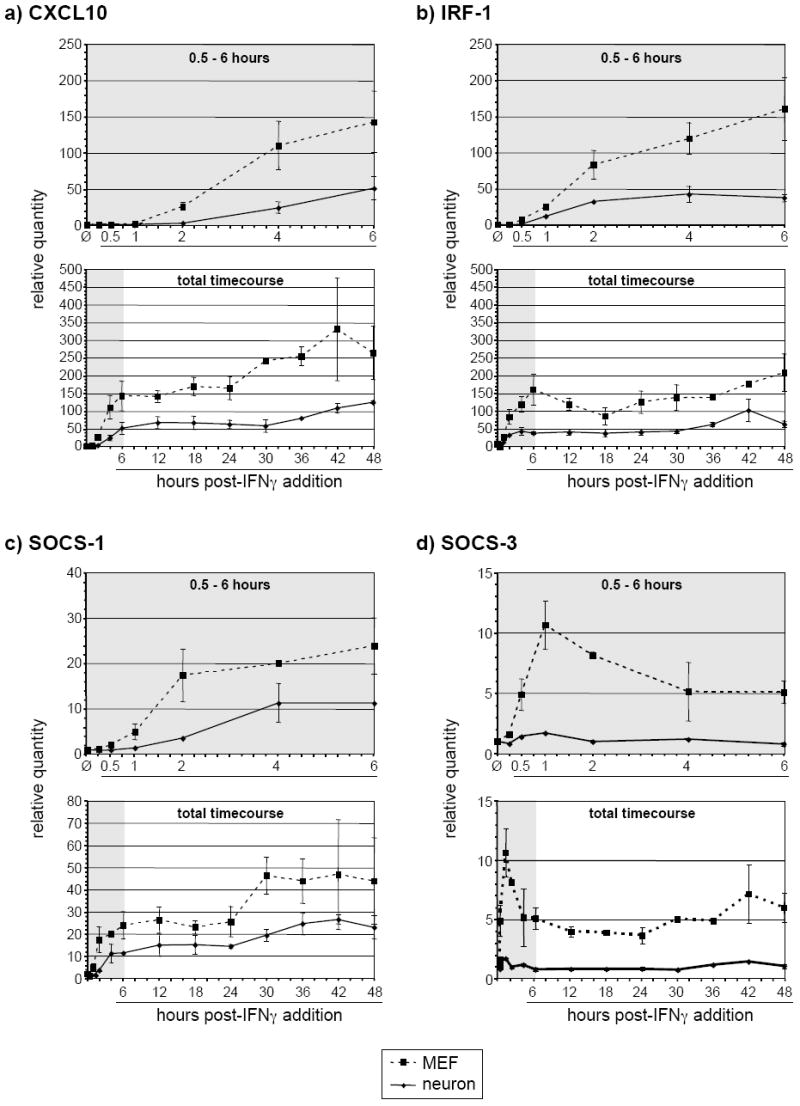
Total RNA isolated from neurons and MEF treated with IFNγ (100U/ml) for the indicated times was analyzed using RT-qPCR for the presence of CXCL10 (a), IRF-1 (b), SOCS-1 (c), and SOCS-3 (d) transcripts. The top plot for each gene shows transcript levels from untreated cells and cells treated for 0.5 – 6 h; the bottom plot shows the entire time course.
The duration of STAT1 phosphorylation is sustained in neurons pulsed with IFNγ
It has been well-established that the IFNγ signaling pathway has an extensive negative feedback system which acts via multiple mediators, including members of the suppressors of cytokine signaling (SOCS) and SH2-containing protein tyrosine phosphatase (SHP) families of proteins (reviewed in Wang and Campbell, 2002; Wormald and Hilton, 2004). To establish whether the observed dampening and delay in neuronal STAT1 signaling following IFNγ treatment was due to a strong negative feedback response, we characterized the duration of STAT1 phosphorylation in neurons and MEF following a 30-min “pulse” of IFNγ. Cells were exposed to IFNγ for 30 min, and then were extensively washed to eliminate any remaining IFNγ. To confirm that the IFNγ was washed out, washes were tested on untreated MEF, which demonstrated no significant STAT1 phosphorylation after 30 min of exposure (data not shown). Whole cell lysates were collected at the indicated timepoints post-pulse (Figure 5a). In MEF, the phosphorylation of STAT1 was rapidly suppressed, and continued to decline throughout the timecouse. In contrast, a gradual increase of STAT1 phosphorylation in neurons up to 48 h was observed (Figure 5b). This sustained response to a 30-min IFNγ pulse surpassed that of MEF in intensity between approximately 12-18 h (Figure 5b). Only after 72 h post-IFNγ pulse did we observe a decrease in neuronal STAT1 phosphorylation (data not shown). Thus, while the kinetics of STAT1 phosphorylation in IFNγ-treated neurons were muted and delayed (Figure 1), STAT1 phosphorylation was sustained for a markedly longer duration following a 30-min IFNγ pulse.
Figure 5. STAT1 phosphorylation in neurons treated with a 30-min pulse of IFNγ steadily increases over 48 h post-treatment.
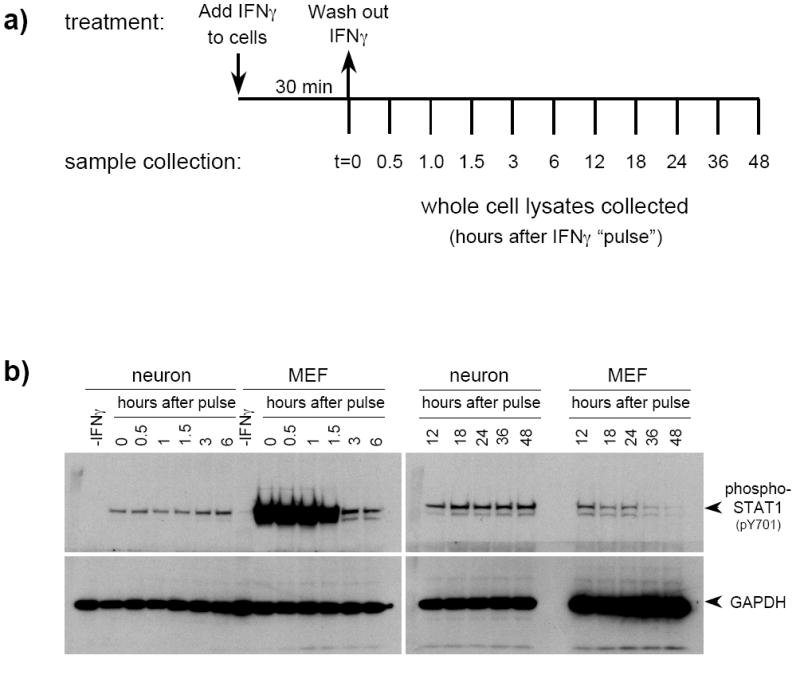
a) Neurons and MEF were treated with IFNγ (100U/ml) for 30 min, then washed extensively to eliminate IFNγ from the cultures. Conditioned culture medium was replaced after washing, and cells were lysed at the indicated timepoints post-treatment. b) Equal volumes of whole cell lysates were examined by immunoblotting with anti-phospho-STAT1 and anti-GAPDH antibodies. The timepoints correspond to the length of time in h after the IFNγ was washed out. Shown are results from a simultaneous exposure of the blots.
IFNγ-responsive gene expression is sustained in neurons pulsed with IFNγ
We then determined whether the sustained neuronal response at the level of STAT1 phosphorylation observed following a 30-min pulse of IFNγ affected IFNγ-responsive gene expression. As expected, expression patterns of CXCL10, IRF-1, and SOCS-1 mRNA in IFNγ-pulsed MEF demonstrated a rapid, transient upregulation at 3 h post-pulse, which was attenuated by 6-12 h (Figure 6a-c). In contrast, CXCL10, IRF-1, and SOCS-1 transcripts in IFNγ-pulsed neurons were upregulated at a slightly slower rate (peak at ~6 h post-pulse), but their expression remained significantly elevated past 24 h post-IFNγ pulse (Figure 6a-c). However, consistent with the previous analysis of SOCS-3 expression (Figure 4d), neuronal SOCS-3 was not significantly upregulated in IFNγ-pulsed neurons, whereas it was only transiently upregulated, and to a low level, in pulsed MEF. Thus, the extended kinetics of STAT1 phosphorylation observed in IFNγ pulsed neurons was accompanied by an extended expression of three of the four IFNγ-responsive genes examined in neurons.
Figure 6. Expression of selected IFNγ-responsive genes is extended in neurons as compared to MEF after an IFNγ pulse.
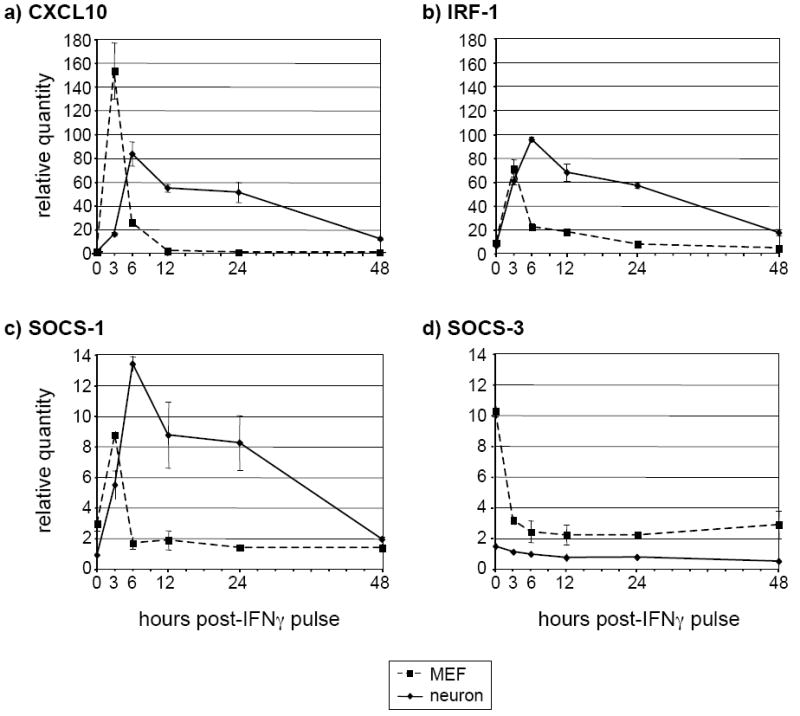
Neurons and MEF were treated as described in Figure 5a above. Total RNA was purified from the lysates and analyzed using RT-qPCR for the presence of CXCL10 (a), IRF-1 (b), SOCS-1 (c), and SOCS-3 (d) transcripts. The timepoints correspond to the length of time in h after the IFNγ was washed out.
4. DISCUSSION
Cytokines, such as IFNγ, can contribute to either protective or deleterious outcomes in the CNS, depending on the nature of the injury or antigenic trigger. For example, in many mouse models of neurotropic viral infection, including those caused by measles virus, Sindbis virus, vesicular stomatitis virus, Theiler’s murine encephalomyelitis virus, and West Nile virus, IFNγ is critical for viral clearance and recovery. In contrast, in cerebral malaria caused by the parasite Plasmodium falciparum, IFNγ and other Th1 cytokines have been implicated in the promotion of immunopathology and exacerbation of disease (reviewed in Hunt and Grau, 2003). Moreover, in non-pathogen associated CNS diseases such as experimental autoimmune encephalomyelitis (EAE), a rodent model of multiple sclerosis, IFNγ is considered the key causative factor in the hallmark demyelination (reviewed in Popko et al., 1997). Surely some of the reasons for this differential impact of IFNγ within the CNS include the location, duration and amount of IFNγ produced: in viral infections, for example, production of IFNγ by infiltrating NK and T cells may be brief and focused on a relatively low number of infected cells, whereas in chronic neuroinflammatory diseases such as EAE, unremitting IFNγ production directed at a more ubiquitous antigen (such as an autoantigen) may elicit neurotoxicity. Indeed, IFNγ is known to be directly cytotoxic: gene expression changes consequent to IFNγ exposure can lead to apoptosis (reviewed in Schroder et al., 2004). Moreover, mice that genetically cannot downregulate IFNγ responses die within two to three weeks of birth (Alexander et al., 1999).
The CNS has long been considered immune privileged (owing to the relative lack of immune surveillance within the parenchyma), which may serve to protect CNS neurons, a generally non-renewable and therefore vulnerable population. However, it is increasingly appreciated that immune responses do occur in the brain. While advances have been made in the understanding of the way in which IFNγ mediates the clearance of certain neurotropic infections (e.g. Yang et al., 2006), how neurons respond to immune mediators, and what cellular factors may affect the outcome of these cytokine interactions, warrants further study. STAT1 phosphorylation in response to IFNγ treatment has been previously evaluated in neurons (Chesler et al., 2004; Goody et al., 2007; Jiao et al., 2003; Jin et al., 2004; Kaur et al., 2003; Kaur et al., 2005; Wang and Campbell, 2005). However, the potential cell-specific responses to exogenous cytokines - specifically the significance of the timing and intensity of STAT activation -has not yet been explored in unmanipulated primary neurons.
To characterize the neuronal response to exogenous IFNγ stimulation, we compared primary hippocampal neuron cultures with MEF at three levels: basal expression of IFNγ receptor subunits; bioavailability and phosphorylation of the key IFNγ signal transducers, STAT1 and STAT3; and gene expression changes in response to IFNγ exposure. We performed standard timecourse assays under conditions of continuous IFNγ exposure and following a brief pulse. In primary neurons treated with IFNγ, as opposed to identically-treated control MEF, we observed i) reduced constitutive levels of IFNγR1 receptor subunit expression and STAT1 expression; ii) delayed and muted STAT1 phosphorylation kinetics following IFNγ exposure; iii) absence of STAT3 expression and phosphorylation; iv) decreased transcriptional response of representative IFNγ-responsive genes; and v) sustained STAT1 phosphorylation and expression of representative IFNγ-responsive genes following a pulse of IFNγ. A number of these observations warrant further discussion.
In our detailed timecourse analysis of IFNγ treated neurons (Figure 1c), we noted the absence of the classic cyclic pattern of phosphorylated STAT1 typically observed in IFNγ treated cells. A recent study observed a biphasic response in phosphorylated STAT3 intensity in wild-type macrophages following IL-6 exposure, which was absent in macrophages lacking SOCS-3 (Wormald et al., 2006). The investigators proposed that this lack of SOCS-3 resulted in an inability of the macrophages to suppress STAT3 phosphorylation, causing sustained activation of STAT3. We therefore speculated that similar perturbations in the negative feedback mechanisms of the neuronal IFNγ signaling pathway might naturally exist, accounting for the apparent lack of negative regulation in our timecourse experiments. Since numerous independent negative feedback pathways act to inhibit the IFNγ response, we took a functional approach by comparing the duration of STAT1 phosphorylation and changes in gene expression in neurons following a brief (30 min) pulse of IFNγ. The observations that i) STAT1 phosphorylation in pulsed neurons gradually increased over 48 h, while being rapidly attenuated in MEF; and ii) the mRNAs encoding CXCL10, IRF-1, and SOCS-1 also accumulated during this time period, further substantiated that fundamental differences in signaling and negative feedback have a direct effect on gene expression.
The extended phosphorylation of STAT1 seen in primary neurons following an IFNγ pulse may be the result of differences in any one of several mechanisms. As mentioned, the activity of negative feedback proteins, including the SOCS family, may be impaired in IFNγ-stimulated neurons, thus allowing the receptor-associated JAKs (JAK1 and JAK2) to remain active for an extended period post-stimulation. Alternatively, decreased expression of neuronal protein tyrosine phosphatases may allow the R1 subunits of the receptor complex to remain phosphorylated, thus prolonging the availability of docking sites for STAT1 activation. Finally, the rate of STAT1 inactivation via dephosphorylation (reviewed in Darnell, 1997) in IFNγ-treated neurons may be delayed, allowing the nuclear accumulation of phosphorylated STAT1 over time. Regardless of the mechanism, it is important to note that similar responses have been observed in rat pancreatic islet cells pulsed with IFNγ (Heitmeier et al., 1999). In these treated cells, STAT1 was still phosphorylated and localized to the nucleus 7 days post-pulse, though the reasons for this sustained response were not addressed. Nevertheless, the ability of cells to modulate the duration of response to exogenous cytokines may be an important parameter in understanding cell-specific patterns in host immunity.
In our studies, we were surprised to note a substantial difference in neuronal expression levels of the IFNγR1 subunit (Figure 3). The cellular differences observed in IFNγR1 RNA do not necessarily imply differences in protein expression. In a study of cultured dorsal root ganglia neurons, Wekerle and colleagues detected robust expression of both IFNγ subunits (Neumann et al., 1997); thus, either subunit expression is neuron-subtype dependent, or our RNA studies do not parallel protein levels. However, even if the level of the IFNγR1 subunit is lower in neurons, functional complexes can be made, since we show in Figure 1 that the low available levels of STAT1 in neurons can still be activated in IFNγ stimulated neurons. How lower expression of this one subunit may impact on the neuronal response to exogenous cytokines is a matter of current study.
An important technical aspect of our study is the use of primary cells. While cell lines have been invaluable for defining key steps in cytokine responsiveness, evaluating otherwise unmanipulated, pure primary cultures may be more powerful in resolving the basis of cellular heterogeneity in cytokine responses. For example, Kaur et al. found that although treatment of a human neuroblastoma cell line with IFNγ for 30 min resulted in weak phosphorylation of STAT3, STAT3 phosphorylation was undetectable in IFNγ-treated primary rat sympathetic neurons (Kaur et al., 2003). Thus, as our studies progress, continued use of primary neurons will be essential, not only to reveal how altered signaling impacts the eventual neuronal response, but also to ascertain whether potential differences exist in distinct neuronal subpopulations.
While these data indicate that cell-specific differences in basal expression of key signaling molecules can dramatically alter the cellular response to exogenous cytokines, care must be taken not to over-interpret these findings. For example, recent studies (Hurgin et al., 2007; Jarosinski et al., 2001; Massa et al., 2006) have shown that neurons are recalcitrant to NF-kB activation. As many IFNγ-responsive genes also possess promoter elements to which NF-kB can bind, the convergence of multiple signaling pathways, such as the STAT and NF-kB pathways, likely governs the individual cellular response to exogenous cytokines. While our studies suggest cell-specific differences in STAT signaling, the contribution of other signaling pathways in cytokine responsiveness must also be considered.
In summary, we have shown that cell-specific variations in IFNγ signaling pathways, including bioavailability of key signaling effectors, strongly influence gene expression. These data further aid our understanding of why potent cytokines such as IFNγ may have apparently paradoxical effects under different circumstances. For example, perhaps less rapid and robust induction of IFNγ-responsive genes, many of which can be cytotoxic, may be advantageous for CNS neurons, and may afford some degree of protection under circumstances of chronic inflammatory challenges. Obviously, these ex vivo studies require confirmation in vivo, but we speculate that altered signaling pathways may act as a buffer between exogenous cytokines and the neuronal response. These variations in signal transduction span from receptor expression to nuclear localization of transcription factors, ultimately impacting on the initiation, intensity, duration, and profile of downstream gene expression. While the data presented in this paper pertain to the role of STAT1 in type II interferon signaling, STAT1 also plays a central role in target cell response to type I interferons. We would therefore predict that the observations presented here are pertinent to the neuronal response to type I interferons as well. An appreciation of how cells respond to soluble immune mediators will be crucial for the development of immune-based therapies appropriately tailored to the antigenic stimulus.
Acknowledgments
We would like to thank Drs. Kerry Campbell, Christine Matullo, Maureen Murphy, George Stark, and Virginia Young for helpful comments and discussion. We also thank Dr. Anthony Yeung, director of the Fox Chase Cancer Center Biochemistry and Biotechnology facility, for real-time PCR services. The current study was supported by grants from the NIH to R.W.R. (NS051024) and to G.F.R. (NS40500), and by NIH core grant CA-06927.
Footnotes
Publisher's Disclaimer: This is a PDF file of an unedited manuscript that has been accepted for publication. As a service to our customers we are providing this early version of the manuscript. The manuscript will undergo copyediting, typesetting, and review of the resulting proof before it is published in its final citable form. Please note that during the production process errorsmaybe discovered which could affect the content, and all legal disclaimers that apply to the journal pertain.
References
- Alexander WS, Starr R, Fenner JE, Scott CL, Handman E, Sprigg NS, Corbin JE, Cornish AL, Darwiche R, Owczarek CM, Kay TW, Nicola NA, Hertzog PJ, Metcalf D, Hilton DJ. SOCS1 is a critical inhibitor of interferon gamma signaling and prevents the potentially fatal neonatal actions of this cytokine. Cell. 1999;98:597–608. doi: 10.1016/s0092-8674(00)80047-1. [DOI] [PubMed] [Google Scholar]
- Banker G, Goslin K. Culturing Nerve Cells. MIT Press; Cambridge: 1991. [Google Scholar]
- Barish ME, Mansdorf NB, Raissdana SS. Gamma-interferon promotes differentiation of cultured cortical and hippocampal neurons. Dev Biol. 1991;144:412–423. doi: 10.1016/0012-1606(91)90433-4. [DOI] [PubMed] [Google Scholar]
- Bate C, Kempster S, Last V, Williams A. Interferon-gamma increases neuronal death in response to amyloid-beta1-42. J Neuroinflammation. 2006;3:7. doi: 10.1186/1742-2094-3-7. [DOI] [PMC free article] [PubMed] [Google Scholar]
- Burdeinick-Kerr R, Griffin DE. Gamma interferon-dependent, noncytolytic clearance of sindbis virus infection from neurons in vitro. J Virol. 2005;79:5374–5385. doi: 10.1128/JVI.79.9.5374-5385.2005. [DOI] [PMC free article] [PubMed] [Google Scholar]
- Chesler DA, Dodard C, Lee GY, Levy DE, Reiss CS. Interferon-gamma-induced inhibition of neuronal vesicular stomatitis virus infection is STAT1 dependent. J Neurovirol. 2004;10:57–63. doi: 10.1080/13550280490261707. [DOI] [PubMed] [Google Scholar]
- Costa-Pereira AP, Hermanns HM, Is’harc H, Williams TM, Watling D, Arulampalam V, Newman SJ, Heinrich PC, Kerr IM. Signaling through a mutant IFN-gamma receptor. J Immunol. 2005;175:5958–5965. doi: 10.4049/jimmunol.175.9.5958. [DOI] [PubMed] [Google Scholar]
- Darnell JE., Jr STATs and gene regulation. Science. 1997;277:1630–1635. doi: 10.1126/science.277.5332.1630. [DOI] [PubMed] [Google Scholar]
- Delhaye S, Paul S, Blakqori G, Minet M, Weber F, Staeheli P, Michiels T. Neurons produce type I interferon during viral encephalitis. Proc Natl Acad Sci U S A. 2006;103:7835–7840. doi: 10.1073/pnas.0602460103. [DOI] [PMC free article] [PubMed] [Google Scholar]
- Goody RJ, Beckham JD, Rubtsova K, Tyler KL. JAK-STAT signaling pathways are activated in the brain following reovirus infection. J Neurovirol. 2007;13:373–383. doi: 10.1080/13550280701344983. [DOI] [PMC free article] [PubMed] [Google Scholar]
- Heitmeier MR, Scarim AL, Corbett JA. Prolonged STAT1 activation is associated with interferon-gamma priming for interleukin-1-induced inducible nitric-oxide synthase expression by islets of Langerhans. J Biol Chem. 1999;274:29266–29273. doi: 10.1074/jbc.274.41.29266. [DOI] [PubMed] [Google Scholar]
- Horvath CM, Wen Z, Darnell JE., Jr A STAT protein domain that determines DNA sequence recognition suggests a novel DNA-binding domain. Genes Dev. 1995;9:984–994. doi: 10.1101/gad.9.8.984. [DOI] [PubMed] [Google Scholar]
- Hunt NH, Grau GE. Cytokines: accelerators and brakes in the pathogenesis of cerebral malaria. Trends Immunol. 2003;24:491–499. doi: 10.1016/s1471-4906(03)00229-1. [DOI] [PubMed] [Google Scholar]
- Hurgin V, Novick D, Werman A, Dinarello CA, Rubinstein M. Antiviral and immunoregulatory activities of IFN-gamma depend on constitutively expressed IL-1alpha. Proc Natl Acad Sci U S A. 2007;104:5044–5049. doi: 10.1073/pnas.0611608104. [DOI] [PMC free article] [PubMed] [Google Scholar]
- Jarosinski KW, Whitney LW, Massa PT. Specific deficiency in nuclear factor-kappaB activation in neurons of the central nervous system. Lab Invest. 2001;81:1275–1288. doi: 10.1038/labinvest.3780341. [DOI] [PubMed] [Google Scholar]
- Jiao J, Kaur N, Lu B, Reeves SA, Halvorsen SW. Initiation and maintenance of CNTF-Jak/STAT signaling in neurons is blocked by protein tyrosine phosphatase inhibitors. Brain Res Mol Brain Res. 2003;116:135–146. doi: 10.1016/s0169-328x(03)00286-9. [DOI] [PubMed] [Google Scholar]
- Jin Y, Lundkvist G, Dons L, Kristensson K, Rottenberg ME. Interferon-gamma mediates neuronal killing of intracellular bacteria. Scand J Immunol. 2004;60:437–448. doi: 10.1111/j.0300-9475.2004.01500.x. [DOI] [PubMed] [Google Scholar]
- Kaur N, Kim IJ, Higgins D, Halvorsen SW. Induction of an interferon-gamma Stat3 response in nerve cells by pre-treatment with gp130 cytokines. J Neurochem. 2003;87:437–447. doi: 10.1046/j.1471-4159.2003.02012.x. [DOI] [PubMed] [Google Scholar]
- Kaur N, Lu B, Monroe RK, Ward SM, Halvorsen SW. Inducers of oxidative stress block ciliary neurotrophic factor activation of Jak/STAT signaling in neurons. J Neurochem. 2005;92:1521–1530. doi: 10.1111/j.1471-4159.2004.02990.x. [DOI] [PubMed] [Google Scholar]
- Komatsu T, Bi Z, Reiss CS. Interferon-gamma induced type I nitric oxide synthase activity inhibits viral replication in neurons. J Neuroimmunol. 1996;68:101–108. doi: 10.1016/0165-5728(96)00083-5. [DOI] [PubMed] [Google Scholar]
- Kraus J, Borner C, Lendeckel U, Hollt V. Interferon-gamma down-regulates transcription of the mu-opioid receptor gene in neuronal and immune cells. J Neuroimmunol. 2006;181:13–18. doi: 10.1016/j.jneuroim.2006.07.012. [DOI] [PubMed] [Google Scholar]
- Massa PT, Aleyasin H, Park DS, Mao X, Barger SW. NFkappaB in neurons? The uncertainty principle in neurobiology. J Neurochem. 2006;97:607–618. doi: 10.1111/j.1471-4159.2006.03810.x. [DOI] [PMC free article] [PubMed] [Google Scholar]
- Massa PT, Whitney LW, Wu C, Ropka SL, Jarosinski KW. A mechanism for selective induction of 2’-5’ oligoadenylate synthetase, anti-viral state, but not MHC class I genes by interferon-beta in neurons. J Neurovirol. 1999;5:161–171. doi: 10.3109/13550289909021998. [DOI] [PubMed] [Google Scholar]
- Neumann H, Schmidt H, Wilharm E, Behrens L, Wekerle H. Interferon gamma gene expression in sensory neurons: evidence for autocrine gene regulation. J Exp Med. 1997;186:2023–2031. doi: 10.1084/jem.186.12.2023. [DOI] [PMC free article] [PubMed] [Google Scholar]
- Pasick JM, Kalicharran K, Dales S. Distribution and trafficking of JHM coronavirus structural proteins and virions in primary neurons and the OBL-21 neuronal cell line. J Virol. 1994;68:2915–2928. doi: 10.1128/jvi.68.5.2915-2928.1994. [DOI] [PMC free article] [PubMed] [Google Scholar]
- Patterson CE, Lawrence DM, Echols LA, Rall GF. Immune-mediated protection from measles virus-induced central nervous system disease is noncytolytic and gamma interferon dependent. J Virol. 2002;76:4497–4506. doi: 10.1128/JVI.76.9.4497-4506.2002. [DOI] [PMC free article] [PubMed] [Google Scholar]
- Popko B, Corbin JG, Baerwald KD, Dupree J, Garcia AM. The effects of interferon-gamma on the central nervous system. Mol Neurobiol. 1997;14:19–35. doi: 10.1007/BF02740619. [DOI] [PMC free article] [PubMed] [Google Scholar]
- Qing Y, Stark GR. Alternative activation of STAT1 and STAT3 in response to interferon-gamma. J Biol Chem. 2004;279:41679–41685. doi: 10.1074/jbc.M406413200. [DOI] [PubMed] [Google Scholar]
- Rall GF, Manchester M, Daniels LR, Callahan EM, Belman AR, Oldstone MB. A transgenic mouse model for measles virus infection of the brain. Proc Natl Acad Sci U S A. 1997;94:4659–4663. doi: 10.1073/pnas.94.9.4659. [DOI] [PMC free article] [PubMed] [Google Scholar]
- Rall GF, Mucke L, Oldstone MB. Consequences of cytotoxic T lymphocyte interaction with major histocompatibility complex class I-expressing neurons in vivo. J Exp Med. 1995;182:1201–1212. doi: 10.1084/jem.182.5.1201. [DOI] [PMC free article] [PubMed] [Google Scholar]
- Ramana CV, Chatterjee-Kishore M, Nguyen H, Stark GR. Complex roles of Stat1 in regulating gene expression. Oncogene. 2000;19:2619–2627. doi: 10.1038/sj.onc.1203525. [DOI] [PubMed] [Google Scholar]
- Rodriguez M, Zoecklein LJ, Howe CL, Pavelko KD, Gamez JD, Nakane S, Papke LM. Gamma interferon is critical for neuronal viral clearance and protection in a susceptible mouse strain following early intracranial Theiler’s murine encephalomyelitis virus infection. J Virol. 2003;77:12252–12265. doi: 10.1128/JVI.77.22.12252-12265.2003. [DOI] [PMC free article] [PubMed] [Google Scholar]
- Samuel MA, Whitby K, Keller BC, Marri A, Barchet W, Williams BR, Silverman RH, Gale M, Jr, Diamond MS. PKR and RNase L contribute to protection against lethal West Nile Virus infection by controlling early viral spread in the periphery and replication in neurons. J Virol. 2006;80:7009–7019. doi: 10.1128/JVI.00489-06. [DOI] [PMC free article] [PubMed] [Google Scholar]
- Sanders P, De Keyser J. Janus faces of microglia in multiple sclerosis. Brain Res Rev. 2007;54:274–285. doi: 10.1016/j.brainresrev.2007.03.001. [DOI] [PubMed] [Google Scholar]
- Schroder K, Hertzog PJ, Ravasi T, Hume DA. Interferon-gamma: an overview of signals, mechanisms and functions. J Leukoc Biol. 2004;75:163–189. doi: 10.1189/jlb.0603252. [DOI] [PubMed] [Google Scholar]
- Shrestha B, Wang T, Samuel MA, Whitby K, Craft J, Fikrig E, Diamond MS. Gamma interferon plays a crucial early antiviral role in protection against West Nile virus infection. J Virol. 2006;80:5338–5348. doi: 10.1128/JVI.00274-06. [DOI] [PMC free article] [PubMed] [Google Scholar]
- Stark GR, Kerr IM, Williams BR, Silverman RH, Schreiber RD. How cells respond to interferons. Annu Rev Biochem. 1998;67:227–264. doi: 10.1146/annurev.biochem.67.1.227. [DOI] [PubMed] [Google Scholar]
- Takagi Y, Harada J, Chiarugi A, Moskowitz MA. STAT1 is activated in neurons after ischemia and contributes to ischemic brain injury. J Cereb Blood Flow Metab. 2002;22:1311–1318. doi: 10.1097/01.WCB.0000034148.72481.F4. [DOI] [PubMed] [Google Scholar]
- Trottier MD, Jr, Palian BM, Shoshkes Reiss C. VSV replication in neurons is inhibited by type I IFN at multiple stages of infection. Virology. 2005;333:215–225. doi: 10.1016/j.virol.2005.01.009. [DOI] [PubMed] [Google Scholar]
- Wang J, Campbell IL. Cytokine signaling in the brain: putting a SOCS in it? J Neurosci Res. 2002;67:423–427. doi: 10.1002/jnr.10145. [DOI] [PubMed] [Google Scholar]
- Wang J, Campbell IL. Innate STAT1-dependent genomic response of neurons to the antiviral cytokine alpha interferon. J Virol. 2005;79:8295–8302. doi: 10.1128/JVI.79.13.8295-8302.2005. [DOI] [PMC free article] [PubMed] [Google Scholar]
- Wong G, Goldshmit Y, Turnley AM. Interferon-gamma but not TNF alpha promotes neuronal differentiation and neurite outgrowth of murine adult neural stem cells. Exp Neurol. 2004;187:171–177. doi: 10.1016/j.expneurol.2004.01.009. [DOI] [PubMed] [Google Scholar]
- Wormald S, Hilton DJ. Inhibitors of cytokine signal transduction. J Biol Chem. 2004;279:821–824. doi: 10.1074/jbc.R300030200. [DOI] [PubMed] [Google Scholar]
- Wormald S, Zhang JG, Krebs DL, Mielke LA, Silver J, Alexander WS, Speed TP, Nicola NA, Hilton DJ. The comparative roles of suppressor of cytokine signaling-1 and -3 in the inhibition and desensitization of cytokine signaling. J Biol Chem. 2006;281:11135–11143. doi: 10.1074/jbc.M509595200. [DOI] [PubMed] [Google Scholar]
- Yang J, Tugal D, Reiss CS. The role of the proteasome-ubiquitin pathway in regulation of the IFN-gamma mediated anti-VSV response in neurons. J Neuroimmunol. 2006;181:34–45. doi: 10.1016/j.jneuroim.2006.07.018. [DOI] [PMC free article] [PubMed] [Google Scholar]