Abstract
Poly(ethylenimine) (PEI) is one of a number of polycations that has been used successfully to transfer genes into living cells. Although PEI shows promise in the field of gene therapy, to date no rigorous proof of mechanism has been published regarding the fate of PEI/DNA administered for transfection. Here we show, by using fluorescent labeling and confocal microscopy, the paths of PEI/DNA complexes from endocytosis to gene expression. We found that complexes attach to cell surfaces and migrate into clumps that are endocytosed. The endocytotic vesicles grow in number and size and are occasionally seen to lyse. Most interesting is the fact that endocytosed PEI, whether administered with or without DNA, undergoes nuclear localization in the form of ordered structures.
Nonviral methods of gene delivery have been used in cell transfection for years, with cationic polymers and liposomes (and combinations of the two) showing the highest transfection efficiencies of chemical-based delivery systems. One such system, which uses poly(ethylenimine) (PEI) for gene delivery, has been used with increasing popularity because its description as a transfection agent in 1995 (1). Since that time, PEI has been tested on a variety of cell types and live animals to establish its efficacy (2–7). Although many groups have made speculations as to the mechanism of PEI transfection that are consistent with published results, to this time no rigorous proof of mechanism has been published regarding the fate of PEI/DNA administered for transfection. The work described herein demonstrates the intracellular paths taken by PEI complexes used for transfection.
MATERIALS AND METHODS
Cells.
The experiments described here were performed in vitro on the EA.hy 926 cell line kindly provided by C. Edgell (Univ. North Carolina, Chapel Hill, NC). These cells were derived from a fusion of the human cell line A549 with human umbilical vein endothelial cells (8). They were chosen because they are immortal and they demonstrate many characteristics of human endothelial cells, such as human factor VIII-related antigen expression (8) and prostacyclin production (9).
EA.hy 926 cells (passage 49–54) were grown in 75-ml culture flasks (Corning) at 37°C in a humid 5% CO2 atmosphere. Each flask held 10 ml of growth medium, composed of DMEM (high glucose; GIBCO) plus 10% fetal bovine serum, penicillin at 100 units/ml, streptomycin at 100 μg/ml, and HAT (100 μmol/liter hypoxanthine, 0.4 μmol/liter aminopterin, 16 μmol/liter thymidine) (Sigma). The cells were passed roughly once per week via trypsinization (8).
Cell Wells.
Each experiment was begun by seeding ≈50,000 cells per well in 6-well culture plates (Corning), where each well contained a sterile glass coverslip. The total medium volume per well was 2 ml after seeding. The cells were incubated for 41 hours before transfection.
Transfection.
Cells were transfected as described (7), except that the 100 μl of PEI/DNA complexes were made at a 7.5:1 PEI amine/DNA phosphate ratio and contained 3.6 μg of DNA. Complexes were added to cell wells containing growth medium without serum at time 0. The cells were incubated at 37° and 5% CO2 for 2 hours, at which time the transfecting medium was replaced with 2 ml of complete medium. Incubation was continued until the appropriate time for all time points greater than 2 hours. (Cells read at time points ≤2 hours did not receive a medium replacement after transfection.)
Labeled PEI.
PEI with a reported average Mr of 25,000 (Sigma) was diluted to a concentration of 10 mg/ml with 0.1 M sodium bicarbonate. The PEI was then transferred to microcentrifuge tubes in 1-ml aliquots. While stirring, 50 μl of prepared tag [Oregon Green 488 carboxylic acid, succinimidyl ester (Molecular Probes), in DMSO at 10 mg/ml] was added to each of the microcentrifuge tubes, after which stirring continued for 1 hour in the dark at room temperature. The stirring was then followed by an additional incubation of at least 1 hour in the dark. The labeled PEI could then be used for transfection or stored at 4°C.
Plasmids.
pEGFP-N1 (CLONTECH), pEBFP-N1 (CLONTECH), and 2 versions of pGeneGrip (p403, Gene Therapy Systems, San Diego) were all used for trafficking experiments. The vector pEGFP-N1 codes for the enhanced green fluorescent protein, whereas pEBFP-N1 codes for a blue-fluorescing mutant of the same protein. The p403 vector is a rhodamine-labeled vector that codes for an enhanced green fluorescent protein. In addition to the rhodamine-labeled vector, the supplier also graciously provided an unlabeled version of the plasmid to serve as a control. All unlabeled plasmids were amplified to sufficient quantities by using standard molecular biology techniques, including harvesting and purification via QIAfilter Maxi- or MegaPrep kits (Qiagen, Chatsworth, CA).
Microscopy.
A Zeiss LSM 410 confocal microscope, set up from an Axiovert 135 microscope, was used for the optical sectioning of cells. An argon/krypton mixed gas laser with excitation lines at 488, 568, and 647 nm was used to induce fluorescence. Excitation of the green fluorophores was achieved by using the 488 nm excitation line, with the resulting fluorescent wavelengths observed by using a 515–540 nm band pass filter. Red fluorescence was induced by the 568 nm excitation line and detected as 575–640 nm wavelengths (with the 568 nm wavelength removed from the resultant fluorescent image).
Observations.
At the appropriate time point, each coverslip was removed from its cell well and washed in a stream of PBS. After drying the bottom of the coverslip, it was then mounted on the ends of two partial glass slides, and one drop of PBS was placed on top to keep the cells from drying out. Confocal analysis was performed on each sample of living cells for no more than 30 minutes. The cells ranged in thickness from 2.6–8.3 μm, with confocal sections typically taken every 0.32–0.46 μm. Except for Figs. 1a and 4a, which were sections taken near coverslip surfaces, all figures shown are sections taken well within cell interiors.
Figure 1.
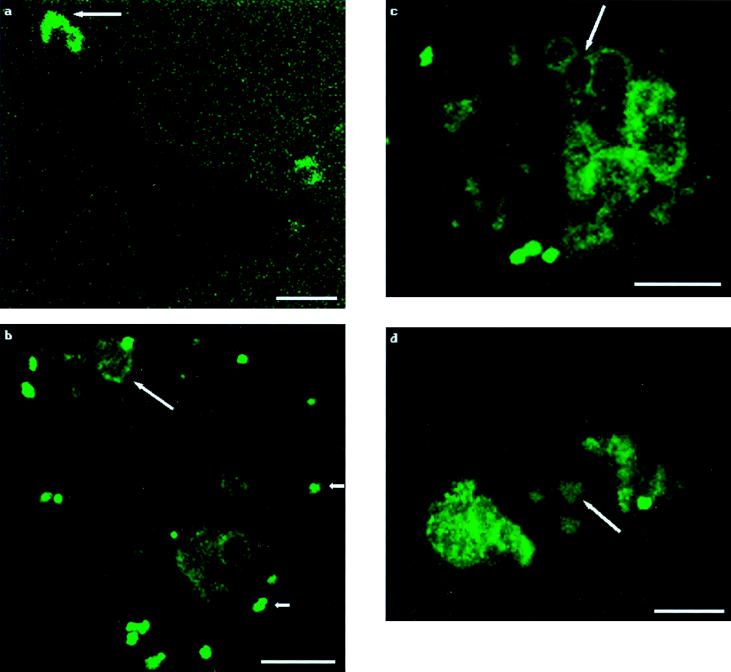
Tracking of labeled-PEI/DNA complexes. Each panel shows one cell. Times posttransfection are as follows. (a) At 30 minutes posttransfection, a patch of fluorescence is apparent on the exterior of the cell (which is visible only as a silhouette), as indicated by the arrow. Note that the background shows evenly scattered fluorescence. (b) At 3 hours posttransfection, clumps of fluorescence are present on the plasma membrane (short arrows), and endosomes are forming (long arrow). (c) At 3.5 hours posttransfection, endocytotic vesicles are larger and more numerous. Fluorescence is concentrated at the inner surfaces of these vesicles, illustrated by the arrow. (d) At 4.5 hours posttransfection, one of three packets of fluorescence that are easily distinguishable in the nucleus is indicated by the arrow. (Bar = 10 μm.)
Figure 4.
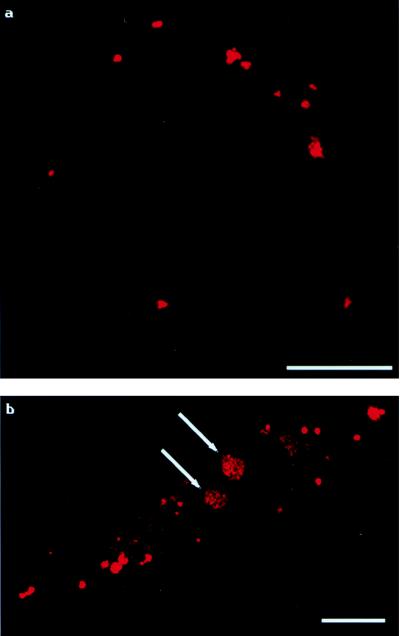
Administration of labeled PEI to cells without plasmid present. Each panel shows one cell. (a) At 2.5 hours posttransfection, as with labeled complexes, labeled PEI initially forms discrete aggregates on cell exteriors. (b) At 6.0 hours posttransfection, even without plasmid present, labeled PEI enters cell nuclei in an organized fashion. The arrow indicates PEI within the cell nucleus. (Bar = 10 μm.)
RESULTS AND DISCUSSION
PEI/DNA complexes with labeled PEI were administered to cells, and the paths of the labeled PEI were noted at various time points (Fig. 1). Immediately after administration to cells, there was faint fluorescence distributed homogeneously throughout the cell well, with no fluorescence appearing on the coverslip after washing (data not shown). After 5 minutes, label was detected homogeneously on coverslip surfaces, but by 30 minutes posttransfection the general fluorescence had begun to fade (Fig. 1a). Fluorescent clumps first appeared on cell surfaces at 30 minutes posttransfection and increased in number over the next 1–2 hours (Fig. 1 a and b). The appearance of fluorescence on cell surfaces as patches can be explained by the possibility that the complexes were migrating to specific areas on plasma membranes after cellular attachment. If the labeled complexes were to enter cells via random disruption of cell membranes, we would expect to see attachment of complexes on the entire surface of transfected cells. Because the complexes were noted in large (relative to the size of one complex) patches on cell surfaces, we assert that the complexes are attaching to discrete features of the plasma membrane that could then migrate to common areas, such as coated pits, for endocytosis.
By 3 hours posttransfection, discrete patches of fluorescence surrounded the plasma membranes of the labeled-PEI/DNA transfected cells. There were larger, dimmer vesicles in the cytoplasms of these cells as well (Fig. 1b). By 3.5 hours, the number and size of these cytoplasmic vesicles increased (Fig. 1c). The increase in size was most likely caused by fusion of vesicles such as endosomes and lysosomes. We also noted that fluorescence was often more concentrated at the inside surfaces of the vesicles, which were once the point of attachment of the PEI/DNA complexes on the cell exteriors (Fig. 1 b and c).
Also noted at the 3.5-hour time point was the first evidence of fluorescence inside nuclei. The fluorescence was very faint, but existed in rounded, well defined structures. The number of cells with fluorescent nuclear structures also increased with time (Fig. 1 c and d). The finding of nuclear localization of PEI/DNA complexes is consistent with recent work that shows PEI/DNA complexes are transported into cell nuclei after microinjection, where normal endocytotic trafficking and processing have been circumvented (10).
Occasionally some of the above-mentioned cytoplasmic vesicles showed signs of disruption beginning at 4 hours posttransfection. Thus, there appeared to be two fates for the tagged particles after endocytosis: they could remain within vesicles and/or retain their close association noted by large aggregations of fluorescence, or they could freely disperse relatively homogeneously in the cytoplasm after disruption of endosomes or endolysosomes.
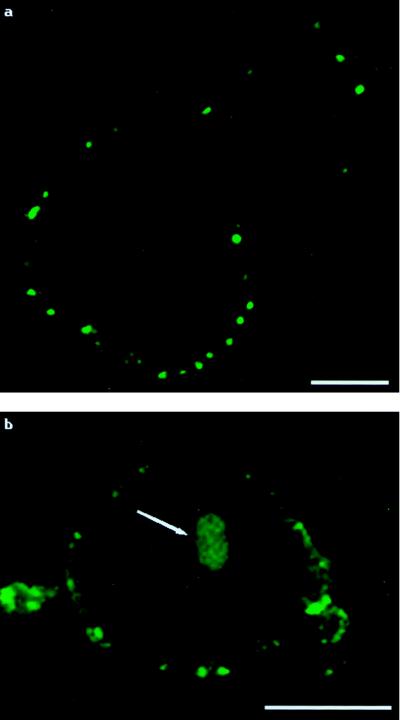
PEI/DNA complexes using active, labeled plasmid were examined in the same fashion as above. The key features noted with PEI labeling also were found in these samples. Most notably, fluorescence initially began to clump in discrete patches on cell membranes (Fig. 2a), and by 2–3 hours, cytoplasmic vesicles began to form. As time progressed, the number of cytoplasmic vesicles increased as before. The appearance of fluorescence within nuclei initially occurred 3–4 hours posttransfection, and occurred in discrete, easily defined patches, as was seen in the labeled-PEI/DNA experiments (Fig. 2b).
Figure 2.
Tracking of PEI/labeled-DNA complexes. The pattern of fluorescence is similar to that of labeled-PEI/DNA complexes. Each panel shows one cell. (a) At 2.5 hours posttransfection, complexes are seen as clumps on the cell exterior. (b) At 4 hours posttransfection, organized fluorescence is present within nuclei (indicated by arrows). (Bar = 10 μm.)
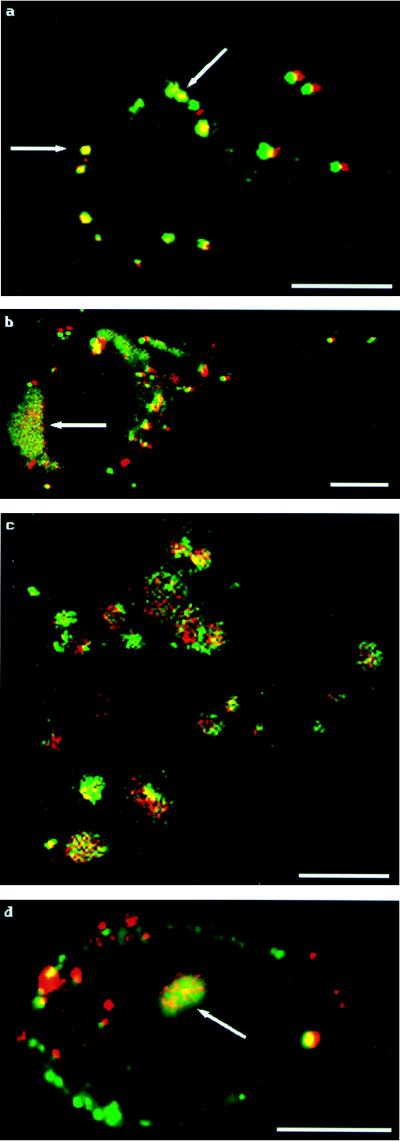
To further characterize PEI/DNA trafficking, double-labeled PEI/DNA complexes were administered to cells to verify whether the PEI and DNA separated at some time before the DNA entered the nucleus. If the PEI and DNA were in very close proximity, then the fluorescence in the figures would appear yellow (the combination of red plus green light) as illustrated in Fig. 3. The results obtained support the results of experiments that used single labeled PEI/DNA complexes: the labeled entities initially appeared as clumps on cell surfaces (Fig. 3a), then endocytotic vesicles began to form and increased in number as time progressed (Fig. 3 b and c). The first appearance of labeled complexes within nuclei occurred at 3.5 hours posttransfection. Although there was evidence of some separation of DNA from its carrier PEI in the cytoplasm, the nuclear fluorescence was predominantly yellow, indicating that the PEI and DNA that make their way into cell nuclei do so as associated complexes (Fig. 3d). The observed nuclear fluorescence was always in the form of an ordered structure—no faint fluorescence was ever detected homogeneously throughout the nuclei. We noted that the earliest time of nuclear fluorescence was at a time point 60 minutes sooner than the earliest time of reporter expression, so we believe that these structures are a part of the transfection process and precede the expression of the delivered gene.
Figure 3.
Tracking of double-labeled PEI/DNA complexes. The fluorescence patterns for single-labeled complexes are also seen for double-labeled complexes. (a) At 2 hours posttransfection, visible complexes appear as clumps on the cell’s exterior, as indicated by arrows. (b) At 3 hours posttransfection, both surface aggregation and endosomes are visible. The arrow indicates endosomal formation. (c) At 4 hours posttransfection, endosomes containing both PEI and DNA are visible throughout the cell cytoplasm. (d) At 4.5 hours posttransfection, fluorescent structures containing both PEI and DNA inside the cell nucleus are present, as indicated by the arrow. (Bar = 10 μm.)
The mechanism of how the complexes enter cell nuclei is as yet unexplained but may involve the interaction of PEI/DNA complexes with anionic lipids. At some point during trafficking, the complexes might come into contact with phospholipids that are continually being synthesized for membrane regeneration. Because phospholipids have a negative charge on their head group, they would readily interact with positively charged PEI or PEI/DNA complexes. It has been shown that specific cationic lipids and polymers interact with negatively charged lipids (11, 12). The phospholipids could coat the complexes and perhaps present their lipid groups to interact with the nuclear membrane. The coated complexes might fuse with the nuclear envelope and ultimately release the PEI/DNA complexes into the nucleus.
Alternatively, the tight adherence of complexes to endocytic or endolysosomal vesicle membranes could play a part in PEI/DNA nuclear trafficking. After the complex-carrying vesicle membranes are permeabilized and inactivated by PEI and/or bursting caused by osmotic swelling, the complexes might remain adhered to the membranes. In this fashion, the complexes would retain a phospholipid coating and could enter the nucleus via fusion with the nuclear envelope.
To ensure that the labeled PEI was not getting into cell nuclei merely by virtue of being associated with the delivered plasmid, cells were treated with only labeled PEI. Without plasmid present, the labeled PEI still behaved as it did in the previous transfection experiments. We noted the by-now-familiar clumping of labeled PEI on cell surfaces in the earlier time points, with the eventual trafficking of the polymer into cell nuclei (Fig. 4).
The order of events seen in these transfection experiments is summarized as follows: By 30 minutes after transfection, PEI/DNA complexes began to attach to cell surfaces and form aggregates. Endocytosis of the complexes was common at 2–3 hours posttransfection, and nuclear localization of PEI or PEI/DNA complexes was relatively common by 3.5–4.5 hours after administration to cells. The earliest localization of complexes within nuclei preceded the earliest observed transgene expression by 1 hour.
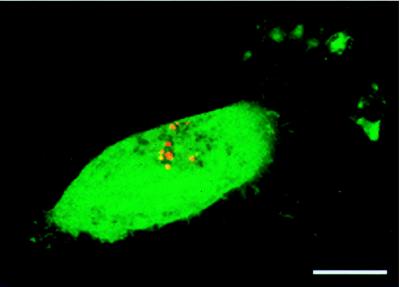
In cases where the delivered plasmid coded for the green fluorescent protein, positive transfection was easily discerned from scattered green label by the complete and intense fluorescence of entire cells. Fig. 5 is an example of a positively transfected cell, expressing the GFP reporter, which demonstrates the locations of the delivered plasmids. In the early stages of transfection we have shown there was red (DNA) fluorescence both inside cell cytoplasms and nuclei, but the tagged plasmids were located primarily in cell nuclei at later time points (such as that shown in Fig. 5).
Figure 5.
Location of delivered plasmid in a positively transfected cell (74 hours posttransfection). Evidence of positive transfection is easily noted by the expression of the green fluorescent protein reporter. The location of labeled plasmid can be seen by the colors red and yellow, located primarily in this cell’s nucleus.
Previous studies focusing on PEI’s interactions with various cellular components have been published. Helander et al. (13, 14) showed that free PEI disrupts the outer membrane of Gram-negative bacteria. This might be extended to indicate a disrupting action of complexed PEI on the plasma, endosomal, or endolysosomal membranes of mammalian cells. However, Oku et al. (15) have shown that although branched (and linear) PEI does act as a fusogen for phosphatidylserine/phosphatidylcholine liposomes, it does not alter their permeability. The conflicted findings might be explained by the fact that the Helander et al. experiments were performed on living bacteria as opposed to isolated phospholipid vesicles as used by Oku et al. Klemm et al. (16) showed that, for basic unit concentrations of 0.001 M and above, PEI has a negative effect on lysosomal stability. Other implications of lysosomal involvement in PEI/DNA trafficking stem from increased transfection efficiency in the presence of chloroquine (6).
Although the mechanism by which PEI appears in cell nuclei has yet to be elucidated, the fact still remains that this nonviral gene delivery vehicle does enter nuclei in the form of an ordered structure. The potential for PEI or other polycations used for gene delivery to adversely interact with host genes therefore exists and presents itself as a concern in regard to using these methods to treat human disease with gene therapy.
Acknowledgments
We thank Dr. Bernard F. Andruss for his assistance with the confocal microscope. This material is based on work supported under a National Science Foundation Graduate Fellowship (W.T.G.) and the National Institutes of Health (A.G.M. and K.K.W.).
ABBREVIATION
- PEI
poly(ethylenimine)
Footnotes
This paper was submitted directly (Track II) to the Proceedings Office.
References
- 1.Boussif O, Lezoualc’h F, Zanta M A, Mergny M D, Scherman D, Demeneix B, Behr J P. Proc Natl Acad Sci USA. 1995;92:7297–7301. doi: 10.1073/pnas.92.16.7297. [DOI] [PMC free article] [PubMed] [Google Scholar]
- 2.Lambert R C, Maulet Y, Dupont J-L, Mykita S, Craig P, Volsen S, Feltz A. Mol Cell Neurosci. 1996;7:239–246. doi: 10.1006/mcne.1996.0018. [DOI] [PubMed] [Google Scholar]
- 3.Boussif O, Zanta M A, Behr J P. Gene Ther. 1996;3:1074–1080. [PubMed] [Google Scholar]
- 4.Abdallah B, Hassan A, Benoist C, Goula D, Behr J P, Demeneix B A. Hum Gene Ther. 1996;7:1947–1954. doi: 10.1089/hum.1996.7.16-1947. [DOI] [PubMed] [Google Scholar]
- 5.Boletta A, Benigni A, Lutz J, Remuzzi G, Soria M, Monaco L. Hum Gene Ther. 1997;8:1243–1251. doi: 10.1089/hum.1997.8.10-1243. [DOI] [PubMed] [Google Scholar]
- 6.Ogris M, Steinlein P, Kursa M, Mechtler K, Kircheis R, Wagner E. Gene Ther. 1998;5:1425–1433. doi: 10.1038/sj.gt.3300745. [DOI] [PubMed] [Google Scholar]
- 7.Godbey, W. T., Wu, K. K. & Mikos, A. G. (1999) J. Biomed. Mater. Res., in press. [DOI] [PubMed]
- 8.Edgell C S, McDonald C C, Graham J B. Proc Natl Acad Sci USA. 1983;80:3734–3737. doi: 10.1073/pnas.80.12.3734. [DOI] [PMC free article] [PubMed] [Google Scholar]
- 9.Suggs J E, Madden M C, Friedman M, Edgell C-J S. Blood. 1986;68:825–829. [PubMed] [Google Scholar]
- 10.Pollard H, Remy J S, Loussouarn G, Demolombe S, Behr J P, Escande D. J Biol Chem. 1998;273:7507–7511. doi: 10.1074/jbc.273.13.7507. [DOI] [PubMed] [Google Scholar]
- 11.Xu Y, Szoka F., Jr Biochemistry. 1996;35:5616–5623. doi: 10.1021/bi9602019. [DOI] [PubMed] [Google Scholar]
- 12.Oku N, Shibamoto S, Ito F, Gondo H, Nango M. Biochemistry. 1987;26:8145–8150. doi: 10.1021/bi00399a019. [DOI] [PubMed] [Google Scholar]
- 13.Helander I M, Latva-Kala K, Lounatmaa K. Microbiology. 1998;144:385–390. doi: 10.1099/00221287-144-2-385. [DOI] [PubMed] [Google Scholar]
- 14.Helander I M, Alakomi H L, Latva-Kala K, Koski P. Microbiology. 1997;143:3193–3199. doi: 10.1099/00221287-143-10-3193. [DOI] [PubMed] [Google Scholar]
- 15.Oku N, Yamaguchi N, Yamaguchi N, Shibamoto S, Ito F, Nango M. J Biochem. 1986;100:935–944. doi: 10.1093/oxfordjournals.jbchem.a121806. [DOI] [PubMed] [Google Scholar]
- 16.Klemm A R, Young D, Lloyd J B. Biochem Pharmacol. 1998;56:41–46. doi: 10.1016/s0006-2952(98)00098-7. [DOI] [PubMed] [Google Scholar]


