Abstract
Mach bands, the illusory brightness maxima and minima perceived at the initiation and termination of luminance gradients, respectively, are generally considered a direct perceptual manifestation of lateral inhibitory interactions among retinal or other lower order visual neurons. Here we examine an alternative explanation, namely that Mach bands arise as a consequence of real-world luminance gradients. In this first of two companion papers, we analyze the natural sources of luminance gradients, demonstrating that real-world gradients arising from curved surfaces are ordinarily adorned by photometric highlights and lowlights in the position of the illusory bands. The prevalence of such gradients provides an empirical basis for the generation of this perceptual phenomenon.
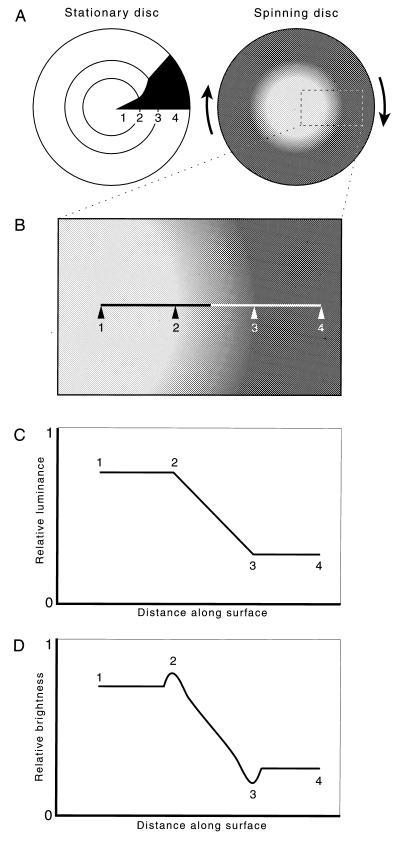
In 1865, Ernst Mach, the physicist who among other achievements laid the groundwork for Einstein’s theory of relativity, described dark and light bands universally seen when viewing luminance gradients that lack any photometric basis for such perceptions (1). The stimulus that Mach used was a wheel with black and white sectors that, when spun, provided a linear gradient linking a uniformly lighter region nearer the center of the disk with a uniformly darker region nearer its periphery (Fig. 1). In response to this stimulus, observers perceive an illusory band of maximum lightness at the initiation of the gradient, and a band of maximum darkness at its termination.
Figure 1.
Mach bands. (A) Diagram of the painted disk used by Mach to elicit the Mach band illusion. When the disk is spun, a luminance gradient is established between points 2 and 3, which links the uniformly lighter center of the stimulus (1) and the uniformly darker region at its periphery (4). (B) Enlargement of a portion of the stimulus in A, indicating the nature and position of Mach bands. A band of illusory lightness is apparent at position 2, as is a band of illusory darkness at position 3. (C) Because the portion of the black sector between points 2 and 3 in A is a segment of an Archimedean spiral, the luminance gradient generated between the corresponding points on the spinning disk is linear, as indicated by this photometric measurement along the line in B. (D) Diagram of the perception of the photometric profile in C, indicating the illusory lightness maximum at the initiation of the linear gradient 2, and the illusory minimum at its termination 3. Mach ruled out the possibility that these illusions arise from movement of the disk by observing that the light and dark bands are equally apparent in photographs, as is evident here.
Mach proposed that the perception of these illusory bands is a direct consequence of physiological interactions in the eye, and elaborated a detailed mathematical model of this process based on reciprocal inhibition between neighboring retinal points, a theory that he continued to modify and improve over several decades (2–4). Despite a great deal of additional work on Mach bands during the subsequent century (reviewed in ref. 5), the general theory proposed by Mach still stands as the conventional explanation of this striking illusion (e.g., refs. 5–10).
In this and the following paper we present evidence for a different explanation of Mach bands, which, if correct, may have broad implications for understanding other aspects of visual perception. The motivation for our investigation was the nature of simultaneous brightness contrast (11). Like Mach bands, the illusory perception of luminance contrasts (e.g., a gray test patch on a dark background looks brighter than an equiluminant patch on a light background) had also been explained as the direct perceptual manifestation of antagonistic lateral interactions among lower order visual neurons (e.g., ref. 5). Demonstrations by Gilchrist (12), Adelson (13), and others (reviewed in ref. 11), however, made this explanation unlikely. In considering alternative ways of understanding the well documented influence of context on brightness, we concluded that the standard illusions of simultaneous brightness contrast could be accounted for simply as a function of the most probable real-world sources of the luminance profiles in question (14, 15). In this empirical concept of these illusions, perceptions of brightness are taken to be associations determined by what inherently ambiguous luminance profiles have most often signified. Such associations would be instantiated by neural connections engendered during phylogeny as a result of natural selection and modified during ontogeny by activity-dependent processes (reviewed in ref. 16).
Accordingly, we wondered whether Mach bands might also arise because ambiguous stimuli trigger an association determined, in this instance, by the nature and prevalence of luminance gradients in the real world.
METHODS
Computer Graphics.
All graphics were created on Macintosh G3 computers (Apple) or PowerTower Pro 225 (Power Computing, Round Rock, TX), by using Adobe illustrator 7.0 and photoshop 5.0 (Adobe Systems, Mountain View, CA); the computer modeling was generated with Strata studio pro 2.1 (St. George, Utah), employing both ray tracing and radiosity algorithms, and measured by using NIH image (version 1.61).
Analysis of Photometric Gradients.
The luminance gradients associated with computer generated objects were analyzed by converting the gradients into grayscale values by using photoshop 5.0. A photometric analysis of each image was then performed (see above); in this way, the relative luminosity was determined from the grayscale values across the relevant surfaces, as indicated in the graphs in many of the figures. Note that the cathode ray tube grayscale values over the range used in the present study are linearly related to luminance values measured with a conventional photometer (ref. 17, pp. 415–416). The digital information in photographs was converted into grayscale values using photoshop 5.0 and measured in the same way. Measuring the luminance profiles in digital photographs of real-world gradients closely approximates the three-dimensional-to-two-dimensional transformation that occurs when such gradients are projected onto the retina in normal viewing.
Radiosity and Specularity of Surfaces.
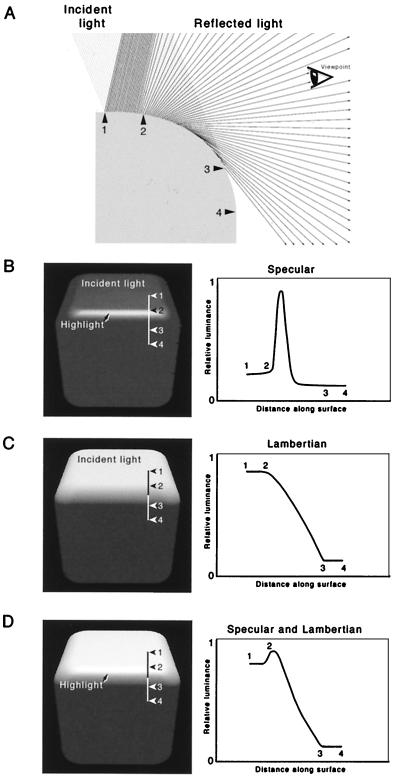
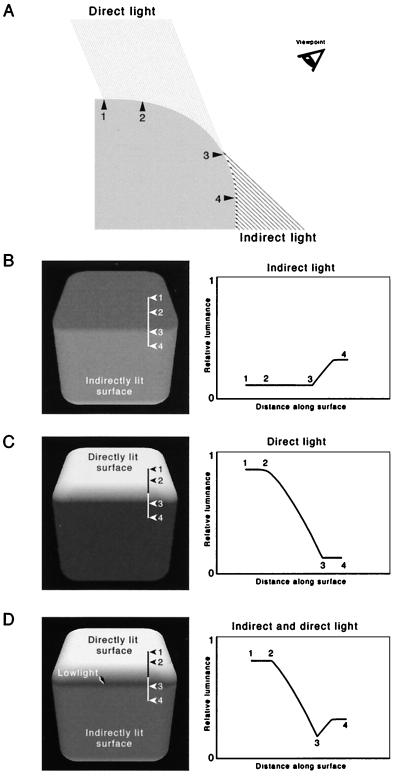
The achromatic appearance of any surface (its lightness or brightness) depends on its qualities vis a vis the reflection of light. These qualities can give rise to specular reflection and diffuse or Lambertian reflection. Specularly reflected light causes highlights, which are a special feature of surfaces capable of reflecting light preferentially at its angle of incidence (see Fig. 5). In the computer modeling used here, the specular aspects of a scene were generated by ray-tracing algorithms, which faithfully represent highlights arising from the specular qualities of the modeled surfaces. The Lambertian qualities of a surface are those that tend to make it a perfect diffuser, each point on the surface reflecting light equally in all directions. The relative radiance of a Lambertian surface can be calculated by using radiosity methods (18), an approach used in our computer modeling of lowlights (see, for example, Fig. 6).
Figure 5.
The generation of highlights by the specular properties of surfaces. (A) Diagram indicating that when a curved surface has specular as well as Lambertian properties, a highlight will be seen because, for any eye position (indicated by the icon), there is a point on the curved surface that reflects light to the eye at the incident angle. (As in previous figures, numbers indicate corresponding surface points in the subsequent panels). (B) Luminance profile for a specular surface seen from the viewpoint in A, determined for the rendered cube shown in Fig. 4. (C) Luminance profile for a Lambertian surface, as in Fig. 4, seen from the viewpoint in A. (D) The luminance profile derived by combining the curves in B and C. Because most natural surfaces have both specular and Lambertian properties, the luminance gradients generated by curved surfaces are typically adorned by a view-dependent highlight at the onset of the gradient from the better lit to the shadowed surface.
Figure 6.
The generation of lowlights by indirect illumination. (A) The model is the same as that in Figs. 4 and 5, except that the surface is now lit by indirect as well as direct light, the condition of illumination in natural settings. (B) The luminance profile for a perfectly Lambertian surface seen from the viewpoint in A when the illumination is from indirect light only; numbers indicate corresponding points, as in previous figures. (C) The complementary falloff of direct light across a Lambertian surface, as in Fig. 4. (D) The luminance profile derived by combining the curves in B and C. When a curved surface is illuminated by both direct and indirect sources (the sun and its reflected light, for instance), the luminance profile will have a lowlight near the offset of the gradient.
RESULTS
Luminance gradients between light and dark flanking surfaces, the stimuli used to elicit the Mach band illusion, arise in a variety of natural circumstances. The major sources are (i) luminance gradients generated by the penumbras of shadows cast by objects interposed between a light source and the surface on which the shadow occurs; (ii) luminance gradients generated by curved surfaces; and (iii) luminance gradients arising from specifically painted or treated surfaces, such as the disk used by Mach and others to elicit the illusion in question (see Fig. 1). Luminance gradients can also be generated by the diminishment of light with distance from a local source, although this phenomenon is not apparent in direct sunlight because the distance of the source is vastly greater than distances on the earth’s surface. Deciphering the structure of the luminance gradients associated with these different sources and their prevalence is, we argue, the key to understanding Mach bands.
Luminance Gradients Generated by the Penumbras of Cast Shadows.
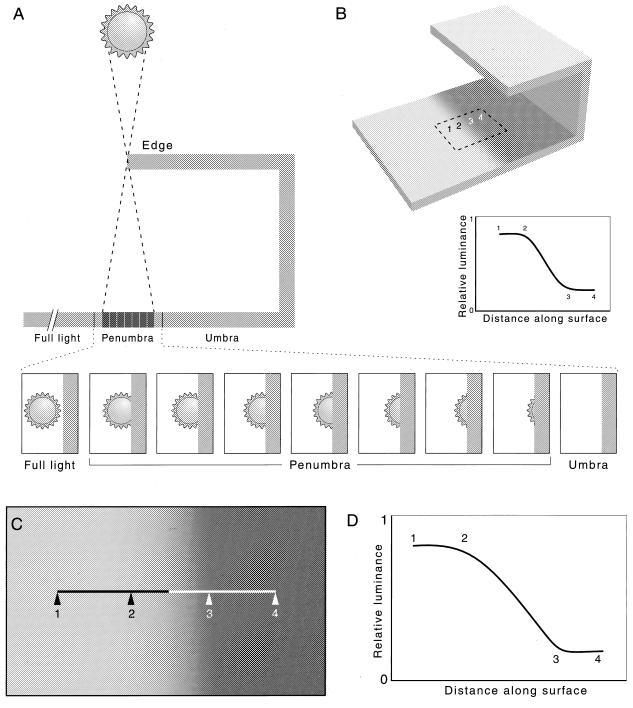
The first of the major sources of luminance gradients in natural settings is the penumbras of cast shadows. Penumbras are the gradients between a better and a less well lit zone that arise when a shadow-casting object occludes an extended light source. As explained in Fig. 2, penumbras arise in nature because the sun is not a point source, but a disk about 0.5° in diameter; as a result of this geometry, the profile of penumbras associated with cast shadows in sunlight is typically sigmoidal, and thus slightly different in form from the luminance gradients used to elicit Mach bands (see Fig. 1 and the appendix in ref. 19).
Figure 2.
Luminance gradients associated with the penumbras of shadows cast by the sun. (A) Diagram of a shadow-casting object between the sun and the surface on which the shadow is cast. Enlargement of the penumbral region shows the fraction of the sun’s disk exposed at each point along the surface. Penumbral gradients arise as a result of the progressive diminishment of sunlight reaching the surface between the region of full illumination and the region of full shadow (the umbra). Whereas the region in full light receives illumination from the entire disk of the sun, the portion of the surface at the shadow’s edge is deprived of light in proportion to the occlusion of the disk by the shadow-casting object. (B) View of the surface in A, showing the appearance of the penumbra and the luminance profile it generates (Inset). The gradient shown in the inset was calculated according to the geometrical argument in the appendix of ref. 19 (specifically from Eq. 11); numbers indicate corresponding points. (C) Digital photograph of the penumbra cast on a flat surface by an edge about 2 m distant, with the sun at approximately its highest point. Line indicates the orientation and extent of the luminance profile measured photometrically in D. (D) Empirical confirmation of the calculated penumbral profile in B by photometric measurement (see Methods); numbers 1–4 indicate corresponding points in C and D. Whereas the luminance profile generated by the Mach stimulus in Fig. 1 is linear, the gradients associated with the penumbras generated by sunlight are sigmoidal.
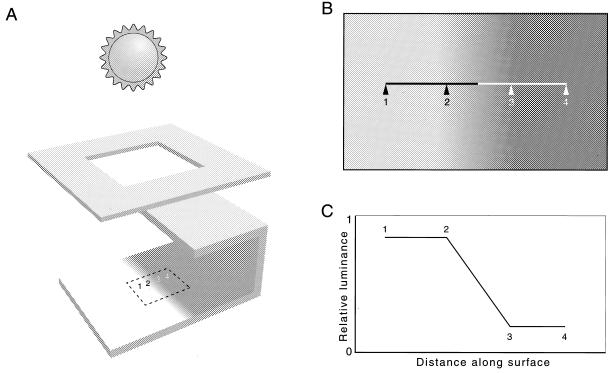
Under special conditions, however, the penumbra of a cast shadow can generate a linear luminance gradient that mimics the Mach stimulus (Fig. 3). These conditions are met when the shape and orientation of the source is such that the progressive diminishment of light across the surface on which the penumbra is cast decreases arithmetically instead of exponentially, the decrement thus being the same for each unit length of the surface (see appendix in ref. 19). In fact, textbooks sometimes present penumbras created in this way as a simple means of demonstrating Mach bands in the classroom, although these accounts (including Mach’s) make no mention of the unusual shape of the light source vis a vis the sun or most other sources of illumination (see, for example, ref. 5, pp. 43–46).
Figure 3.
A rectilinear light source can generate a shadow with an unusual penumbra identical to the luminance profile created by the Mach disk (see Fig. 1). (A) When a rectilinear occluder is placed in the orientation diagrammed here, the equation used to calculate the luminance profile of penumbras generated by the sun can be simplified (see appendix, in ref. 19), because the amount of light reaching the surface in this circumstance changes arithmetically instead of exponentially across the region of the penumbra. (B and C) As a consequence, the luminance profiles of the penumbras created in this way are linear rather than sigmoidal, thus mimicking the luminance profile generated by Mach’s spinning disk (see Fig. 1). Such stimuli elicit the perception of Mach bands, as can be appreciated by examining the computer-generated stimulus shown in B (the photometric measurement in C indicates that the bands seen in response to viewing the stimulus in B are entirely illusory).
Although the conditions illustrated in Fig. 3 may sometimes arise in nature (e.g., a shaft of sunlight constrained to rectilinearity by a concatenation of branches that casts the shadow of an edge that happens to be parallel with the edge of the source), penumbras with linear luminance gradients are, because of their special provenance, infrequent compared with the sigmoidal penumbral profiles shown in Fig. 2. The luminance gradients generated by most natural shadows are, therefore, different in structure from the linear gradient generated by Mach’s spinning disk (cf. Fig. 1), or by the atypical shadowing circumstances diagrammed in Fig. 3 (and explained more rigorously in the appendix of ref. 19).
Luminance Gradients Generated by Curved Surfaces and Their Adornment by Highlights and Lowlights.
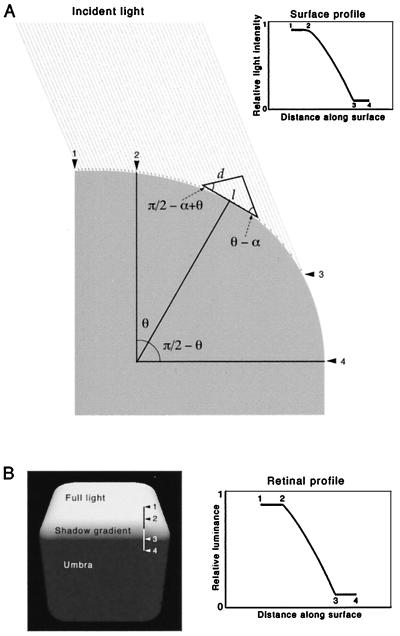
The second major category of naturally occurring luminance gradients is generated by curved surfaces (Fig. 4). Whereas a flat surface with uniform properties reflects a constant proportion of the light falling on it, a curved surface necessarily gives rise to a luminance gradient because, whatever the angle of incidence, a variable amount of light reaches each unit area of the surface as it curves away from (or toward) the source. (The source here is assumed to be sunlight, so that the falloff of light intensity as a function of distance can be ignored).
Figure 4.
Luminance gradients generated by curved surfaces. (A) The attached shadow on the surface of a cube with a symmetrically curving edge is preceded by a luminance gradient between points 2 and 3. The amount of incident light (IL) reaching each unit length of the curved surface is directly proportional to the extent of side (d) of a triangle constructed on base (l), where (d) is orthogonal to the direction of the incident light. If the surface is assumed to reflect light equally in all directions (i.e., to be perfectly Lambertian; see Methods), the luminance profile is given by the variation of length (d) across the curved surface. The equation for this function is I = cos(π/2 − α + θ). The light illuminating the surface in this model falls to zero at the point where the orientation of the line tangent to the surface (l) becomes parallel to the direction of the incident light. Inset shows the relative light intensity across the curved surface calculated in this way. (B) A computer-rendered surface with perfectly Lambertian properties, illuminated at the same angle as in A. Graph shows the relative luminance across the surface (see Methods); numbers indicate corresponding points. The gradients generated by curved surfaces are different from the gradients generated by the penumbras of cast shadows in sunlight (see Fig. 2) in that they are more nearly linear. The profile in B is slightly different from the calculated profile in A because of the three-dimensional-to-two-dimensional transformation of the computer-generated image. Although concave surfaces also generate linear luminance gradients, note that a concave surface cannot be represented by the Mach stimulus (see Fig. 1) because the gradient must be reversed with respect to the flanking regions, thus creating contrast edges.
The gradient illustrated in Fig. 4B, however, is not the stimulus that typically confronts an observer in the presence of a luminance gradient generated by a curved surface. The analysis in Fig. 4 is predicated on a surface that reflects perfectly in all directions (called a Lambertian surface; see Methods), whereas the surfaces of most natural objects have a degree of specularity. That is, most surfaces have some ability to reflect light specifically at the angle of incidence, as well as to reflect light isotropically. As a result, the luminance profile in Fig. 4 will typically be distorted by highlights. When the surface in question, like most natural surfaces, has some specularity, a maximum in the luminance profile generated by a convexly curved surface occurs at or near the onset of the gradient (Fig. 5).
The luminance gradient generated by a curved surface such as that in Fig. 5 will also exhibit a lowlight (Fig. 6). Lowlights arise because objects are typically illuminated by indirect as well as direct light (e.g., sunlight reflected from the atmosphere or objects on the surface of the earth, in addition to light coming directly from the sun). The major source of indirect sunlight is skylight, which, because of the reflecting properties of the atmosphere, is approximately isotropic. Light reflected from objects on the surface of the earth, however, is anisotropic, much of this light being opposite in direction to the primary source (simply because surfaces orthogonal to the direction of the primary light source will be most strongly illuminated and therefore the source of most directionally specific reflected light). The result of these typical conditions of illumination in natural settings (or with indoor lighting, for that matter) is a region of minimum reflection from a curved surface, which will always be at or near the termination of the luminance gradient generated by the direct light (for the reasons explained in Fig. 6).
DISCUSSION
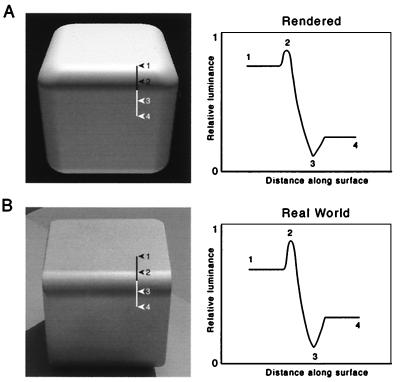
As a result of these fundamental properties of light and its interaction with objects, most nonlinear luminance gradients in the natural world (generated predominantly from penumbras) will lack photometric highlights and lowlights. Conversely, linear luminance gradients, which are generated predominantly by curved surfaces (both convex and concave), will often be adorned with a highlight at the onset of the gradient and a lowlight at its termination. These conclusions can be readily confirmed by comparing the appearance of the luminance profile determined for the model cube in Figs. 4–6 with the luminance profile measured for a similar real object illuminated by the sun, as illustrated in Fig. 7.
Figure 7.
Comparison of the luminance profile determined for the model in Figs. 4–6 with the luminance profile measured across a similarly curved surface of a real object in sunlight. (A) Left shows the model cube in the preceding several figures, here accorded both Lambertian and specular properties, and rendered as if illuminated by both direct and indirect light (i.e., a model that incorporates the conditions of illumination and surface qualities presented independently in Figs. 4–6). Right shows the luminance gradient measured along the line across the curved edge of the cube; numbers indicate corresponding points. (B) Digital photograph of an actual aluminum cube (polished to a reflectance of about 33%) with a rounded edge (radius of curvature = 0.95 cm) illuminated by the sun (near its highest point). Right shows the corresponding luminance profile measured along the line across the curved edge, as in A. The photometrically determined luminance gradients of both the model and its real-world counterpart are similar to the illusory profile perceived in response to viewing stimuli that elicit Mach bands (see Figs. 1 and 3). (Note that the perception of the two cubes presented here does not necessarily represent their luminance profile any more accurately than does the perception of the stimuli in Figs. 1 and 3, in which illusory Mach bands are apparent).
In the accompanying paper (19), we argue that seeing Mach bands in response to stimuli that have no corresponding photometric maxima and minima is an empirical consequence of the fact that many luminance gradients are normally adorned by highlights and lowlights.
Supplementary Material
Acknowledgments
We thank Alli McCoy for her participation in the initial phases of this work; Larry Hawkey and Ann Richards for technical assistance; Tim Andrews, David Coppola, Alli McCoy, Tom Polger, John Thomas, and Len White for helpful criticism; and Feraz Rahman, Sid Simon, and Ginny Knight for help with the mathematical analysis. This work was supported by National Institutes of Health Grant NS29187.
References
- 1.Mach E. Classe Kaiserlichen Akad Wiss. 1865;52:303–322. [Google Scholar]
- 2.Mach E. Classe Kaiserlichen Akad Wiss. 1866;54:131–144. [Google Scholar]
- 3.Mach E. Classe Kaiserlichen Akad Wiss. 1868;57:11–19. [Google Scholar]
- 4.Mach E. The Analysis of Sensation and the Relation of the Physical to the Psychical, trans. Williams, C. M., revised by Waterlow, S. New York: Dover; 1914. [Google Scholar]
- 5.Ratliff F. Mach Bands: Quantitative Studies on Neural Networks in the Retina. San Francisco: Holden-Day; 1965. [Google Scholar]
- 6.Cornsweet T N. Visual Perception. New York: Academic; 1970. [Google Scholar]
- 7.Goldstein L B. Sensation and Perception. 4th Ed. Pacific Grove, CA: Brooks–Cole; 1996. [Google Scholar]
- 8.Rock I. Perception. New York: Scientific American; 1995. [Google Scholar]
- 9.Sekular R, Blake R. Perception. 3rd Ed. New York: McGraw–Hill; 1994. [Google Scholar]
- 10.Coren S, Ward L M, Enns J T. Sensation and Perception. 4th Ed. Orlando, FL: Harcourt Brace; 1993. [Google Scholar]
- 11.Adelson E H. In: The Cognitive Neurosciences. 2nd Ed. Gazzaniga M, editor. Cambridge, MA: MIT Press; 1999. , in press. [Google Scholar]
- 12.Gilchrist A L. Science. 1977;195:185–187. doi: 10.1126/science.831266. [DOI] [PubMed] [Google Scholar]
- 13.Adelson E H. Science. 1993;262:2042–2044. doi: 10.1126/science.8266102. [DOI] [PubMed] [Google Scholar]
- 14.Williams S M, McCoy A N, Purves D. Proc Natl Acad Sci. 1998;95:13296–13300. doi: 10.1073/pnas.95.22.13296. [DOI] [PMC free article] [PubMed] [Google Scholar]
- 15.Williams S M, McCoy A N, Purves D. Proc Natl Acad Sci. 1998;95:13301–13306. doi: 10.1073/pnas.95.22.13301. [DOI] [PMC free article] [PubMed] [Google Scholar]
- 16.Purves D. Neural Activity and the Growth of the Brain. Cambridge, U.K.: Cambridge Univ. Press; 1994. [Google Scholar]
- 17.Wandell B A. Foundations of Vision Science. Sunderland, MA: Sinauer; 1995. [Google Scholar]
- 18.Ashdown I. Radiosity: A Programmer’s Perspective. New York: Wiley; 1997. [Google Scholar]
- 19.Lotto R B, Williams S M, Purves D. Proc Natl Acad Sci. 1999;96:5245–5250. doi: 10.1073/pnas.96.9.5245. [DOI] [PMC free article] [PubMed] [Google Scholar]
Associated Data
This section collects any data citations, data availability statements, or supplementary materials included in this article.


