

Abstract
Dopamine is a catecholaminergic neuromodulatory transmitter that acts through five molecularly-distinct G protein-coupled receptor subtypes (D1 – D5). In the mammalian spinal cord, dopaminergic axon collaterals arise predominantly from the A11 region of the dorsoposterior hypothalamus and project diffusely throughout the spinal neuraxis. Dopaminergic modulatory actions are implicated in sensory, motor and autonomic functions in the spinal cord but the expression properties of the different dopamine receptors in the spinal cord remain incomplete. Here we determined the presence and the regional distribution of all dopamine receptor subtypes in mouse spinal cord cells by means of quantitative real time PCR and digoxigenin-label in situ hybridization. Real-time PCR demonstrated that all dopamine receptors are expressed in the spinal cord with strongly dominant D2 receptor expression, including in motoneurons and in the sensory encoding superficial dorsal horn (SDH). Laser Capture Microdissection (LCM) corroborated the predominance of D2 receptor expression in SDH and motoneurons. In situ hybridization of lumbar cord revealed that expression for all dopamine receptors was largely in the gray matter, including motoneurons, and distributed diffusely in labeled cell subpopulations in most or all laminae. The highest incidence of cellular labeling was observed for D2 and D5 receptors, while the incidence of D1 and D3 receptor expression was least. We conclude that the expression and extensive postsynaptic distribution of all known dopamine receptors in spinal cord corresponds well with the broad descending dopaminergic projection territory supporting an widespread dopaminergic control over spinal neuronal systems. The dominant expression of D2 receptors suggests a leading role for these receptors in dopaminergic actions on postsynaptic spinal neurons.
Keywords: Monoamines, catecholamines, D1-like, D2-like, mouse, ISH
Dopamine (DA) is well-established as a dominant catecholamine neurotransmitter in the brain, where it exerts its actions via 5 molecularly-distinct receptors often sub-classified as D1-like (D1 and D5) and D2-like (D2, D3, and D4). A large body of literature has detailed the diverse functions of these receptor subtypes (Joyce, 1983, Jackson and Westlind-Danielsson, 1994, Jaber et al., 1996, Missale et al., 1998).
The distribution of individual dopamine receptor subtypes has been analyzed in much detail, using immunohistochemistry, receptor ligand binding, or in situ hybridization (ISH) techniques. Most of this research has focused on the brain (Meador-Woodruff and Mansour, 1991, Weiner et al., 1991, Bergson et al., 1995, Yung et al., 1995, Gurevich and Joyce, 1999, Hurd et al., 2001, Kumar and Patel, 2007).
There are extensive dopaminergic projections in the spinal cord (Skagerberg et al., 1982, Skagerberg and Bjorklund, 1985, Skagerberg et al., 1988, Holstege et al., 1996), and a number of authors have demonstrated modulatory actions of dopamine in the cord (Carp and Anderson, 1982, Barasi and Duggal, 1985, Fleetwood-Walker et al., 1988, Hasegawa et al., 1990, Skoog and Noga, 1995, Kemnitz, 1997, Garraway and Hochman, 2001, Clemens and Hochman, 2004, Tamae et al., 2005). However, there is only a limited description on the distribution of the different dopamine receptors in spinal cord neurons (Dubois et al., 1986, Schambra et al., 1994, Yokoyama et al., 1994, van Dijken et al., 1996, Levant and McCarson, 2001, Zhao et al., 2007). A more recent approach to identify the distribution of dopamine receptor subtypes in the CNS cells with high spatial resolution is available at the Gene Expression Nervous System Atlas (GENSAT) Project (www.gensat.org). GENSAT employs bacterial artificial chromosome transgenic vectors where endogenous protein coding sequences have been replaced by sequences encoding the EGFP reporter gene, and dopamine receptor-expressing cells are identified by their EGFP expression. However, the reports for the spinal cord are incomplete.
Dopamine actions in the spinal cord
Descending dopaminergic projections are implicated in exerting antinociceptive actions (Fleetwood-Walker et al., 1988). These actions may occur at least in part by modulating activity on primary afferent terminals since dopamine has excitatory, inhibitory or mixed effects on dorsal root ganglia neurons (Gallagher et al., 1980, Abramets and Samoilovich, 1991, Molokanova and Tamarova, 1995). Actions on spinal neurons themselves are also implicated since dopamine directly inhibits neurons in the pain-encoding dorsal horn region, the substantia gelatinosa (Tamae et al., 2005). D1-like receptors are also implicated in the induction of LTP phenomena in C-fibers in the dorsal horn (Yang et al., 2005).
Dopamine also modulates spinal reflex excitability, but the contribution of the different dopamine receptors to spinal reflex excitability is not well known, except that D2-like receptor agonists depress monosynaptic ‘stretch’ reflexes in cat, rat, and mouse (Carp and Anderson, 1982, Gajendiran et al., 1996, Clemens and Hochman, 2004). We have shown recently that both D2 and D3 receptors contribute to the observed reflex depression (Clemens and Hochman, 2004). Additionally, D1-like and D2-like receptors can modulate the locomotor program in the isolated spinal cord (Barriere et al., 2004), but only D1-like receptors seem to be involved in recruitment of the locomotor pattern.
To obtain a more comprehensive understanding of dopamine-related actions in the spinal cord, we examined the distribution of all five known dopamine receptor subtypes in the lumbar spinal cord of the 14 day old mouse, using non-radioactive ISH, quantitative real time PCR, and post-hoc imaging techniques. The lumbar spinal cord was region was preferentially chosen since this region is where the majority of studies on spinal cord sensory and motor function are undertaken. P14 was chosen as an age that overlaps with numerous in vitro electrophysiological studies, where weight-bearing and locomotion are fully functional (Jiang et al., 1999) and with a mature or near-mature sensory system (Fitzgerald, 2005). Our data establish that (i) all five known dopamine receptor subtypes are expressed in spinal neurons, with a preponderance of D2 receptor expression, and (ii) receptor distribution is found throughout the dorsoventral axis with clear labeling in presumed motoneurons in the ventral horn.
Some of this work has been published in abstract form (Zhu et al., 2004).
Experimental procedures
1. Animals and slide preparations
All experimental procedures complied with the NIH guidelines for animal care and the Emory Institutional Animal Care and Use Committee. A total of 13 male C57BL/6 mice (postnatal day 14) were used for this study. For the in situ hybridization (ISH) experiments, animals (n = 10) were anesthetized with intraperitoneal injection of urethane (2 mg/kg body weight) before being perfused with 1/3 volume:weight cold heparinized saline followed by equal volume:weight 4% paraformaldehyde in 0.1 M phosphate buffer (PB), pH 7.4. The spinal cords were harvested, post-fixed in 4% paraformaldehyde for 1 hour at 4° C, and placed in cryoprotectant consisting of RNAase free 10% sucrose in 50 mM PB for 2 hours at 4° C. Lumbar segments of the spinal cord (L4-L6) were removed and placed in OCT embedding compound (Electron Microscopy Sciences, Hatfield, PA) and frozen with dry ice. The tissue block was sectioned transversely on a Leitz 1720 cryostat (Leica, Bannockburn, IL) at 10 μm and thaw mounted onto glass slides. All slides were stored at −80° C until use.
2. Immunocytochemistry
Slides were brought to room temperature and washed overnight in 0.1M phosphate-buffered saline (PBS), pH7.4. Tissue was incubated in mouse anti-NeuN (1:50, Chemicon) and rabbit anti-glial fibrillary acidic protein (GFAP; 1:1000, Chemicon) diluted in PBS containing 0.3% triton x-100 (PBS-T) for 72 hours at 4° C. Slides were then washed 3×30 min in PBS-T at room temp. Sections were then incubated in Cy3 donkey anti-mouse (1:250, Jackson Immunoresearch) and FITC donkey anti-rabbit (1:100, Jackson Immunoresearch) diluted in PBS-T for 1.5 hrs at room temp. Slides were than washed 20 min in PBS-T followed by 2×20 min in 50mM Tris-HCl, pH 7.4, and then coverslipped with Vectashield (Vector Laboratories) and photographed on a Nikon E-800 microscope.
3. Quantitative real time RT-PCR and laser capture microdissection (LCM)
For the quantification of the different receptor subtype levels in the spinal cord, 3 animals were anesthetized as before and decapitated. The complete spinal cords were quickly dissected out and stored in RNAlater (Qiagen, Valencia, CA) until use, when they were extracted to process for real-time PCR. Total RNA was extracted from these cords by using Qiagen RNeasy Mini kits (Qiagen, Valencia, CA) and cDNA was synthesized by using the High Capacity cDNA Archive Kit (Applied Biosystems, Bedford, MA, USA), allowing us to compare the levels of gene expression relative to the housekeeping gene GAPDH (Law et al., 1999). The primers for the different dopamine receptors used in the real-time PCR are listed in Table 1.
Table 1. Primers used for real time PCR.
| Forward primer 5′ 3′ | Reverse primer 5′-3′ | Amplicon GenBank # | Size (bp) | |
|---|---|---|---|---|
| D1 | AACTGTATGGTGCCCTTCTGTGG | CATTCGTAGTTGTTGTTGCCCCG | NM-010076 | 230 |
| D2 | CACTCCGCCACTTCTTGACATACA | TCTCCTCCGACACCTACCCCGA | X55674 | 208 |
| D3 | GTCCTGCCCTCTCCTCTTTGGTTT | AGTCTACGGTGCCCTGTTTAC | X67274 | 310 |
| D4 | TGCCCTCAACCCCATCATCTACAC | AATACTTCCGACCCCCAACCCT | NM-007878 | 202 |
| D5 | GGGAGATCGCTGCTGCCTATGTC | TTTTAGAGTGGTGAGTGGGGGTTA | NM-013503 | 221 |
Real-time PCR was performed using the ABI PRISM 7000 Sequence Detection System (Applied Biosystems, Bedford, MA, USA) to determine mRNA expression in motoneurons or superficial dorsal horn. Total volume reaction is 25 μl using SyBr Green Master Mix reagent (Applied Biosystems); 3 μl of cDNA was used as template for the reaction, with 10 μM forward and reverse primers. Both targets and GAPDH amplifications were performed in duplicate. Thermal cycling conditions included 2 min at 55° C and 10 min at 95° C, followed by 40 cycles of 95° C for 15 s, 55° C for 1 min, 95° C for 15 s, 60° C for 20 s, and 95° C for 15 s.
To normalize the amount of total mRNA present in each reaction, levels of the GAPDH were monitored in parallel samples. Results are expressed as relative levels of mRNA, referred to as control samples (D2 is the control calibrator, for the whole spinal cord and for the LCM samples of SDH and motoneurons). The amount of targets, normalized to an endogenous reference (GAPDH) and relative to the calibrator, was defined by the Ct (threshold cycle) methods (Livak and Schmittgen, 2001).
To examine relative dopamine receptor expression levels in sensory and motor regions of the spinal cord, we isolated total RNA from the superficial dorsal horn and lumbar region of the mouse spinal cord using laser capture microdissection (LCM). Three mice (postnatal day 14) were used in LCM. One day before the mice were killed for LCM, 50 μl of Fluoro-Gold (Fluorochrome, Denver, CO; 1% in saline) was injected intraperitoneally to retrogradely label spinal motoneurons (Cui et al., 2006). After the spinal cords were dissected out, a spinal segment containing L2-L4 was cut and placed on a cryostat chuck covered with tissue-embedding medium (OCT; Electron Microscopy Sciences, Hatfield, PA). Fresh frozen 8-μm sections were cut using a cryostat and stored at −80 °C with desiccant until use. All sections were mounted on slides that had been coated with a Teflon-like spray, polytetrafluoroethylene (Electron Microscopy Sciences), and autoclaved before use. Immediately before LCM, each slide was fixed in ice-cold acetone for 4 min and dehydrated as follows: 75% ethanol for 30 s, 95% ethanol for 30 s, 100% ethanol for 30 s. The tissue was cleared in xylene for 5 min and air dried. The PixCell II LCM system (Arcturus, Mountain View, CA) was used to visualize and capture Fluoro-Gold-labeled motoneurons as well as the superficial dorsal horn region (laminate I-II). In total, for each animal, 300 motoneurons and 60 sections of the superficial dorsal horn were captured. Fifteen μl of Arcturus denaturing buffer was added to each cap to lyses cells and denature proteins. The cap was incubated at 42° C for 30 minutes and cell lysates were spun into microfuge tube. Total RNA was isolated by using Arcturus Picopure kit (Arcturus, Mountain View, CA). The total RNA was amplified two rounds by using RiboAmp® RNA Amplification Kit (Arcturus, Mountain View, CA). Both RNA isolation and amplification instructions were provided by the manufacturer.
4. In situ hybridization probes
Non-radioactive single-stranded digoxigenin (DIG)-labeled cRNA probes were used for ISH. Complete mouse spinal cords were dissected out and the whole cords were stored in RNAlater (Qiagen, Valencia, CA) at −80° until use. Total RNA was extracted from the mouse spinal cord by using Qiagen RNeasy Mini kits (Qiagen, Valencia, CA). Five microgram of total RNA was subject to cDNA synthesis with oligo-dT15 primer and SuperScript II Reverse transcriptase (Invitrogen, Carlsbad, CA) for one hour at 42° C. The reverse transcriptase was inactivated, and RNA was degraded by heating at 95° C for 5 min. Of the 20 μl of cDNA obtained from the synthesis reaction 5 μl were directly added to the PCR reaction using a PCR Mastermix kit (Eppendorf, Hamburg, Germany) containing 1 μM gene-specific primers. The primers used in this study were designed by the Invitrogen-OligoPerfect™ Designer program (Invitrogen, Carlsbad, CA) and are listed in Table 2. The five dopamine receptor probe sequences were compared with nucleotide-nucleotide BLAST sequences. We found that the alignment of the long-sequence probes developed were highly-homologous to their respective reported gene sequences, with homologies between 92 and 100% (refer to Table 3). With respect to overlapping sequence homologies to other dopamine receptors genes, the D2, D3 and D4 probes had negligible sequence homology to any other dopamine receptor genes. Although we found that the D1 and D5 probe sequences vs. D5 and D1 gene sequences had short regions (about 60 b.p. length) of high homology (84%), these homologies were too weak to produce stray binding (Henderson, 1996).
Table 2. Primers used for in situ hybridization.
| Forward primer 5′ 3′ | Reverse primer 5′-3′ | Amplicon GenBank # | Size (bp) | |
|---|---|---|---|---|
| D1 | CCTTCATTCCAGTGCAGCTAA | AGCCAAACCACACAAATACATC | NM-010076 | 501 |
| D2 | CTCAGGAGCTGGAAATGGAG | AGAGGACTGGTGGGATGTTG | X55674 | 399 |
| D3 | GTCCTGAGGCAAAGGCGAAG | TTTCGAACCTCTAAGCTGAGCT | X67274 | 398 |
| D4 | AGGGTCAGTGCCAGCTGC | GCTCCCTTCCCGTGATCTT | NM-007878 | 501 |
| D5 | CCACTGCTTCCATCCTGAAT | ATGCTCAGCTGCCCTTTCTA | NM-013503 | 422 |
Table 3. Alignment test for homology of the different ISH dopamine receptor probe sequences.
Table reports alignment of developed probes to their respective reported gene sequences, with homologies between 92 and 100%. While D2, D3 and D4 probes had negligible sequence homology to their respective other dopamine receptors, the D1 and D5 probe sequences vs. D5 and D1 gene sequences had short regions (about 60 b.p. length) of high homology. Base-pair length with homologies and their percentages are reported.
| D1 gene | D2 gene | D3 gene | D4 gene | D5 gene | |
|---|---|---|---|---|---|
| D1 probe |
469bp/501 bp
93% |
n/a | n/a | n/a | 66bp/74bp; (44%)
53bp/62bp; (85%) |
| D2 probe | n/a |
391bp/400bp
97% |
19% | n/a | n/a |
| D3 probe | n/a | n/a |
370bp/399bp
93% |
n/a | n/a |
| D4 probe | n/a | n/a | n/a |
464bp/501bp
92% |
n/a |
| D5 probe | 17bp/86bp (82%)
37bp/43bp (86%) |
n/a | n/a | n/a |
340bp/340bp
100% |
The PCR reaction conditions consisted of 35 cycles of the following: 94° C for 90 sec, 55° C for 30 sec, 72° C for 2 min followed, by a 10 min extension at 72° C. Reactions were analyzed by electrophoresis in ethidium bromide containing 1% agarose gel. All of the RT-PCR products analyzed gave a band of the expected size (s. Table 2) and were cleaned by using QIAquick Gel Extraction Kit (Qiagen). These cleaned RT-PCR products were subcloned into pGEM-T Easy vector (Promega, Madison, WI) containing both T7 and Sp6 RNA polymerase promoters. The inserted fragments for specific dopamine receptor subtypes were sent to the Emory DNA Sequencing Core Facility for DNA sequencing. The results of the DNA sequencing were checked against the GenBank DNA sequence database using the Nucleotide-nucleotide BLAST program of the Basic Local Alignment Search Tool (BLAST; www.ncbi.nlm.nih.gov/blast/). After linearization, single-stranded, digoxigenin-labeled anti-sense and sense probes were synthesized by in vitro transcription at 37° C for two hours with DIG-11-UTP (Roche, Indianapolis, IN) and either T7 or Sp6 RNA polymerase (Promega) as described by the supplier. DIG-labeled cRNA probes were stored at −80° C until used.
5. In situ hybridization
The stored spinal cord sections maintained at −80° C were brought to room temperature and air dried completely. The ISH protocol was performed as described previously (Buck et al., 2000). Briefly, sections were permeabilized with proteinase K (1 μg/ml in 0.1 M Tris-HCl and 50 mM ethylenediaminetetraacetic acid (EDTA) pH 8, 15 min at room temperature) before pre-hybridization in hybridization buffer (50 % formamide, 5 x standard saline citrate (SSC) (0.15 M NaCl, 15 mM NaC6H5O7, pH 7.0), 20 μg/ml Yeast tRNA, 10 μg/ml Heparin, 5 mM EDTA, 1x Denhardt’s solution, 0.1 % Tween 20) for 4 hours at 68° C. Hybridization was carried out at 68° C overnight in the same buffer with 3 μg/ml digoxigenin-labeled antisense cRNA probe. Sense probes were used at identical concentrations as the negative controls. The sections were then washed in the following concentrations of SSC: 1x SSC for 10 minutes at 60° C, 1.5x SSC for 10 minutes at 60° C, two washes with 2x SSC for 20 minutes at 37° C. Sections were digested with RNAseA (0.1 μg/ml) in 2x SSC at 37° C for 30 minutes, followed by two 10-minute washes in 2x SSC at room temperature, and two final 20-minute washes in 0.2x SSC at 65° C. Slides were equilibrated in maleic acid buffer (0.1 M maleic acid, 0.15 M NaCl, pH 7.5), and blocked for 1 hour in maleic acid buffer containing 1% blocking reagent (Roche, Roche Diagnostic Corp, Indianapolis, IN). Sections were then incubated with anti-digoxigenin-alkaline phosphatase, Fab fragments (1:5000, Roche) in blocking buffer overnight at 4° C and then washed twice in maleic acid buffer for 30 minutes each. Slides were subsequently developed in color development buffer (0.1 M Tris, pH 9.5, 0.1 M NaCl, 50 mM MgCl2, 0.1 % Tween 20, 10 % polyvinyl alcohol, 0.315 mg/ml nitroblue tetrazolium, 0.175 mg/ml bromo-chloro-indoyl-phosphate). The color development reaction was carried out in the dark and neutralized with color stop buffer (10 mM Tris, pH 5, 1 mM EDTA). The color development reaction was monitored intermittently and stopped when a just visible reaction product was seen in the sense probe of the sense/antisense probe pairs. This time period differed for each of the dopamine receptor subtypes but ranged between 30–60 minutes. Slides were then dehydrated through a series of alcohol (75 %, 95 % and 100 % alcohol) washes, cleaned in Histoclear (National Diagnostics, Atlanta, GA) for 5 minutes, coverslipped with Vectamount (Vector Labs, Burlingame, CA), and viewed on a Nikon E800 light microscope (Nikon, Melville, NY).
6. Data and Image analysis
For the real time PCR analysis, all values are given as mean ± S.E. We used SigmaPlot and SigmaStat (SPSS Science, Chicago, IL) to analyze the data and test for significant differences using One Way ANOVA and subsequent post-hoc All-Pairwise-Multiple Comparisons procedures. Differences were considered significant if p < 0.05.
Images were digitized with Nikon ACT-1 software, using identical settings for both sense and antisense probes for each receptor subtype respectively, and converted into gray scale images. Image editing and montages were performed subsequently using CorelDraw software (Corel, Ottawa, Ontario). For cell counts, processed transverse-sectioned slides were examined under a E-800 Nikon microscope equipped with epifluorescence, a digital camera and Neurolucida (Microbrightfield) software. Outlines of spinal sections were drawn at high magnification and a digital montage was created for future reference at one focal plane. Cells on one side of the cord ending at the midline were counted using a live video image and adjusting focal planes to count all cells with cytoplasmic labeling having clear nuclei present. Regional cellular counts were determined following separation of spinal regions that approximate Rexed’s laminae (see Fig. 9).
Figure 9.

Incidence of D1–5 receptor cell labeling in various spinal laminae in comparison to that of the selective neuronal marker NeuN. A. Histograms represent mean number of NeuN+ cells per entire spinal hemisegment as a whole (all) or in separate laminae. Values represent averages from 2 animals ± S.E., and values from each animal were obtained as the mean value from 4 separate 10 μm sections. Image at right is a representative section with counted neurons indicated by white dots. Note that laminae I–III contain the greatest neuron density. B. Incidence and distribution of cells labeled with D1 through D5 receptor antisense probes expressed relative to the mean number of NeuN+ cells obtained in the same 2 animals in A. Percentage of labeled cells are shown for all spinal regions combined. Significant differences were observed between D2 and D1, D2 and D3, D2 and D4, between D1 and D5, and D3 and D5 (all p<0.001). Differences were also found between D3 and D4 (p=0.013) and D4 and D5 (p=0.002; all tests: One-Way-ANOVA with All-Pairwise Bonferroni Comparison). C. Incidence and distribution of cells labeled with D1 through D5 receptor antisense probes expressed relative to the mean number of NeuN+ cells obtained in the same 2 animals in A. Percentage of labeled cells are shown for the separated laminae. Note that D2 and D5 receptors appear to be expressed in the largest number of cells throughout the spinal gray matter. Note also that the incidence of labeling in lamina IX (gray bar) is the highest among all laminae for all five receptor subtypes.
Results
Using the primers listed in Table 1, we first performed real-time PCR to assess the relative expression levels of dopamine receptors in the cord. Figure 1A shows the relative expression values reported normalized to D2 receptor expression in the whole spinal cord. Note that D2 receptors are expressed at much higher values than the other dopamine receptors. The expression of D1, D3, D4, and D5 were all significantly lower than the D2 receptor (p < 0.001). The low levels of D3 and D4 receptors may relate to a prominent presynaptic distribution on descending dopaminergic and primary afferents terminals (Levant, 1997) rather than on postsynaptic spinal cord neurons. Real-time PCR for D2 and D4 receptors was further undertaken on two microdissected spinal cord regions in the rostral lumbar spinal cord; the superficial dorsal horn (laminae I–III) and on motoneurons in lamina IX of the ventral horn (Fig 1B), identified retrogradely by injection with Fluorogold (s. Methods). Motoneurons and the superficial dorsal horn (SDH) were isolated using LCM and their RNA amplified with two rounds of amplification. Note that, D2 and D4 receptors had sufficient copy numbers to be detected in the SDH and motoneurons with real-time PCR, and in both regions we found a significantly greater expression of D2 compared to D4 receptors (p = 0.002). Thus, D2 dopamine receptor expression appears to be the dominant receptors expressed by cells in the spinal cord. To further explore the distribution of dopamine receptor expression in the spinal cord, we undertook in situ hybridization studies.
Figure 1.
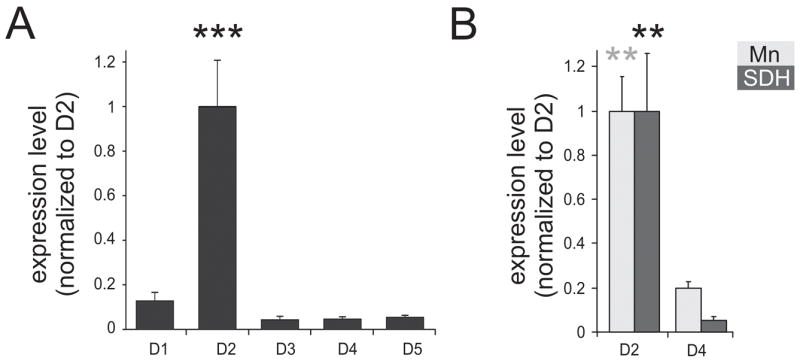
Quantitative real time PCR of dopamine receptors (n = 3). A. Real-time PCR of dopamine receptors in the whole spinal cord. Expression levels are normalized to D2 expression levels. B. Relative expression of D2 and D4 receptor levels in motoneurons (Mn), as identified by retrograde labeling with Fluorogold, and the superficial dorsal horn (SDH) of the lumbar cord. In both regions D2 receptor expression was significantly greater than D4 receptor expression (p=0.002). Values are expressed as mean ± S.E.
Topographic distribution of D1–5 receptors
After establishing the expression of the 5 dopamine receptor subtypes in cord, we next used digoxigenin-labeled anti-sense hybridization probes to determine the topographic distribution of the dopamine receptor subtypes (n = 3 mice). Antisense and sense receptor probes were generated as described in Methods and in Tables 2 and 3. Figure 2 compares the relative labeling of antisense and sense probes in sections obtained from the same animal. In each case antisense labeling was considerably stronger, confirming specificity of the antisense strands. As stated in the experimental procedures, paired reactions for sense and antisense probes for each individual dopamine receptor were undertaken separately and for each dopamine receptor the reaction was stopped when overt differences between sense and antisense labeling were seen. Since this time period varied considerably with each dopamine receptor probe pair, it is important to emphasize that relative staining intensity between dopamine receptor subtypes can not be used as an indicator of relative strength of receptor expression.
Figure 2.

Specificity of antisense probes used for in situ hybridization. Top row presents antisense probes for D1–D5 receptors and bottom row shows corresponding sense probes. Images are presented as grayscale negatives.
Prior to describing the distribution of cells expressing dopamine receptors, we first undertook immunocytochemical detection of neurons and astrocytes in adjacent sections from these animals to provide a baseline appreciation of the neuronal/glial distribution, from which the in situ data can be interpreted. As seen in Figure 3, the sections are outlined to differentiate white matter from gray matter and the major gray matter subdivisions of the spinal cord are separated based on approximations into Rexed’s laminae (I–III, IV–VI, VII, VIII, IX, and X) (Brichta and Grant, 1985). Anti-NeuN was used to identify neurons and anti-GFAP was used to identify astrocytes (Fig 3). As expected, NeuN labeling dominates the gray matter while GFAP labeling is dominant in the white matter. Regarding cellular labeling in the gray matter, note that neuronal cell bodies are larger, more overt and more rounded than most labeled astrocytes.
Figure 3.
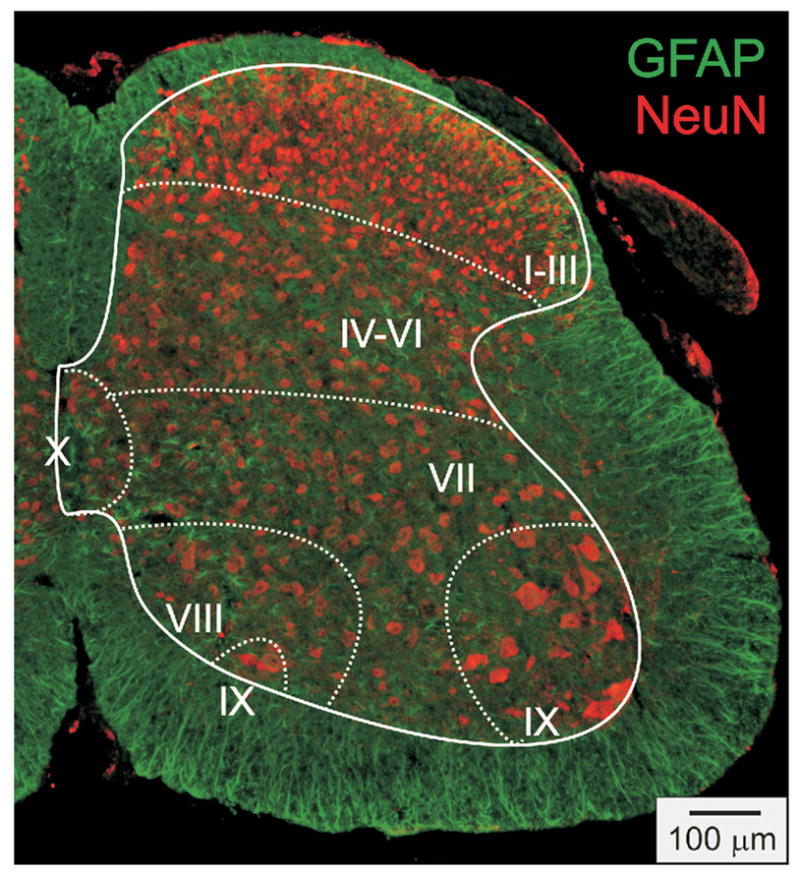
Representative distribution of immunodetected neurons and astrocytes in a section from the lumbar cord. The distribution of labeled neurons is shown with an antibody to the neuron-specific marker NeuN. Distribution of astrocytes is shown using the astrocyte-specific marker GFAP. Surrounding white and internal gray matter are delineated with a solid line. Division of spinal cord into laminae are approximated and separated with dashed lines. Note that in laminae I–III neuronal cell body diameters are generally smaller and cell density is greater than that seen in other laminae. For GFAP, note that labeling is dominant in the white matter, but is also found in gray matter, particularly in the central gray matter.
Figures 4–8 provide representative transverse sections of antisense probes for D1 through D5 receptors in the lumbar spinal cord. Comparison of the topographic distribution of the 5 dopamine receptor subtypes shown in Figures 4–8 allows several general observations to be made: (i) Labeling appears preferentially restricted to the interior gray matter with limited white matter labeling. In this regard, and in relation to their morphology as compared to neuronal labeling presented in Figure 3, it is likely that most cellular labeling is neuronal. Note however that, particularly for D5 receptors, white matter labeling is also apparent, suggesting their additional expression in glial cells (Fig 7). (ii) Labeling was never observed in the epithelial cells surrounding the central canal in lamina X (panel D of Figs 4–8). (iii) Large ventral horn neurons in lamina IX are labeled by all dopamine receptor antisense probes (panel G of Figs 4–8). These neurons are presumably motoneurons. (iv) Labeling appears to be found in all major regions of the spinal cord gray matter (major regions represented in panels B-G). (v) Only subpopulations of cells are labeled in all laminae. This is most easily discerned in lamina IX where large cell labeling predominates (panel G in all figures). (vi) Due to the high density of neurons in the superficial dorsal horn, it is difficult to discriminate an absence of labeling from uniform labeling throughout these laminae. This is particularly true for D2, D3 and D4 receptors (Figs 5, 6 and 7, panel B). However this is not the case for D1 and D5 receptors which expressed a patchwork distribution in the superficial laminae (Figs 4 and 8, panel B).
Figure 4.

D1 receptor distribution in the lumbar spinal cord. A: Photomontage of typical anti-sense D1 labeling. B–G: Enlargements of boxed regions in A for superficial dorsal horn (lamina I–III), deep dorsal horn (lamina IV-VI), central canal area (lamina X), intermediate gray (lamina VII), lamina VIII, and motor nuclei (lamina IX), respectively. In this and subsequent figures, the solid white line delineates spinal gray matter while dashed white lines approximate regions into laminae.
Figure 8.

D5 receptor distribution in the lumbar spinal cord. A: Photomontage of typical anti-sense D5 labeling in spinal cord. B–G: Enlargements of boxed regions in A for superficial dorsal horn (lamina I–III), deep dorsal horn (lamina IV–VI), central canal area (lamina X), intermediate gray (lamina VII), lamina VIII, and motor nuclei (lamina IX), respectively.
Figure 7.

D4 receptor distribution in the lumbar spinal cord. A: Photomontage of typical anti-sense D4 labeling. B–G: Enlargements of boxed regions in A for superficial dorsal horn (lamina I–III), deep dorsal horn (lamina IV–VI), central canal area (lamina X), intermediate gray (lamina VII), lamina VIII, and motor nuclei (lamina IX), respectively.
Figure 5.

D2 receptor distribution in the lumbar spinal cord. A: Photomontage of typical anti-sense D2 labeling. B–G: Enlargements of boxed regions in A for superficial dorsal horn (lamina I–III), deep dorsal horn (lamina IV-VI), central canal area (lamina X), intermediate gray (lamina VII), lamina VIII, and motor nuclei (lamina IX), respectively.
Figure 6.

D3 receptor distribution in the lumbar spinal cord. A: Photomontage of typical anti-sense D3 labeling. B–G: Enlargements of boxed regions in A for superficial dorsal horn (lamina I–III), deep dorsal horn (lamina IV-VI), central canal area (lamina X), intermediate gray (lamina VII), lamina VIII, and motor nuclei (lamina IX), respectively.
In order to provide more quantitative information on cellular labeling in the spinal gray matter, counts of dopamine receptor labeled neurons were undertaken in 2 animals (Fig. 9). We assumed that most of the dopamine receptor labeling in gray matter is neuronal and so report the incidence of labeled cells relative to the total number of spinal neurons (NeuN+ cells) counted in adjacent sections. Average total numbers of neurons in a 10 μm section on one side of the cord is presented in Figure 9A. The incidence of cells labeled with D1–D5 receptors relative to neuron numbers are reported in Figure 9B. Note that D2 and D5 receptors appear to be expressed in the largest number of cells throughout the spinal gray matter with an average of 52% and 46% of ‘neurons’ labeled, respectively. D1 and D3 receptor labeling was found only in a small fraction of neurons at 17% and 12% respectively, while overall D4 receptor labeling was found in 26% of the neurons. The relative differences in incidence of labeling between many of the dopamine receptor subtypes were significant (Fig 9B). Figure 9C shows the distribution of the different receptor subtypes across all laminae. Note that the incidence of labeling in lamina IX, the location of spinal motoneurons, is consistently the highest among all laminae for the five receptor subtypes.
Discussion
This study used real-time PCR and in ISH to examine the expression properties of dopamine receptors in the lumbar spinal cord of young (day 14) mice. Specifically, we attempted to provide a map of their presence in the lumbar cord of juvenile animals, by describing and comparing the spatial distribution of the five known dopamine receptor subtypes. The principal findings are that; (i) all 5 receptors are expressed in the lumbar spinal cord with dominant D2 receptor expression, (ii) the receptor distribution is diffuse in the spinal cord gray matter and found in all spinal laminae, and, (iii) that motoneurons express all five dopamine receptors.
To our knowledge, this is the first study that compares the relative RNA expression amounts of the dopamine receptors in the spinal cord, clearly showing that all receptors are found in the spinal cord. Zhao et al (Zhao et al., 2007) demonstrated the presence of D1, D2 and D3 receptor mRNA in mouse lumbar spinal cord but relative differences in expression were not reported. Using gene expression profiling and real time PCR to measure the expression values of D2, D3 and D4 receptors in adult mouse motoneurons, we previously reported that D3 and D4 receptor expression was low compared to the presence of the D2 receptor (Cui et al., 2006). Our results here, obtained from juvenile mice are consistent with this study (Fig 1B).
Regarding ISH and real time PCR
There are a number of limitations in the interpretation of the ISH data in the present study. The first is that differences in relative staining intensity between the different dopamine receptors types can not be used as a measure of relative expression strength. This is because, among other reasons, color development times differed between the receptor subtypes, and this process was determined by qualitative estimation of staining. For this reason real-time PCR served an important complementary role. Second, aside from motoneurons, one can not determine the extent to which labeling of the various dopamine receptor subtypes is found in similar or discrete cells throughout the spinal cord. However, given that D2 and D5 receptors were found in a large fraction of spinal neurons in all laminae (cf. Fig. 9), it seems likely that these two receptors would be co-expressed in several of these neurons.
Our PCR data show that the D2 receptor is most prominent DA receptor subtype in the whole spinal cord, and that the other DA receptor subtypes are expressed at lower levels that are not significantly different from each other (Fig. 1a). Similarly, LCM of motoneurons and the superficial dorsal horn (SDH) in the lumbar cord reveals that the D2 receptor subtype is much more highly expressed than the D4 subtype (Fig. 1b). Overall, these data suggest that descending dopaminergic actions on spinal cord neurons appear to operate predominantly via activation of postsynaptic D2 receptors.
Distribution of D1-like receptors
D1-like receptors (D1 and D5) share a very high homology in their transmembrane domains, and they exhibit the classical ligand-binding properties of D1 receptors (Missale et al., 1998). In the thoracic spinal cord D1 receptors have been associated with the cell somata and the principal proximal dendrites in the intermediolateral cell column (Gladwell et al., 1999), and using polymerase chain reaction and DNA sequencing, D1 and D5 receptors have been detected in dorsal root ganglia (Xie et al., 1998). We found that while D1 receptor expression quantity was not significantly different from D5 as measured with real-time PCR in the whole cord (cf. Fig. 1A), ISH in the lumbar cord supported a more extensive incidence of cellular labeling for the D5 receptor (cf. Fig. 4, 8).
Dopamine D1 and D5 receptors normally both activate adenylate-cyclase via a Gs-coupled receptor activation (Jaber et al., 1996, Missale et al., 1998, Hervé and Girault, 2005), but they are differentially dependent on the G protein subunit for the activation of adenylate-cyclase (Wang et al., 2001). Thus, despite similarities in receptor distribution, subsequent signal transduction events might be different. Moreover, D1 and D5 receptors can bind differentially to nucleotide binding proteins (Kimura et al., 1995). While D1 receptors couple to both Gs and a pertussis-toxin-sensitive G protein, D5 receptors bind to Gs and a pertussis-toxin-insensitive G protein (Kimura et al., 1995). Therefore, although there is considerable similarity between D1 and D5 receptor distributions, this may not equate with redundant physiological actions.
Distribution of D2-like receptors
Using autoradiographic receptor ligand binding studies, D2 receptors have been detected in the spinal gray matter previously (Bouthenet et al., 1987), and differences in expression levels between dorsal and ventral horn were documented (Yokoyama et al., 1994). A more detailed study in rat combined immunocytochemistry and ISH of D2 receptors (van Dijken et al., 1996) and found somatic D2 receptor expression throughout the dorsal horn, and in the vicinity of the central canal, a pattern similar to our findings in the dorsal horn. However, that study in rat did not observe D2 receptor expression in motoneurons, contrasting with our results in mouse using both quantitative real-time PCR and ISH, and those of a previous study employing expression profiling and quantitative real-time PCR of motoneurons (Cui et al., 2006). While it is possible that these differences are species-specific, incongruities might also arise from the different mouse strains used. For example, and in contrast to our C57BL/6 mice, there is no apparent D2 expression in motoneurons in the FVB/N mouse strain used by the GENSAT project. Furthermore, differences in spinal monoaminergic systems even within rodent substrains have been reported previously (Clark et al., 1991, Shay et al., 2005), demanding caution in generalizing findings on dopamine receptor distributions in different rodents.
The distribution of dopamine D3 and D4 receptors in the mammalian cord has only incompletely documented. To our knowledge, there exists only one study that employed quantitative receptor autoradiography to determine the distribution of D3 receptors in the rat spinal cord and to compare it with D1-like and D2 and D4 receptors (Levant and McCarson, 2001). There, the distribution patterns between all three receptor types appeared similar, with a general presence of the receptors in the spinal gray, and some more intense labeling in the dorsal horn. However, unlike our real-time PCR data, the D3 receptor subtype was significantly more highly expressed than the D2 (including D4), and both were significantly lower than the D1-like receptors. An obvious explanation for differences when assaying for protein vs. RNA is that D3 receptors are known to be present on descending dopaminergic terminals (Diaz et al., 1995) and may also be present on primary afferent terminals: Both neuron types are not found in, but project to, the spinal cord and so would not contribute to observed in situ expression or values obtained with real-time PCR.
The role of dopamine in the spinal cord
The spinal cord is the sensory-motor interface of the body with its environment. Since the different dopamine receptor subtypes respond with different affinities to dopaminergics (e.g. (Sokoloff et al., 1990, Sokoloff et al., 1992, Pugsley et al., 1995, Sautel et al., 1995, Millan et al., 2002, Clemens and Hochman, 2004, Clemens et al., 2006), cf. also http://www.pdsp.med.unc.edu/pdsp.php), it is possible that the responsiveness of the spinal neuromodulatory systems to dopamine might be tuned according to the animal’s current behavioral state by both release levels and distribution patterns of the receptor subtypes. For instance, if strong spatial differences between dopamine receptors were to be observed, this could point to different modulatory actions by dopamine that are specific to different regions of the cord. Alternatively, such a precise modulatory effect might also be achieved by differentially activating the receptors in the same area, but as a function of the dopamine level present, and hence dependent on the affinity to dopamine of any given receptor subtype. Since there are differences in binding affinity of dopamine to the different receptor subtypes (Billard et al., 1984, Imafuku, 1987, Sokoloff et al., 1992, Freedman et al., 1994, Sautel et al., 1995), differences in magnitude of dopamine release could provide a mechanism for altering dopaminergic modulatory properties in the cord.
Overall, we demonstrate that the combined use of both real-time PCR and ISH provides important complementary information on receptor expression (Haupt et al., 2006). We present evidence that the lumbar region of the juvenile C57BL/6 mouse spinal cord expresses all five known dopamine receptors, and that the expression levels are significantly higher for the D2 receptor type than for any of the other subtypes. Despite this difference, the distribution pattern of the dopamine receptors is highly similar, with a diffuse pattern in the spinal gray. Additionally, all five receptor subtypes are expressed in motoneurons of the ventral horn. The widespread receptor distribution points to a broad dopaminergic modulatory control of spinal cord function.
Acknowledgments
Support: National Institute of Neurological Disorders and Stroke Grant NS045248
We thank Dr. Dapeng Cui and the labs of Drs. Gary Miller (Minzhen Wang) and Doug Eaton (Otor Al-Khalili) for assistance with real-time PCR. This project was supported by National Institute of Neurological Disorders and Stroke Grant NS045248.
Abbreviations
- DA
dopamine
- DIG
digoxigenin
- EDTA
ethylenediaminetetraacetic acid
- GENSAT
Gene Expression Nervous System Atlas, GFAP, glial fibrillary acidic protein
- ISH
in situ hybridization
- LCM
laser capture microdissection, PB, phosphate buffer
- PBS
phosphate-buffered saline
- PBST
PBS containing 0.3% triton x-100
- PCR
Polymerase chain reaction
- SDH
superficial dorsal horn
Footnotes
Publisher's Disclaimer: This is a PDF file of an unedited manuscript that has been accepted for publication. As a service to our customers we are providing this early version of the manuscript. The manuscript will undergo copyediting, typesetting, and review of the resulting proof before it is published in its final citable form. Please note that during the production process errors may be discovered which could affect the content, and all legal disclaimers that apply to the journal pertain.
References
- Abramets II, Samoilovich IM. Analysis of two types of dopaminergic responses of neurons of the spinal ganglia of rats. Neurosci Behav Physiol. 1991;21:435–440. doi: 10.1007/BF01200278. [DOI] [PubMed] [Google Scholar]
- Barasi S, Duggal KN. The effect of local and systemic application of dopaminergic agents on tail flick latency in the rat. Eur J Pharmacol. 1985;117:287–294. doi: 10.1016/0014-2999(85)90001-9. [DOI] [PubMed] [Google Scholar]
- Barriere G, Mellen N, Cazalets JR. Neuromodulation of the locomotor network by dopamine in the isolated spinal cord of newborn rat. Eur J Neurosci. 2004;19:1325–1335. doi: 10.1111/j.1460-9568.2004.03210.x. [DOI] [PubMed] [Google Scholar]
- Bergson C, Mrzljak L, Smiley JF, Pappy M, Levenson R, Goldman-Rakic PS. Regional, cellular, and subcellular variations in the distribution of D1 and D5 dopamine receptors in primate brain. J Neurosci. 1995;15:7821–7836. doi: 10.1523/JNEUROSCI.15-12-07821.1995. [DOI] [PMC free article] [PubMed] [Google Scholar]
- Billard W, Ruperto V, Crosby G, Iorio LC, Barnett A. Characterization of the binding of 3H-SCH 23390, a selective D-1 receptor antagonist ligand, in rat striatum. Life Sci. 1984;35:1885–1893. doi: 10.1016/0024-3205(84)90540-x. [DOI] [PubMed] [Google Scholar]
- Bouthenet ML, Martres MP, Sales N, Schwartz JC. A detailed mapping of dopamine D-2 receptors in rat central nervous system by autoradiography with [125I]iodosulpride. Neuroscience. 1987;20:117–155. doi: 10.1016/0306-4522(87)90008-x. [DOI] [PubMed] [Google Scholar]
- Brichta AM, Grant JW. Cytochemical organization of the spinal cord. In: Paxinos G, editor. The rat nervous system Volume 2, Hindbrain and spinal cord. Sydney: Academic Press; 1985. pp. 293–301. [Google Scholar]
- Buck CR, Seburn KL, Cope TC. Neurotrophin expression by spinal motoneurons in adult and developing rats. J Comp Neurol. 2000;416:309–318. doi: 10.1002/(sici)1096-9861(20000117)416:3<309::aid-cne3>3.0.co;2-u. [DOI] [PubMed] [Google Scholar]
- Carp JS, Anderson RJ. Dopamine receptor-mediated depression of spinal monosynaptic transmission. Brain Res. 1982;242:247–254. doi: 10.1016/0006-8993(82)90307-9. [DOI] [PubMed] [Google Scholar]
- Clark FM, Yeomans DC, Proudfit HK. The noradrenergic innervation of the spinal cord: differences between two substrains of Sprague-Dawley rats determined using retrograde tracers combined with immunocytochemistry. Neurosci Lett. 1991;125:155–158. doi: 10.1016/0304-3940(91)90015-l. [DOI] [PubMed] [Google Scholar]
- Clemens S, Hochman S. Conversion of the modulatory actions of dopamine on spinal reflexes from depression to facilitation in D3 receptor knock-out mice. J Neurosci. 2004;24:11337–11345. doi: 10.1523/JNEUROSCI.3698-04.2004. [DOI] [PMC free article] [PubMed] [Google Scholar]
- Clemens S, Rye D, Hochman S. Restless legs syndrome: revisiting the dopamine hypothesis from the spinal cord perspective. Neurology. 2006;67:125–130. doi: 10.1212/01.wnl.0000223316.53428.c9. [DOI] [PubMed] [Google Scholar]
- Cui D, Dougherty KJ, Machacek DW, Sawchuk M, Hochman S, Baro DJ. Divergence between motoneurons: Gene expression profiling provides a molecular characterization of functionally discrete somatic and autonomic motoneurons. Physiol Genomics. 2006;24:276–289. doi: 10.1152/physiolgenomics.00109.2005. [DOI] [PMC free article] [PubMed] [Google Scholar]
- Diaz J, Levesque D, Lammers CH, Griffon N, Martres MP, Schwartz JC, Sokoloff P. Phenotypical characterization of neurons expressing the dopamine D3 receptor in the rat brain. Neuroscience. 1995;65:731–745. doi: 10.1016/0306-4522(94)00527-c. [DOI] [PubMed] [Google Scholar]
- Dubois A, Savasta M, Curet O, Scatton B. Autoradiographic distribution of the D1 agonist [3H]SKF 38393, in the rat brain and spinal cord. Comparison with the distribution of D2 dopamine receptors. Neuroscience. 1986;19:125–137. doi: 10.1016/0306-4522(86)90010-2. [DOI] [PubMed] [Google Scholar]
- Fitzgerald M. The development of nociceptive circuits. Nat Rev Neurosci. 2005;6:507–520. doi: 10.1038/nrn1701. [DOI] [PubMed] [Google Scholar]
- Fleetwood-Walker SM, Hope PJ, Mitchell R. Antinociceptive actions of descending dopaminergic tracts on cat and rat dorsal horn somatosensory neurones. J Physiol. 1988;399:335–348. doi: 10.1113/jphysiol.1988.sp017084. [DOI] [PMC free article] [PubMed] [Google Scholar]
- Freedman SB, Patel S, Marwood R, Emms F, Seabrook GR, Knowles MR, McAllister G. Expression and pharmacological characterization of the human D3 dopamine receptor. J Pharmacol Exp Ther. 1994;268:417–426. [PubMed] [Google Scholar]
- Gajendiran M, Seth P, Ganguly DK. Involvement of the presynaptic dopamine D2 receptor in the depression of spinal reflex by apomorphine. Neuroreport. 1996;7:513–516. doi: 10.1097/00001756-199601310-00033. [DOI] [PubMed] [Google Scholar]
- Gallagher JP, Inokuchi H, Shinnick-Gallagher P. Dopamine depolarisation of mammalian primary afferent neurones. Nature. 1980;283:770–772. doi: 10.1038/283770a0. [DOI] [PubMed] [Google Scholar]
- Garraway SM, Hochman S. Modulatory actions of serotonin, norepinephrine, dopamine, and acetylcholine in spinal cord deep dorsal horn neurons. J Neurophysiol. 2001;86:2183–2194. doi: 10.1152/jn.2001.86.5.2183. [DOI] [PubMed] [Google Scholar]
- Gladwell SJ, Pyner S, Barnes NM, Coote JH. D(1)-like dopamine receptors on retrogradely labelled sympathoadrenal neurones in the thoracic spinal cord of the rat. Exp Brain Res. 1999;128:377–382. doi: 10.1007/s002210050857. [DOI] [PubMed] [Google Scholar]
- Gurevich EV, Joyce JN. Distribution of dopamine D3 receptor expressing neurons in the human forebrain: comparison with D2 receptor expressing neurons. Neuropsychopharmacology. 1999;20:60–80. doi: 10.1016/S0893-133X(98)00066-9. [DOI] [PubMed] [Google Scholar]
- Hasegawa Y, Kurachi M, Otomo S. Dopamine D2 receptors and spinal cord excitation in mice. Eur J Pharmacol. 1990;184:207–212. doi: 10.1016/0014-2999(90)90611-9. [DOI] [PubMed] [Google Scholar]
- Haupt C, Tolner EA, Heinemann U, Witte OW, Frahm C. The combined use of non-radioactive in situ hybridization and real-time RT-PCR to assess gene expression in cryosections. Brain Res. 2006;1118:232–238. doi: 10.1016/j.brainres.2006.08.037. [DOI] [PubMed] [Google Scholar]
- Henderson Z. In Situ Hybridization Techniques for the Brain. Hoboken, NJ: Wiley; 1996. [Google Scholar]
- Hervé D, Girault JA. Signal transduction of dopamine receptors. In: Dunnett SB, et al., editors. Handbook of Chemical Neuroanatomy: Dopamine. Vol. 21. Elsevier; 2005. pp. 109–151. [Google Scholar]
- Holstege JC, Dijken Hv, Buijs RM, Goedkengt H, Gosens T, Bongers CM. Distribution of dopamine immunoreactivity in the rat, cat, and monkey spinal cord. J Comp Neurol. 1996;376:631–652. doi: 10.1002/(SICI)1096-9861(19961223)376:4<631::AID-CNE10>3.0.CO;2-P. [DOI] [PubMed] [Google Scholar]
- Hurd YL, Suzuki M, Sedvall GC. D1 and D2 dopamine receptor mRNA expression in whole hemisphere sections of the human brain. J Chem Neuroanat. 2001;22:127–137. doi: 10.1016/s0891-0618(01)00122-3. [DOI] [PubMed] [Google Scholar]
- Imafuku J. The characterization of [3H]sulpiride binding sites in rat striatal membranes. Brain Res. 1987;402:331–338. doi: 10.1016/0006-8993(87)90040-0. [DOI] [PubMed] [Google Scholar]
- Jaber M, Robinson SW, Missale C, Caron MG. Dopamine receptors and brain function. Neuropharmacology. 1996;35:1503–1519. doi: 10.1016/s0028-3908(96)00100-1. [DOI] [PubMed] [Google Scholar]
- Jackson DM, Westlind-Danielsson A. Dopamine receptors: Molecular biology, biochemistry and behavioural aspects. Pharmac Ther. 1994;64:291–369. doi: 10.1016/0163-7258(94)90041-8. [DOI] [PubMed] [Google Scholar]
- Jiang Z, Carlin KP, Brownstone RM. An in vitro functionally mature mouse spinal cord preparation for the study of spinal motor networks. Brain Res. 1999;816:493–499. doi: 10.1016/s0006-8993(98)01199-8. [DOI] [PubMed] [Google Scholar]
- Joyce JN. Multiple Dopamine receptors and behavior. Neurosci Biobehav Rev. 1983;7:227–259. doi: 10.1016/0149-7634(83)90017-9. [DOI] [PubMed] [Google Scholar]
- Kemnitz CP. Dopaminergic modulation of spinal neurons and synaptic potentials in the lamprey spinal cord. J Neurophysiol. 1997;77:289–298. doi: 10.1152/jn.1997.77.1.289. [DOI] [PubMed] [Google Scholar]
- Kimura K, Sela S, Bouvier C, Grandy DK, Sidhu A. Differential coupling of D1 and D5 dopamine receptors to guanine nucleotide binding proteins in transfected GH4C1 rat somatomammotrophic cells. J Neurochem. 1995;64:2118–2124. doi: 10.1046/j.1471-4159.1995.64052118.x. [DOI] [PubMed] [Google Scholar]
- Kumar U, Patel SC. Immunohistochemical localization of dopamine receptor subtypes (D1R-D5R) in Alzheimer’s disease brain. Brain Res. 2007;1131:187–196. doi: 10.1016/j.brainres.2006.10.049. [DOI] [PubMed] [Google Scholar]
- Law AK, Pencea V, Buck CR, Luskin MB. Neurogenesis and neuronal migration in the neonatal rat forebrain anterior subventricular zone do not require GFAP-positive astrocytes. Dev Biol. 1999;216:622–634. doi: 10.1006/dbio.1999.9498. [DOI] [PubMed] [Google Scholar]
- Levant B. The D3 dopamine receptor: neurobiology and potential clinical relevance. Pharmacol Rev. 1997;49:231–252. [PubMed] [Google Scholar]
- Levant B, McCarson KE. D(3) dopamine receptors in rat spinal cord: implications for sensory and motor function. Neurosci Lett. 2001;303:9–12. doi: 10.1016/s0304-3940(01)01692-5. [DOI] [PubMed] [Google Scholar]
- Livak KJ, Schmittgen TD. Analysis of relative gene expression data using real-time quantitative PCR and the 2(-Delta Delta C(T)) Method. Methods. 2001;25:402–408. doi: 10.1006/meth.2001.1262. [DOI] [PubMed] [Google Scholar]
- Meador-Woodruff JH, Mansour A. A. E. Bennett Award paper. Expression of the dopamine D2 receptor gene in brain. Biol Psychiatry. 1991;30:985–1007. doi: 10.1016/0006-3223(91)90120-b. [DOI] [PubMed] [Google Scholar]
- Millan MJ, Maiofiss L, Cussac D, Audinot V, Boutin JA, Newman-Tancredi A. Differential actions of antiparkinson agents at multiple classes of monoaminergic receptor. I. A multivariate analysis of the binding profiles of 14 drugs at 21 native and cloned human receptor subtypes. J Pharmacol Exp Ther. 2002;303:791–804. doi: 10.1124/jpet.102.039867. [DOI] [PubMed] [Google Scholar]
- Missale C, Nash SR, Robinson SW, Jaber M, Caron MG. Dopamine receptors: from structure to function. Physiol Rev. 1998;78:189–225. doi: 10.1152/physrev.1998.78.1.189. [DOI] [PubMed] [Google Scholar]
- Molokanova EA, Tamarova ZA. The effects of dopamine and serotonin on rat dorsal root ganglion neurons: an intracellular study. Neuroscience. 1995;65:859–867. doi: 10.1016/0306-4522(94)00488-q. [DOI] [PubMed] [Google Scholar]
- Pugsley TA, Davis MD, Akunne HC, MacKenzie RG, Shih YH, Damsma G, Wikstrom H, Whetzel SZ, Georgic LM, Cooke LW, et al. Neurochemical and functional characterization of the preferentially selective dopamine D3 agonist PD 128907. J Pharmacol Exp Ther. 1995;275:1355–1366. [PubMed] [Google Scholar]
- Sautel F, Griffon N, Levesque D, Pilon C, Schwartz JC, Sokoloff P. A functional test identifies dopamine agonists selective for D3 versus D2 receptors. Neuroreport. 1995;6:329–332. doi: 10.1097/00001756-199501000-00026. [DOI] [PubMed] [Google Scholar]
- Schambra UB, Duncan GE, Breese GR, Fornaretto MG, Caron MG, Fremeau RT., Jr Ontogeny of D1A and D2 dopamine receptor subtypes in rat brain using in situ hybridization and receptor binding. Neuroscience. 1994;62:65–85. doi: 10.1016/0306-4522(94)90315-8. [DOI] [PubMed] [Google Scholar]
- Shay BL, Sawchuk M, Machacek DW, Hochman S. Serotonin 5-HT2 receptors induce a long-lasting facilitation of spinal reflexes independent of ionotropic receptor activity. J Neurophysiol. 2005;94:2867–2877. doi: 10.1152/jn.00465.2005. [DOI] [PMC free article] [PubMed] [Google Scholar]
- Skagerberg G, Bjorklund A. Topographic principles in the spinal projections of serotonergic and non-serotonergic brainstem neurons in the rat. Neuroscience. 1985;15:445–480. doi: 10.1016/0306-4522(85)90225-8. [DOI] [PubMed] [Google Scholar]
- Skagerberg G, Bjorklund A, Lindvall O, Schmidt RH. Origin and termination of the diencephalo-spinal dopamine system in the rat. Brain Res Bull. 1982;9:237–244. doi: 10.1016/0361-9230(82)90136-8. [DOI] [PubMed] [Google Scholar]
- Skagerberg G, Meister B, Hokfelt T, Lindvall O, Goldstein M, Joh T, Cuello AC. Studies on dopamine-, tyrosine hydroxylase- and aromatic L-amino acid decarboxylase-containing cells in the rat diencephalon: comparison between formaldehyde-induced histofluorescence and immunofluorescence. Neuroscience. 1988;24:605–620. doi: 10.1016/0306-4522(88)90354-5. [DOI] [PubMed] [Google Scholar]
- Skoog B, Noga BR. Dopaminergic control of transmission from group II muscle afferents to spinal neurones in the cat and guinea-pig. Exp Brain Res. 1995;105:39–47. doi: 10.1007/BF00242180. [DOI] [PubMed] [Google Scholar]
- Sokoloff P, Andrieux M, Besancon R, Pilon C, Martres MP, Giros B, Schwartz JC. Pharmacology of human dopamine D3 receptor expressed in a mammalian cell line: comparison with D2 receptor. Eur J Pharmacol. 1992;225:331–337. doi: 10.1016/0922-4106(92)90107-7. [DOI] [PubMed] [Google Scholar]
- Sokoloff P, Giros B, Martres MP, Bouthenet ML, Schwartz JC. Molecular cloning and characterization of a novel dopamine receptor (D3) as a target for neuroleptics. Nature. 1990;347:146–151. doi: 10.1038/347146a0. [DOI] [PubMed] [Google Scholar]
- Tamae A, Nakatsuka T, Koga K, Kato G, Furue H, Katafuchi T, Yoshimura M. Direct inhibition of substantia gelatinosa neurones in the spinal cord by activation of dopamine D2-like receptors. J Physiol. 2005 doi: 10.1113/jphysiol.2005.091843. [DOI] [PMC free article] [PubMed] [Google Scholar]
- van Dijken H, Dijk J, Voom P, Holstege JC. Localization of dopamine D2 receptor in rat spinal cord identified with immunocytochemistry and in situ hybridization. Eur J Neurosci. 1996;8:621–628. doi: 10.1111/j.1460-9568.1996.tb01247.x. [DOI] [PubMed] [Google Scholar]
- Wang Q, Jolly JP, Surmeier JD, Mullah BM, Lidow MS, Bergson CM, Robishaw JD. Differential dependence of the D1 and D5 dopamine receptors on the G protein gamma 7 subunit for activation of adenylylcyclase. J Biol Chem. 2001;276:39386–39393. doi: 10.1074/jbc.M104981200. [DOI] [PubMed] [Google Scholar]
- Weiner DM, Levey AI, Sunahara RK, Niznik HB, O’Dowd BF, Seeman P, Brann MR. D1 and D2 dopamine receptor mRNA in rat brain. Proc Natl Acad Sci U S A. 1991;88:1859–1863. doi: 10.1073/pnas.88.5.1859. [DOI] [PMC free article] [PubMed] [Google Scholar]
- Xie GX, Jones K, Peroutka SJ, Palmer PP. Detection of mRNAs and alternatively spliced transcripts of dopamine receptors in rat peripheral sensory and sympathetic ganglia. Brain Res. 1998;785:129–135. doi: 10.1016/s0006-8993(97)01394-2. [DOI] [PubMed] [Google Scholar]
- Yang HW, Zhou LJ, Hu NW, Xin WJ, Liu XG. Activation of spinal d1/d5 receptors induces late-phase LTP of C-fiber-evoked field potentials in rat spinal dorsal horn. J Neurophysiol. 2005;94:961–967. doi: 10.1152/jn.01324.2004. [DOI] [PubMed] [Google Scholar]
- Yokoyama C, Okamura H, Nakajima T, Taguchi J, Ibata Y. Autoradiographic distribution of [3H]YM-09151-2, a high-affinity and selective antagonist ligand for the dopamine D2 receptor group, in the rat brain and spinal cord. J Comp Neurol. 1994;344:121–136. doi: 10.1002/cne.903440109. [DOI] [PubMed] [Google Scholar]
- Yung KK, Bolam JP, Smith AD, Hersch SM, Ciliax BJ, Levey AI. Immunocytochemical localization of D1 and D2 dopamine receptors in the basal ganglia of the rat: light and electron microscopy. Neuroscience. 1995;65:709–730. doi: 10.1016/0306-4522(94)00536-e. [DOI] [PubMed] [Google Scholar]
- Zhao H, Zhu W, Pan T, Xie W, Zhang A, Ondo WG, Le W. Spinal cord dopamine receptor expression and function in mice with 6-OHDA lesion of the A11 nucleus and dietary iron deprivation. J Neurosci Res. 2007;85:1065–1076. doi: 10.1002/jnr.21207. [DOI] [PubMed] [Google Scholar]
- Zhu H, Sawchuk MA, Clemens S, Hochman S. Distribution of D1-D5 dopamine receptor mRNA in mouse spinal cord. Soc Neurosci Abstr 2004;656.15 [Google Scholar]