Abstract
The brains of Alzheimer’s disease patients contain extracellular Aβ amyloid deposits (senile plaques). Although genetic evidence causally links Aβ deposition to the disease, the mechanism by which Aβ disrupts cortical function is unknown. Using triple immunofluorescent confocal microscopy and three-dimensional reconstructions, we found that neuronal processes that cross through an Aβ deposit are likely to have a radically changed morphology. We modeled the electrophysiological effect of this changed morphology and found a predicted delay of several milliseconds over an average plaque. We propose that this type of delay, played out among thousands of plaques throughout neocortical areas, disrupts the precise temporal firing patterns of action potentials, contributing directly to neural system failure and dementia.
Alzheimer’s disease (AD) causes a clinical syndrome marked by severe, progressive dementia. Neuropathological changes include Aβ deposits that are often associated with dystrophic neurites (neuritic plaques), dystrophic neurites in the neuropil (neuropil threads), and neurofibrillary tangles. Inheritance of mutations in the amyloid protein precursor lead to changes in the generation of Aβ, extracellular deposition of Aβ in the brain, and an autosomal dominant early onset form of AD (1–3), suggesting that Aβ is a critical early component of the pathophysiological cascade. However, whether Aβ deposition causes neural system failure is controversial. Brains of nondemented elderly individuals frequently contain numerous Aβ deposits (4). Even in AD, where Aβ deposits can occupy as much as 15% of the cortical surface area, the amount of Aβ deposits correlates poorly with clinical severity or duration of disease (5–7).
It has been shown that Aβ deposits do not correlate with local neuronal loss (7, 8). We now examine their effect on neuronal processes. We observe that neurites that pass through Aβ deposits in AD lose their normal characteristic straight shape. This change in geometry has marked consequences in terms of signal transduction properties of dendrites as judged by cable-theory simulations; delays in the millisecond range would be expected as a dendrite passes through a plaque. Insofar as any individual process passes through a variable number of plaques en route from synapse to cell body, we postulate that plaques distributed in widespread neocortical areas lead to a disruption of synchronous activation of neural systems and a stochastic breakdown in the integration of limbic and association cortices needed to form coherent evocation of memory-related events (9).
MATERIALS AND METHODS
Patient Selection.
All cases were monitored at the Massachusetts General Hospital Alzheimer’s Disease Research Center. Seven patients had clear clinical histories of AD dementia with well documented duration of disease and had a confirmed neuropathological diagnosis of AD without evidence of vascular insults (10), cortical Lewy bodies, or other dementia-related lesions. General neuropathological examination included Consortium to Establish a Registry for Alzheimer’s Disease (CERAD) assessments (10) using the Bielschowsky silver stain on multiple cortical sections embedded in paraffin. The mean age of death for the AD patients was 82.0 ± 12.8 years, and the mean duration of disease was 7.9 ± 5.0 years. The five control patients had no history of neurological disease, and postmortem examination using Bielschowsky stained sections did not reveal neuropathologic markers sufficient to make the diagnosis of AD. Their mean age was 79.2 ± 13.2 years.
Tissue Processing.
Brains were fixed in meta periodate-lysine-paraformaldehyde within 24 h of death. Two to seven days later, blocks of temporal lobe were placed in a cryoprotection solution containing 10% glycerol. Fifty-micrometer-thick sections were obtained from blocks by using a freezing sledge microtome.
Immunohistochemistry.
Free-floating sections were permeablized in 0.5% Triton X-100 in 3% hydrogen peroxide for 20 min, were washed in 0.05M Tris-buffered saline, and were blocked in 3% milk in Tris-buffered saline for 1 h. Sections were labeled with antibodies against Aβ (R1282, courtesy of Dennis Selkoe, Brigham and Women’s Hospital, Boston), Alz50 (courtesy of Peter Davies, Albert Einstein University, New York), and SMI32 (Sternberger Monoclonals, Baltimore) overnight at 4°C and then were washed in Tris-buffered saline and were detected with the following secondary antibodies for 1 h at room temperature: bodipy-conjugated goat anti-rabbit (for R1282), Cy3-conjugated goat anti-mouse IgM (for Alz 50), and Cy5-conjugated goat anti-mouse IgG (for SMI32). Negative controls included using each combination of two primary antibodies along with all three secondary antibodies, as well as sections incubated with 1.5% goat serum. Sections were placed on gelatin-coated slides, were dehydrated in serial ethanol washes, and were mounted on glass coverslips with Xylenes and Permount.
Microscopy.
The region of analysis was located in the inferior bank of the superior temporal sulcus area, ≈1 cm medial to the crown of the gyrus. A 1-mm-wide section of layer 3 of this high-order association cortex was imaged with a Bio-Rad 1024 confocal microscope using a 20× objective and an X–Y stage encoder. Three-dimensional reconstruction of a field was taken from seven images, each 0.2 μm thick (100 × 1.4 numerical aperture oil immersion objective). The three-dimensional image then was projected in two dimensions.
Morphological Characterization of Dendrites.
We characterized the geometry of the dendrites by using three parameters: curvature, curvilinear length, and width. The central line and diameter of the dendrites were designated manually by using topographic marks along the dendrite. The following running window technique was used to correct for equidistance errors to create positional data for each dendrite. Each dendrite was digitalized as an array of n + 1 points (xi, yi), i = 0, 1,… , n, connected by n segments of straight lines, l1, l2, … . , ln.
Neural Network Simulations.
We used the genesis computer model (12) to determine whether an increase in the length of a dendrite would affect the spike timing from a synaptic input. For these computations, we used Rm= 100 Kohmcm2, Ra= 300 Kohmcm, and Cm = 1 μF/cm2 (Ra, axial resistance; Rm, membrane resistance; Cm, membrane capacitance) as suggested by Yuste and Tank (11). Input strength was set at 5 × 10⁻¹ mS, and the time to reach a threshold at the cell body of 10 mV was measured.
RESULTS
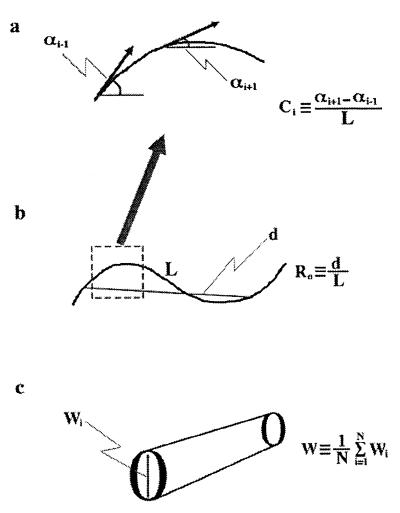
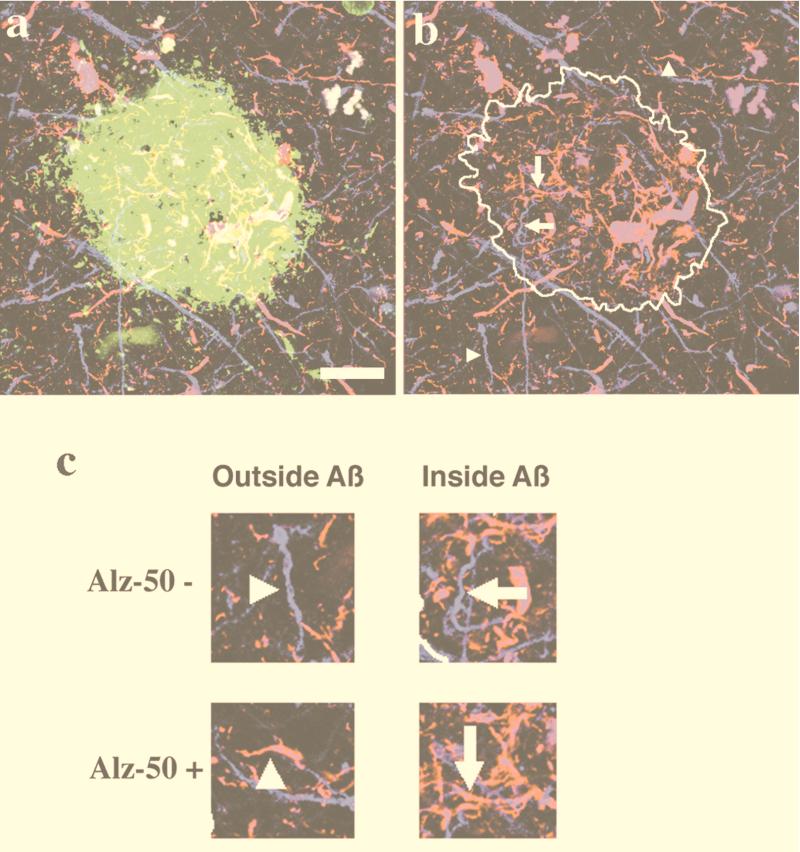
We first developed a method to quantify dendritic geometry by reconstructing three-dimensional confocal images and calculating the mean curvature, length, and width distributions of projection neuron dendrites (Fig. 1). We examined the superior temporal sulcus high order association cortex by using Alz-50, a sensitive immunoreagent for neurofibrillary tangles and neuropil threads (12), SMI-32, a neurofilament H antibody that specifically immunostains the somatodendritic compartment of large projection neurons in association cortex (13), and R1282, a polyclonal anti-Aβ antibody for amyloid deposits. Triple immunofluorescent confocal analysis allowed us to compare the morphology of dendrites that are Alz-50-immunoreactive versus those that are Alz-50-negative and also those dendrites that are inside of Aβ deposits versus those outside of Aβ deposits (Fig. 2).
Figure 1.
(a) Curvature of dendrites was defined as the inverse of the curvature radius (Ci). For each dendrite, a mean C value then was determined with the following equation: C = (1/N) Σ⋅Ci, where N is the number of equidistant points along the dendrite. (b) The ratio (Ro) of the end to end distance (d) to the curvilinear length (L) was calculated for each dendrite (Ro = d/L). (c) The width of each dendrite was determined from the average of the sum of all widths along the dendrite (W = (1/N) Σ⋅wi).
Figure 2.
Dendrites in AD were classified by the presence of Aβ deposits and Alz-50 immunoreactivity. (a) An example of a projection of a three-dimensional triple-labeled plaque (Aβ in green, Alz-50 in red, and SMI32 in blue). (b) The area containing the Aβ deposit is outlined to show examples of dendrites. (c) Neurite segments are classified as being outside or inside Aβ deposits and by whether they are Alz-50-immunoreactive. (Bar = 20 μm.)
Dendrites Are Normally Straight but Are Substantially Altered in AD.
We first examined the morphology of SMI32-positive dendrites randomly selected from layer III of the superior temporal sulcus in control, nondemented cases and found them to be uniformly straight, with a mean curvature approaching 0 (Table 1). We calculated the ratio of the end to end distance to the curvilinear length of the dendrite (Ro), which for a straight dendrite would be 1.0, and found that >72% of the dendrites have a high Ro, operationally defined here as dendrites with an Ro of 0.95 or greater. In AD cases, by contrast, there is a marked (almost 3-fold, P < 0.001) increase in curvature, and <30% of the dendrites have a high Ro (P < 0.001) (Table 1). Surprisingly, the mean widths of dendrites was unaltered in AD compared with controls, suggesting that the bulbous dysmorphic neurites that are evident on silver stains represent only a minority of SMI32-positive neurites associated with plaques.
Table 1.
Quantitative measures of dendrite morphology in AD
| Curvature, μm−1 | Ro | Width, μm | |
|---|---|---|---|
| Control | 0.11 ± 0.11 (973)* | 0.95 ± 0.08 (605) | 0.72 ± 0.54 (535) |
| Alzheimer’s Disease | 0.29 ± 0.25 (4112)† | 0.83 ± 0.19 (5803)† | 0.74 ± 0.42 (4025) |
Mean ± SD (n).
P < 0.001.
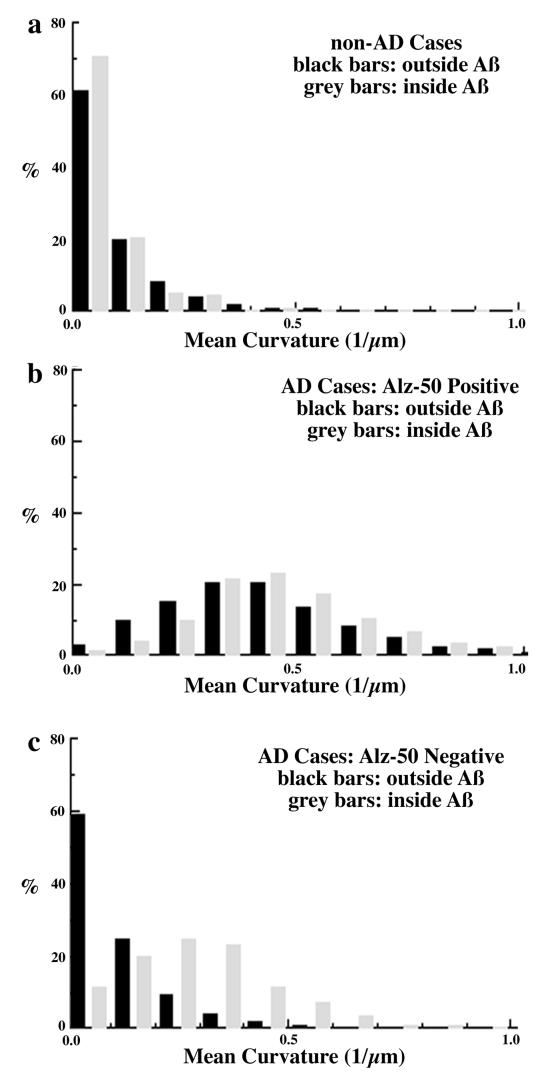
Using triple-labeled sections, we then examined SMI32-positive dendrite morphology in four categories: those that were Alz-50 positive or negative and/or within or outside an Aβ deposit. In control cases, there were too few Alz-50-positive neurites to quantitatively analyze, but there were scattered “incidental” Aβ deposits. Again, in control cases, the dendrites were straight regardless of proximity to Aβ: There was no difference in the mean curvature or Ro (Fig. 3a).
Figure 3.
Distribution of dendrite curvature inside versus outside of Aβ deposits. (a) Dendrites in non-AD control cases are straight and have no significant changes in their curvature when they traverse Aβ deposits. (b) Alz-50 immunoreactive dendrites have a nearly 4-fold increase in curvature compared with dendrites from controls. There is no additional change in their curvature as they pass through Aβ deposits. (c) Alz-50-negative dendrites also have altered morphology in AD cases, but only when they traverse Aβ deposits. Dendrites have a 3-fold increase in curvature inside Aβ deposits as compared with dendrites from control cases. By contrast, there is no increase in curvature of Alz-50-negative dendrites outside of Aβ deposits as compared with dendrites from control cases.
Alz-50-Immunoreactive Neurites Are Severely Disrupted in AD.
Alz-50 positive neurites have been described as dystrophic, and, indeed, quantitative morphological analysis revealed striking changes (Table 2). Fewer than 5% of Alz-50-positive dendrites are straight, and the mean curvature is increased significantly compared with controls (P < 0.001). There was a corresponding effect on Ro in Alz-50 -positive dendrites, with only 2.4% of the Alz-50-positive dendrites having a high Ro (P < 0.001). The decrease in Ro for Alz-50 suggests that an Alz-50-immunoreactive dendrite has to be 31% longer to traverse the same distance as a normal dendrite. Alz-50-positive neurites were equally severely disrupted regardless of whether they were inside an Aβ deposit (Fig. 3b).
Table 2.
Quantitative measures of dendrite morphology inside versus outside Aβ deposits
| Curvature | Ro | Width | ||
|---|---|---|---|---|
| Control | Outside Aβ | 0.09 ± 0.09 (473)* | 0.95 ± 0.19 (495) | 0.73 ± 0.56 (441) |
| Control | Inside Aβ | 0.08 ± 0.07 (187) | 0.94 ± 0.11 (110) | 0.67 ± 0.42 (87) |
| Alz-50+ | Outside Aβ | 0.43 ± 0.21 (1681) | 0.74 ± 0.19 (1681) | 0.72 ± 0.31 (1432) |
| Alz-50+ | Inside Aβ | 0.49 ± 0.20 (944) | 0.66 ± 0.21 (945) | 0.79 ± 0.36 (791) |
| Alz-50− | Outside Aβ | 0.12 ± 0.12 (2497) | 0.96 ± 0.05 (2497) | 0.75 ± 0.47 (1703) |
| Alz-50− | Inside Aβ | 0.3 ± 0.17 (681)† | 0.82 ± 0.15 (680)† | 0.71 ± 0.44 (631) |
Mean ± SD (n).
P < 0.001.
Neurites that Are Not Alz-50-Immunoreactive Are Disrupted Only if Within a Plaque in AD.
Alz-50-negative dendrites are also dramatically and significantly altered compared with controls, but only within Aβ deposits (Fig. 3c). Alz-50-negative dendrites that were inside Aβ deposits had a mean curvatures of 0.3 μm−1, and only 10% of the dendrites were straight (P < 0.001, Table 2). By contrast, Alz-50-negative dendrites outside of Aβ deposits were indistinguishable from normal dendrites, and nearly 60% of the dendrites were straight (Fig. 3c).
We also calculated the corresponding Ro of Alz-50 negative dendrites that were outside Aβ deposits and compared with those inside Aβ deposits. Over 73% of dendrites that were outside Aβ deposits were straight whereas only 19% of the dendrites inside Aβ deposits were straight (P < 0.001, Table 2). The difference in the mean Ro values indicates that, on average, an Alz-50-negative dendrite has to be 17% longer to traverse the same distance if it is inside an Aβ deposit compared with a normal dendrite. These results suggest that morphological changes are occurring to dendrites inside of Aβ deposits even with no accumulation of Alz-50 immunoreactivity. Comparing these results to those from the nondemented control cases, the presence or absence of cognitive impairment correlates with the presence or absence of changes in neurite morphology, suggesting that neurite response to Aβ is a critical determinant of the clinical consequences of Aβ deposition.
Modeling of Functional Effect of Neurite Alterations in AD Shows Profound Disruption of Spike Timing Properties.
We next examined whether the AD-associated morphological changes in dendrites we quantified would alter neuronal function. We used the genesis computer model (14) to determine whether an increase in the length of a dendrite would affect the spike timing from a synaptic input. We used the compartmental modeling approach (15) to the classic cable theory (16) by using simulations based on the data of Yuste and Tank (11) in which signals are propagated down a dendrite by (Vj + 1 − 2Vj + Vj − 1)/Ra = Cm dVj/dt + Vj/Rm + Ij (Ra, axial resistance; Rm, membrane resistance; Cm, membrane capacitance; Ij, flow of ions from the jth compartment through active channels; Vj, voltage in the jth compartment; Vj + 1, Vj − 1, voltage in adjacent compartments).
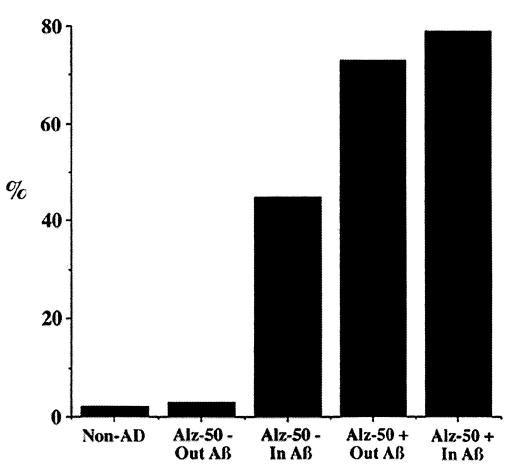
We examined how the timing of a single synaptic input is affected by the distance from the cell body for a particular set of membrane parameters and a particular choice of firing potential. An average plaque is ≈100 μm in diameter. At a distance of 100 μm from the synaptic input to the cell body, the membrane potential crossed a threshold of 10 mV at 13.6 msec. Increasing the distance to 120 μm, a conservative estimate of what is observed in dendrites coursing through an Aβ deposit, the membrane potential crossed a threshold of 10 mV at 17.8 msec. The difference of 4.2 msec calculated in this example is representative of a variety of simulations, although the exact amount varies with the choice of firing threshold and other parameters. The results suggest that differences in spike timing of >30% would be seen in 79% of dendrites that are Alz-50-immunoreactive and in 45% of dendrites that are Alz-50-negative but traverse Aβ deposits. This is in stark contrast to dendrites from non-AD cases, in which <2% fall in this range. Of interest, <3% of dendrites in AD cases that are Alz-50-negative and do not traverse Aβ deposits have changes in their morphology that result in delays of spike timing of 30% (Fig. 4). Thus, from this perspective, Alz-50-negative dendrites outside of Aβ deposits are indistinguishable from dendrites in control nondemented individuals whereas Alz-50-negative dendrites within an Aβ deposit are severely compromised.
Figure 4.
Changes in dendritic morphology in AD could lead to delays in dendritic spike timing. Shown is the percentage of dendrites that would have an increase of at least 30% in dendritic spike timing >100 μm, the size of an average plaque. Dendrites from non-AD cases, 2%; Alz-50-negative dendrites that do not traverse Aβ deposits, 3%; Alz-50-negative dendrites that traverse Aβ deposits, 45%; Alz-50-immunoreactive dendrites that do not traverse Aβ deposits, 73%; and Alz-50-immunoreactive dendrites that traverse Aβ deposits, 79%.
DISCUSSION
We examined >5,000 dendrites in AD and nondemented, age-matched control brains, and our data show a remarkable difference in dendritic morphology. Dendrites in AD that are Alz-50-immunoreactive are extremely dysmorphic, with increased curvature and curvilinear length. Even dendrites that were not Alz-50-immunoreactive, if they traverse an Aβ deposit, have a significantly altered geometry. Of importance, this is not a nonspecific feature of dendrites in a degenerating brain. The physical parameters we measured were normal in dendrites immediately outside of Aβ deposits even though, in many instances, the same process could be seen to traverse the Aβ deposit.
What are the probable consequences of increased curvature and length of dendrites on neuronal function? Changes in the stability of the cytoskeleton would be expected to have an impact on a variety of intracellular processes, such as intracellular transport, metabolism, mRNA trafficking, protein sorting and targeting, and lipoprotein function. These, in turn, would have consequences for the maintenance of dendritic structures and synaptic plasticity.
Even if the cytoskeleton in these dystrophic dendrites has not deteriorated to the point of affecting their cellular functions, and the dendrites still had operational and appropriate synapses, our current work highlights the enormous detrimental effect these morphological changes might have on neural system function. In this model, a cell that is receiving a synaptic input from a dendrite that traverses an Aβ deposit would reach threshold for an action potential several milliseconds after reaching threshold from a synaptic input from a dendrite that did not traverse an Aβ deposit. Because any individual neuron may be affected by a random number of Aβ deposits between synapse and cell body, the delay would vary among populations of neurons receiving an afferent volley. Timing in Alz-50-positive dendrites would be disrupted even more severely. We postulate that the resultant breakdown in synchronicity of timing would disrupt the functional integration of memory retrieval and other high order cognitive functions. Although it is controversial whether and to what extent precise temporal firing patterns are implicated in cortical networks (11), repeated delays in the firing of action potentials as more and more dendrites are affected could be a direct cause of the confusion, mental slowness, and progressive degeneration of cognitive abilities during the course of AD. A clinical correlate of this type of alteration has been demonstrated in Alzheimer patients for many years: Quantitative analysis of evoked potentials in AD patients shows a slowing and broadening of peaks related to cortical function, and topographic mapping methods of electroencephalographic activity show increased background slowing with a reduction in fast activity (synchronization) in AD patients compared with healthy controls (17).
Our finding that Alz-50-negative dendrites inside Aβ deposits had increased curvature and curvilinear length highlights the possibility of marked, functionally relevant changes in neurons that would not be apparent by conventional microscopy. Thus, the development of Alz-50 immunoreactivity or other phosphotau epitopes may signal the “tip of the iceberg” of morphologically disrupted processes, and phosphotau epitopes may thus represent a later step of cytoskeletal damage. We speculate that dendrites that pass through an Aβ deposit are initially unaffected (for example, in control brains) but gradually respond to the damage in extracellular matrix by adopting a curvier morphology, which is ultimately associated with dissociation of tau from microtubules, predisposing toward phosphorylation of tau and neurofibrillary formation. In accord with this idea is a recent observation that the percentage of Aβ deposits that are associated with dysmorphic neurites increases with increasing duration and severity of dementia, although the total amount of Aβ does not change (18).
These data suggest that neural system failure in AD is caused by functional alterations in dendritic signal transduction and signal summation properties in addition to the obvious structural lesions and neuronal loss. This formulation implies that AD dementia is caused, in part, by the effects of distributed alterations in neural system integrity that, on a systems level, involves functional deafferentation of feedforward and feedback projections and, on a molecular level, involves potentially reversible alterations in neurite structure and, thus, function. This raises the possibility that partial functional restoration of neural systems might occur if therapeutic strategies to reverse Aβ deposits prove successful.
Acknowledgments
This work was supported by National Institutes of Health Grant AG08487, the Massachusetts Alzheimer’s Disease Research Center brain bank (Grant P50 AG05134), a Neuroscience Training Grant (AG00222) (to R.K.), and a grant from the Adler Foundation (to B.U.).
ABBREVIATION
- AD
Alzheimer’s disease
References
- 1.Goate A M, Chartier-Harlin C M, Mullan M, Brown J, Crawford F, Fidani L, Giuffra L, Haynes A, Irving N, James L, et al. Nature (London) 1991;349:704–709. doi: 10.1038/349704a0. [DOI] [PubMed] [Google Scholar]
- 2.Murrell J, Farlow M, Ghetti B, Benson M D. Science. 1991;254:97–99. doi: 10.1126/science.1925564. [DOI] [PubMed] [Google Scholar]
- 3.Chartier-Harlin M-C, Crawford F, Houlden H, Warren A, Hughes D, Fidani L, Goate A, Rossor M, Roques P, Hardy J, et al. Nature (London) 1991;353:844–846. doi: 10.1038/353844a0. [DOI] [PubMed] [Google Scholar]
- 4.Delaere P, Duyckaerts C, Masters C, Beyreuther F, Piette F, Hauw J J. Neurosci Lett. 1990;116:87–93. doi: 10.1016/0304-3940(90)90391-l. [DOI] [PubMed] [Google Scholar]
- 5.Hyman B T, Tanzi R E. Curr Opin Neurol Neurosurg. 1992;5:88–89. [PubMed] [Google Scholar]
- 6.Nagy Z, Esiri M, Jobst K, Morris J H, King E M, McDonald B, Litchfield S, Smith A, Barnetson L, Smith A D. Dementia. 1995;6:21–31. doi: 10.1159/000106918. [DOI] [PubMed] [Google Scholar]
- 7.Gomez-Isla T, Hollister R, West H, Mui S, Growdon J H, Peterson R C, Parisi J E, Hyman B T. Ann Neurol. 1997;41:17–24. doi: 10.1002/ana.410410106. [DOI] [PubMed] [Google Scholar]
- 8.Irizarry M C, Soriano F, McNamara M, Page K J, Schenk D, Games D, Hyman B T. J Neurosci. 1997;17:7053–7059. doi: 10.1523/JNEUROSCI.17-18-07053.1997. [DOI] [PMC free article] [PubMed] [Google Scholar]
- 9.Damasio A R. Cognition. 1989;33:25–62. doi: 10.1016/0010-0277(89)90005-x. [DOI] [PubMed] [Google Scholar]
- 10.Mirra S S, Heyman A, McKeel D, Sumi S M, Crain B J, Brownlee L M, Vogel F S, Hughes J P, van Belle G, Berg L. Neurology. 1991;41:479–486. doi: 10.1212/wnl.41.4.479. [DOI] [PubMed] [Google Scholar]
- 11.Yuste R, Tank D W. Neuron. 1996;16:701–716. doi: 10.1016/s0896-6273(00)80091-4. [DOI] [PubMed] [Google Scholar]
- 12.Wolozin B L, Pruchnicki A, Dickson D W, Davies P. Science. 1986;232:648–650. doi: 10.1126/science.3083509. [DOI] [PubMed] [Google Scholar]
- 13.Campbell M J, Hof P R, Morrison J H. Brain Res. 1991;539:133–136. doi: 10.1016/0006-8993(91)90695-r. [DOI] [PubMed] [Google Scholar]
- 14.Bower J M, Beeman D, editors. The Book of Genesis: Exploring Realistic Neural Models with the General Neural Simulation System. New York: Springer; 1995. [Google Scholar]
- 15.Segev I. In: The Book of Genesis: Exploring Realistic Neural Models with the General Neural Simulation System. Bower J M, Beeman D, editors. New York: Springer; 1995. pp. 53–79. [Google Scholar]
- 16.Rall W. In: Neuronal Theory and Modeling. Reiss R F, editor. Stanford, CA: Stanford Univ. Press; 1964. pp. 73–97. [Google Scholar]
- 17.Duffy F H, Albert M S, McAnulty G. Ann Neurol. 1984;16:439–448. doi: 10.1002/ana.410160404. [DOI] [PubMed] [Google Scholar]
- 18.Knowles R B, Gomez-Isla T, Hyman B T. J Neuropath Exp Neurol. 1998;57:1122–1130. doi: 10.1097/00005072-199812000-00003. [DOI] [PubMed] [Google Scholar]


