

Abstract
The metabolism of vitamin E involves oxidation of the phytyl chain to generate the terminal metabolite 7,8-dimethyl-2-(β-carboxyethyl)-6-hydroxychroman (CEHC) via intermediate formation of 13′-hydroxychromanol and long-chain carboxychromanols. Conjugated (including sulfated) metabolites were reported previously but were limited to CEHCs. Here, using electrospray and inductively coupled plasma mass spectrometry, we discovered that γ-tocopherol (γ-T) and δ-T were metabolized to sulfated 9′-, 11′-, and 13′-carboxychromanol (9′S, 11′S, and 13′S) in human A549 cells. To further study the metabolites, we developed a HPLC assay with fluorescence detection that simultaneously analyzes sulfated and nonconjugated intermediate metabolites. Using this assay, we found that sulfated metabolites were converted to nonconjugated carboxychromanols by sulfatase digestion. In cultured cells, ~45% long-chain carboxychromanols from γ-T but only 10% from δ-T were sulfated. Upon supplementation with γ-T, rats had increased tissue levels of 9′S, 11′S, and 13′S, 13′-hydroxychromanol, 13′-carboxychromanol, and γ-CEHC. The plasma concentrations of combined sulfated long-chain metabolites were comparable to or exceeded those of CEHCs and increased proportionally with the supplement dosages of γ-T. Our study identifies sulfated long-chain carboxychromanols as novel vitamin E metabolites and provides evidence that sulfation may occur parallel with β-oxidation. In addition, the HPLC fluorescence assay is a useful tool for the investigation of vitamin E metabolism.
Supplementary key words: tocopherol; tocotrienol; 7,8-dimethyl-2-(β-carboxyethyl)-6-hydroxychroman; sulfation; metabolism; high-performance liquid chromatography; fluorescence detection
Natural forms of vitamin E have eight structurally related molecules [i.e., α-, β-, γ-, or δ-tocopherol (α-T, β-T, γ-T, or δ-T) and four corresponding tocotrienols] (Scheme 1). All of these molecules have a chromanol ring and a 16 carbon phytyl chain, which are responsible for the potent antioxidant activity and lipophilic property, respectively. Despite structural similarity, different vitamin E forms appear to have distinct bioactivity and to be distinctively metabolized (1, 2). α-T is the predominant vitamin E form in tissues and is the least catabolized. On the other hand, some portions of non-α forms are likely to be readily metabolized and/or excreted directly via the bile (3), because they do not appear to be accumulated to the same extent as α-T in most tissues. To elucidate the potential biological functions of each vitamin E form, it is important to understand their metabolism and to identify the major metabolites in the body.
Scheme 1.

Structures of tocopherols and their terminal metabolite, 7,8-dimethyl-2-(β-carboxyethyl)-6-hydroxychroman (CEHC). α-T, β-T, γ-T, or δ-T, α-, β-, γ-, or δ-tocopherol.
The understanding of how vitamin E is metabolized was initiated by the identification of their urine-excreted metabolites. The water-soluble metabolite of δ-T, δ-7,8-dimethyl-2-(β-carboxyethyl)-6-hydroxychroman (CEHC), was first found in rat urine (4) (Scheme 1). Subsequently, γ-CEHC and α-CEHC were identified to be the major urine-excreted metabolites of γ-T and α-T, respectively (5–9). γ-CEHC has been shown to have natriuretic activity (9) and to inhibit the formation of proinflammatory prostaglandin E2 in cultured cells (10, 11) and in a rat inflammation model (12).
It is believed that the vitamin E forms are catabolized via cytochrome P450-mediated ω-hydroxylation and oxidation of the 13′-carbon, followed by stepwise β-oxidation to cut off two or three carbon moiety each cycle from the phytyl chain (13–15). This mechanism was revealed by the identification of a series of carboxychromanol and 13′-hydroxychromanol (13′-OH) intermediates in HepG2 cells and rat liver incubated with vitamin E forms (13, 15). The formation of conjugated CEHCs, including sulfated and/or glucuronidated esters, was also reported in urine (4–8, 16) and in tissues (17). However, studies on conjugated metabolites were confined to the terminal CEHCs. In this study, we used a sensitive HPLC fluorescence assay coupled with electrospray ionization mass spectrometry (ESI-MS) to study vitamin E metabolism. We found that γ-T and δ-T were metabolized to novel metabolites (i.e., sulfated long-chain carboxychromanols) in human A549 cells and that these sulfated metabolites were detected in rats supplemented with γ-T.
MATERIALS AND METHODS
Materials
α-T (99%), γ-T (97–99%), and δ-T (97%) were purchased from Sigma (St. Louis, MO). γ-CEHC (⩾98%) was from Cayman Chemicals (Ann Arbor, MI). γ-Tocotrienol was a gift from BASF. Tissue culture reagents were from Invitrogen (Rockville, MD). Sesamin, DMSO, and all other chemicals were purchased from Sigma.
Cell culture
The human alveolar epithelial cell line A549 was obtained from the American Type Culture Collection (Manassas, VA). Cells were maintained routinely in RPMI 1640 with 10% FBS. At the time of experiments, cells were seeded in RPMI 1640 with 10% FBS at a density of 8 × 10⁵ cells per well on six-well plates. All of the experiments were performed at 100% cell confluence. Twenty-four hours later, media were replaced with fresh DMEM containing 1% FBS with vitamin E forms or DMSO (0.05%) in controls. Cells were incubated for 24–72 h as specified in Results. Media were collected, and cells were harvested by scraping after a brief wash with PBS. Collected media and cells were frozen immediately and stored at −20°C until use.
Metabolite extraction from culture media and cells
Cell pellets were resuspended in 200 μl of PBS and sonicated for 10 s on ice. The broken cell suspensions were further diluted with 200 μl of PBS. Ascorbic acid (8 μl, 11 mg/ml) was added to 400 μl of cell culture media or broken cell suspension, which was then mixed with 10 μl of ethanol and 500 μl of hexane. The mixture was vortexed for 1 min, followed by centrifugation at 13,000 rpm for 2 min. After extraction, the hexane layer was discarded and the aqueous phase was acidified using 14 μl of acetic acid. The aqueous phase was extracted twice with 1 ml of ethyl acetate, vortexed, and centrifuged. The combined ethyl acetate layers were dried under nitrogen. The residue was reconstituted in 200 μl of 70% methanol and 30% water and injected onto the HPLC column.
Metabolite extraction from plasma and liver
Liver samples were homogenized in 10 mM Tris buffer with 2 mM EDTA (pH 7.2) on ice. Homogenate (200 μl) was diluted in an equal volume of PBS, added with 8 μl of ascorbic acid (11 mg/ml), and then extracted with hexane followed by ethyl acetate after acidification with 13 μl of acetic acid as described above. Our preliminary studies showed that hexane extraction decreased the yield of some long-chain carboxychromanols such as 13′-OH in the plasma samples but not in cultured media; therefore, this step was omitted for plasma samples. Thus, 200 μl of plasma was first diluted with an equal volume of PBS and then acidified using 20 μl of acetic acid. Metabolites were then extracted twice with 1 ml of ethyl acetate containing 40 μg/ml ascorbic acid. The combined ethyl acetate layers were dried under nitrogen. The residue was reconstituted in 200 μl of 70% methanol and 30% water and injected onto the HPLC column.
Analysis of vitamin E metabolites by HPLC assay with fluorescence detection
Metabolites were separated using HPLC and detected with a Shimadzu RF-10AXL spectrofluorometric detector (Shimadzu, Columbia, MD) with the excitation and emission wavelengths at 292 and 327 nm, respectively. The samples were injected through a 50 μl loop Rheodyne 7125 injection valve (Rohnert Park, CA) or a Hitachi L-7200 autosampler (San Jose, CA). The mobile phases were A (35% acetonitrile and 65% 10 mM ammonium acetate at pH 4.3) and B (96% acetonitrile and 4% 10 mM ammonium acetate at pH 4.3). The metabolites were separated on a 5 μm Supelcosil LC-18-DB column, 4.6 × 150 mm (Supelco, Bellefonte, PA), using a flow rate of 1.0 ml/min with the following gradient: 100% A for 8 min, linearly increasing to 100% B from 8 to 30 min, 100% B until 55 min, and then back to 100% A at 56 min. γ-CEHC was quantified using the authentic standard as the external standard. Long-chain metabolites were quantified using tocopherols as the external standards with a correction factor based on the linear relationship between fluorescence intensity and solvent content, which is described in detail in Results.
ESI-MS
The LC-MS experiments were carried out using negative ion electrospray ionization on an LCQ Classic (ThermoFinnigan Corp., San Jose, CA) mass spectrometer. The electrospray needle voltage was set at 4.5 kV, the heated capillary voltage was set to −10 V, and the capillary temperature was set at 220°C. Typical background source pressure was 1.2 × 10⁻⁵ Torr as read by an ion gauge. The drying gas was nitrogen. The LCQ system was scanned to 1,000 amu for these experiments. The sample was extracted as described above and dissolved in methanol. The sample was injected into a 20 μl injection loop before separation on a 5 μm Supelcosil LC-18-DB column, 4.6 × 150 mm, using a Dionex P580 liquid chromatography pump (Dionex Corp., Sunnyvale, CA) with a flow rate of 1 ml/min. The LC mobile phases were described above. The model UVD340U ultraviolet light detector was set at 292 nm for these studies. In some experiments, individual metabolites such as sulfated 9′-carboxychromanol (9′S) were isolated and analyzed using negative ion electrospray ionization under the conditions described above.
Inductively coupled plasma mass spectrometry
Individual metabolites were purified from cell culture media using a Supelcosil LC-18-DB semipreparative column by HPLC. The mobile phase and gradient were similar to those described above, except that the first 8 min isocratic elution was omitted and the flow rate was 4 ml/min. A mobile phase control was collected for the detection of 34S or 31P background in the solvent. Samples were dried in a Savant AES2010 SpeedVac, and the residues were resuspended in 100 μl of 10 mM NaAc at pH 3.7 followed by two extractions with ethyl acetate. The dried residues were then digested by concentrated HNO3 for 2 h. The final solution for the inductively coupled plasma mass spectrometry (ICP-MS) analysis was 2% HNO3. ICP-MS of 34S and 31P was performed using an ELEMENT-2 (ThermoFinnigan, Bremen, Germany) mass spectrometer in the medium resolution mode. The samples were introduced into the plasma using an Aridus desolvating system with a T1H nebulizer (Cetac Technologies, Omaha, NE), which is used to enhance sensitivity and reduce oxide and hydride interference.
GC-MS
The metabolite suspected to be hydroxychromanol was isolated from A549 cells by HPLC, dried under N2, and derivatized by bis(trimethylsilyl)trifluoroacetamide in the presence of pyridine at 75°C for 2 h. The capillary gas chromatography-mass spectrometry analyses were carried out using a GCQ (Finnigan-MAT/ThermoElectron Corp.) mass spectrometer. Typical electron energy was 70 eV, with the ion source temperature maintained at 200°C. The individual components were separated using a 15 m DB-1 capillary column. The initial column temperature was set at 100°C and programmed to 310°C at 10.0°C/min. The injector temperature was set at 250°C.
Experiments with sulfatase digestion
Metabolites from cell culture media were extracted as described above and reconstituted in 0.1 M sodium acetate (pH 5) with or without the addition of ascorbate (8 μl, 11 mg/ml). Samples were hydrolyzed by sulfatase (Helix promatia H-1) at a final concentration of 26 U/ml. After 45 min of incubation at 37°C, samples were acidified to pH 3–4 by the addition of 5 μl of acetic acid. Metabolites were subsequently extracted twice with ethyl acetate and analyzed using HPLC. In some experiments, specific sulfated long-chain carboxychromanols, such as 9′S and 13′S, were isolated using HPLC with a semipreparative column and then digested using sulfatase under the described conditions. Under these digestion conditions, the presence or absence of ascorbate did not affect the yield of each compound, including nonconjugated metabolites.
Quantitation of tocopherols
α-T and γ-T were measured by HPLC assay with electrochemical detection (18). Briefly, tocopherols were extracted from plasma or tissue homogenates using a mixture of methanol and hexane (2:5, v/v) as described (19, 20). All extractions were carried out in the presence of 0.8 mM butylated hydroxytoluene and 0.1 volume of 0.5 M sodium dodecyl sulfate for liver samples. After centrifugation at 1,000 g for 10 min at 4°C, the top hexane layer was evaporated under N2 and the dried residue was redissolved in ethanol. For tissues, samples were filtered through a 0.2 μm filter to remove any nondissolved particles before injection onto the HPLC column. Tocopherols were separated on a 150 × 4.6 mm, 5 μm Supelcosil LC-18-DB column and eluted with 95:5 (v/v) methanol-0.1 M lithium acetate (final concentration, 25 mM, pH 4.75) at a flow rate of 1.3 ml/min. Tocopherols were monitored by coulometric detection (model Coulochem II; ESA, Inc., Chelmsford, MA) at 300 mV (upstream) and 500 mV (downstream electrode) using a model 5011 analytical cell.
Animal studies
All animal studies were approved by the Purdue Animal Care and Use Committee. Male Wistar rats (230–250 g) were purchased from Charles River and housed at the Purdue Life Science Animal Facility for 1 week for adaptation before experiments. Animals were randomly grouped according to body weight. Rats were administered γ-T at 9, 45, or 90 mg/kg body weight using tocopherol-stripped corn oil (0.5 ml) as the vehicle (n = 3 in each group). Control animals received 0.5 ml of tocopherol-stripped corn oil. Six hours later, animals were euthanized, and plasma, liver, and other tissues were collected.
Statistical analysis
Unpaired Student’s t-test was used in the statistical analyses. All results are expressed as means ± SD.
RESULTS
Identification of vitamin E metabolites in A549 cells
We developed a sensitive HPLC assay with fluorescence detection to analyze vitamin E metabolites. This method took advantage of the fact that the chromanol ring gives a strong fluorescent signal at emission of 327 nm with an excitation of 292 nm. In light of a recent finding by You et al. (21) that vitamin E forms are metabolized to long-chain carboxychromanols in A549 cells, we decided to use our fluorescence method to further characterize vitamin E metabolites in this cellular system. The major metabolites of vitamin E forms were identified by ESI-MS. Consistent with the previous observations (21), we found long-chain carboxychromanols in the cell culture media after A549 cells were incubated with γ-T and other vitamin E forms. Figure 1A, B show, respectively, a representative HPLC chromatogram with fluorescence detection and an ESI mass spectrum of these long-chain carboxychromanols from γ-T. These metabolites include 9-(6-hydroxy-2,7,8,-trimethyl-chroman-2-yl)-2,6-dimethyl-nomanoic acid, 11-(6-hydroxy-2,7,8,-trimethyl-chroman-2-yl)-4,8-dimethyl-undecanoic acid, and 13-(6-hydroxy-2,7,8,-trimethyl-chroman-2-yl)-2,6,10-trimethyl-tridecanoic acid, which are designated 9′-, 11′-, and 13′-carboxychromanol (9′-, 11′-, and 13′-COOH), respectively (Scheme 2). Besides the metabolites in cell culture media, we also identified 13′-OH (Scheme 2) by GC-MS (data not shown), which appeared to be associated primarily with the cells. These metabolites disappeared when cells were coincubated with 1 μM sesamin, an inhibitor of tocopherol ω-hydroxylase (22).
Fig. 1.
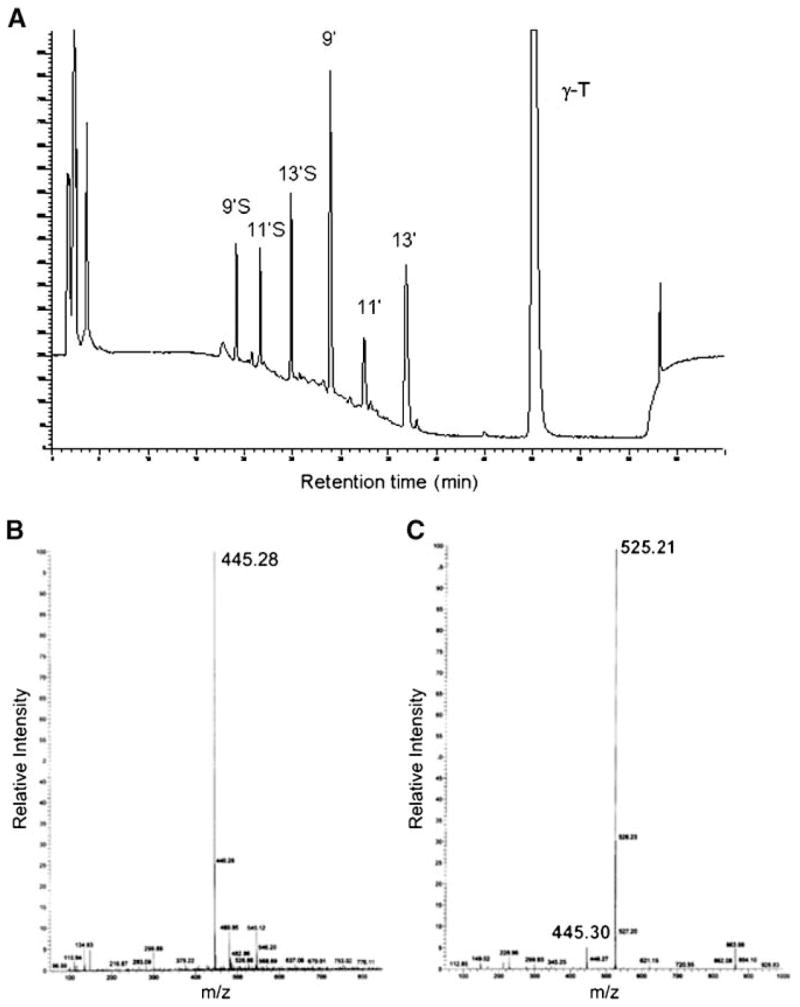
Identification of metabolites from γ-tocopherol (γ-T) in cultured A549 cells. A: HPLC (with fluorescence detection) of γ-T metabolites accumulated in the cell culture media after A549 cells were incubated with 50 μM γ-T for 72 h. 9′, 11′, and 13′ represent 9′-, 11′-, and 13′-carboxychromanol (COOH), and 9′S, 11′S, and 13′S stand for sulfated 9′-, 11′-, and 13′-carboxychromanol, respectively. B, C: Electrospray ionization mass spectrometry of 13′-COOH and 13′S, respectively.
Scheme 2.

Proposed metabolism of vitamin E forms based on the identified metabolites. Based on previous studies, vitamin E forms are metabolized via ω-hydroxylation and β-oxidation. The present study suggests that sulfation is a parallel process to β-oxidation. Dashed arrows indicate hypothesized reaction pathways that need to be further characterized.
In addition to 9′-, 11′-, and 13′-COOH, we discovered three novel metabolites that showed molecular masses that are 80 mass units greater than those of 9′-, 11′- and 13′-COOH, respectively (Fig. 1C shows 13′-COOH as an example). These results suggest a potential phosphorylation (HPO3) or sulfation (SO3) of carboxychromanols. The phosphorylation/sulfation was further confirmed by carefully examining the mass spectra; a fragment ion corresponding to a loss of HPO3 or SO3 from the parental ion [M-H]− was found in all phosphorylated/sulfated derivatives (e.g., m/z 525 → m/z 445; Fig. 1C), a phenomenon commonly seen in MS analysis of phosphorylated compounds (23). Consistently, the tandem MS of the phosphorylated/sulfated carboxychromanol [M-H]− gave a predominant peak corresponding to a loss of 80 mass units (data not shown).
Sulfation rather than phosphorylation was revealed by the following observations. First, the isotope pattern from the MS strongly suggested sulfation. Specifically, after baseline correction, the relative abundance of 525.21 [(M-H)−], 526.23 [(M-H)−+1], and 527.20 [(M-H)−+2] of sulfated/phosphorylated 13′-COOH was 100, 32.2, and 10.5 (Fig. 1C), consistent with the predicted isotopic pattern for sulfation (i.e., 100, 31.8, and 10.8) in contrast to phosphorylation (i.e., 100, 31.1, and 6.1). Second, ICP-MS of isolated sulfated/phosphorylated 9′-COOH showed an increase in sulfur (34S) ion intensity compared with the baseline or the collected mobile phase control (Fig. 2A). On the other hand, measurement of the phosphorous (31P) ion signal showed no increase for the isolated peak compared with the collected mobile phase control (data not shown). In addition, digestion of isolated 9′S with sulfatase resulted in a significant decrease in this sulfated metabolite and a simultaneous increase in nonconjugated 9′-COOH (Fig. 2B). This also suggested that sulfation is likely to occur at the hydroxyl group on the chromanol ring.
Fig. 2.
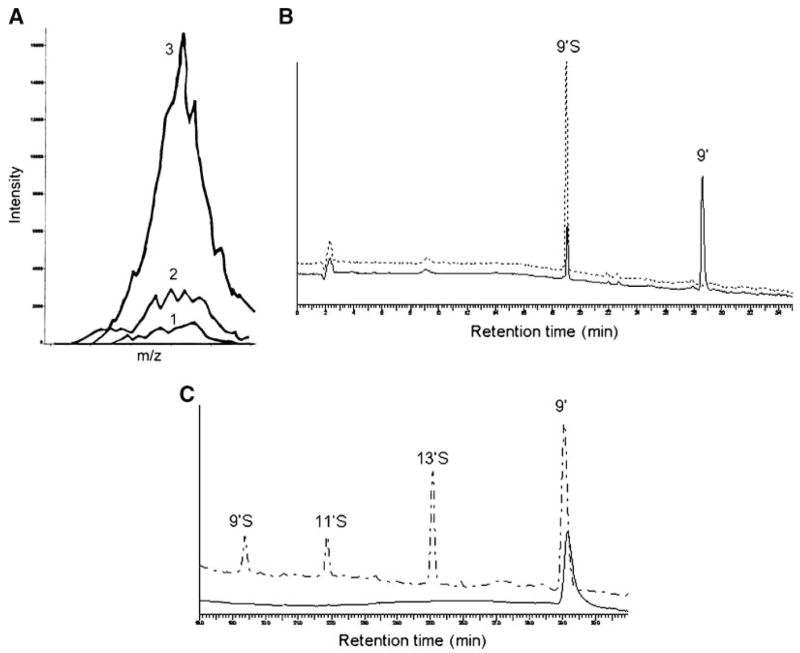
A: Inductively coupled plasma mass spectrometry (ICP-MS) detection of 34S for isolated 9′S. Traces 1, 2, and 3 show 34S intensity of 2% HNO3 (the solvent blank), an isolated mobile phase control, and isolated 9′S, respectively. B: HPLC of the isolated 9′S, which was incubated in 0.1 M sodium acetate (pH 5) at 37°C for 1 h (upper trace), and after 9′S was digested with a sulfatase under the same conditions (lower trace). C: Relative responses of metabolites to electrochemical oxidation (lower trace) compared with fluorescent signal detection (upper trace). Metabolites from γ-T extracted from cell culture media were separated by HPLC and detected by fluorescence detection (excitation and emission wavelengths were set at 292 and 327 nm, respectively), followed by coulometric detection at 400 mV using a model 5011 analytical cell.
To further confirm the site for sulfation, electrochemical detection was used to compare the relative redox activity between sulfated and unsulfated carboxychromanols. Our data showed that although 9′-COOH was readily oxidized, sulfated carboxychromanols were resistant to electrochemical oxidation (Fig. 2C). This observation confirmed that sulfation occurred at the phenolic group (Scheme 2) and suggested that sulfated metabolites appeared to lose antioxidant activities.
Like γ-T, δ-T was metabolized to 9′S, 11′S, and 13′S, as well as 13′-OH and nonconjugated carboxychromanols, in A549 cells, which were identified by ESI-MS (data not shown). On the other hand, no metabolites from α-T could be detected in A549 cells. In addition, consistent with the observations of You et al. (21), the terminal water-soluble metabolite, CEHC, was not detectable in A549 cells.
Optimization of the HPLC fluorescence assay and quantification of the long-chain intermediate metabolites
To quantitatively measure sulfated and nonconjugated long-chain carboxychromanols, we optimized the sample processing procedure and HPLC separation conditions, as described in Materials and Methods. Under the described sample processing procedure, the extraction efficiency of the metabolites, as determined using γ-CEHC and isolated 9′S, was 97% or greater. Because the metabolites vary to a great degree in hydrophobicity as their side chains range from 3 to 13 carbons in length, the HPLC gradient was optimized to ensure a good separation. The final gradient includes an isocratic elution with 35% acetonitrile to allow γ-CEHC and other relatively shorter chain length metabolites to elute, and then a relatively steep linear gradient followed by an isocratic elution with 96% acetonitrile to elute the relatively hydrophobic molecules, such as 13′-COOH, 13′-OH, and the parent vitamins (Fig. 1A). The detection limit was 0.3–0.4 pmol on column, with a signal-to-noise ratio of 6. The within-day and interday variations of intermediate metabolites were 8–10% and 5–12%, respectively. A broad range of linearity was observed between the fluorescence response and analyte concentrations, as determined using γ-CEHC and 9′S from 50 nM to 5 μM.
We found that fluorescence intensity was not sensitive to the modification of the side chain among vitamin E forms. Therefore, γ-T and γ-tocotrienol gave similar fluorescent signals (peak areas) when they were injected at the same concentrations. On the other hand, fluorescent signals are known to be sensitive to the solvent composition. A relationship between fluorescent signals and the mobile phase composition (percentage solvent B) was investigated by a series of injections of γ-tocotrienol under isocratic conditions, with 100, 90, 85, and 80% solvent B and the corresponding 0, 10, 15, and 20% solvent A, respectively. A linear relationship was revealed, which is expressed by the equation y = 0.187x − 6.34 (R2 = 0.995), where x is the percentage of solvent B and y is the peak area (×10−6) of 1 μM of the standard (Fig. 3). Concentrations of non-conjugated long-chain carboxychromanols were then calculated based on the peak area of the standard under a specific mobile phase composition (percentage solvent B) when they are eluted. Sulfated carboxychromanols were calculated from the concentrations of long-chain carboxychromanols multiplied by 1.4, a signal suppression factor that was obtained from a ratio of the increase in the nonconjugated metabolite (9′or 13′) to the corresponding decrease of the sulfated metabolite (9′S or 13′S), as assayed by sulfatase digestion experiments (Fig. 2B).
Fig. 3.
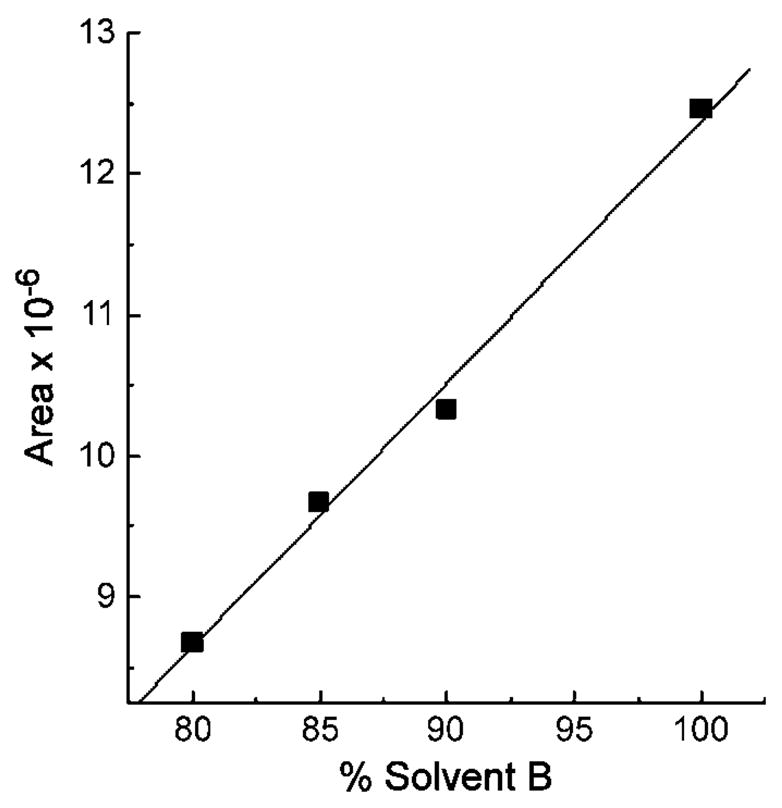
A linear relationship exists between the mobile phase composition (percentage solvent B) and the fluorescence response (peak area). Twenty microliters of γ-tocotrienol (1 μM) was injected onto the HPLC apparatus under isocratic conditions with 100, 90, 85, and 80% solvent B and the corresponding 0, 10, 15, and 20% solvent A, respectively. The fluorescence responses under these various conditions were plotted with the corresponding mobile phase content, which showed a linear relationship and can be expressed by the equation y = 0.187x − 6.34 (R2 = 0.994), where x is the percentage of solvent B and y is the area (×10−6) of 1 μM of the standard.
Measurement of metabolites from γ-T and δ-T in cultured A549 cells
Using this HPLC fluorescence assay, we studied the formation of intermediate metabolites in A549 cells. Figure 4 summarizes time-dependent changes of the concentrations of major metabolites from γ-T and δ-T in cultured media. The amount of total metabolites increased proportionally with incubation time. The generation of sulfated metabolites lagged behind that of unsulfated carboxychromanols (Fig. 4), suggesting that carboxychromanols are likely the primary targets for sulfation. The presence of sesamin, an inhibitor of cytochrome P450, almost completely abolished the formation of all metabolites (data not shown). The total amount of metabolites from δ-T was greater than that from γ-T. On the other hand, more sulfated long-chain carboxychromanols were found from γ-T; thus, after 72 h of incubation, ~45% of metabolites from γ-T, but only 10% from δ-T, were sulfated (Fig. 4).
Fig. 4.
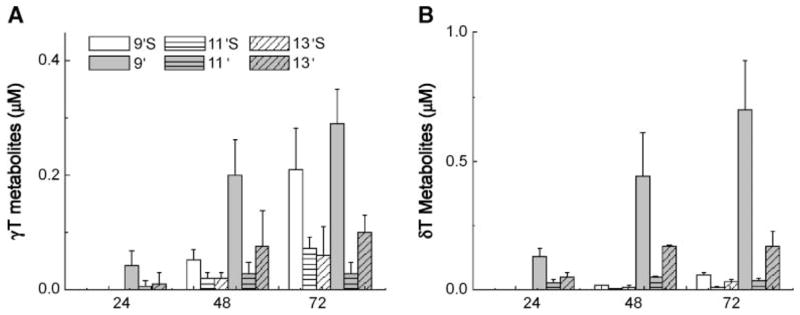
Time-dependent accumulation of various metabolites in cultured cells. Ten micromolar γ-T (A) and δ-T (B) were incubated in confluent A549 cells for 24, 48, or 72 h, and media were collected. Metabolites were quantified using HPLC assay with fluorescence detection. Data shown are averages ± SD of three independent experiments.
γ-T was metabolized to hydroxychromanols, carboxychromanols, and sulfated long-chain carboxychromanols in rat tissues
To test whether the long-chain carboxychromanols and their sulfated metabolites are present in tissues, we conducted animal experiments in which Wistar rats were orally administered various doses of γ-T (i.e., 9, 45, or 90 mg/kg body weight). Control rats received tocopherol-stripped corn oil, which was used as the vehicle to deliver γ-T. Approximately 6 h after γ-T administration, plasma and liver samples were collected. Using the HPLC fluorescence assay, we found that in γ-T-administered rats, plasma had several new peaks that showed the same retention times as those of 9′S, 11′S, 13′S, 13′-OH, and 13′-COOH (Fig. 5). The concentrations of these products increased almost proportionally to the supplement doses of γ-T (Table 1). In contrast, except for γ-CEHC, no significant amounts of any of these metabolites were shown in the controls (Fig. 5). As expected, γ-T supplementation led to a significant increase of γ-T and γ-CEHC but had no significant effect on α-T. Interestingly, the amount of combined sulfated long-chain metabolites appeared to be comparable to or exceeded those of γ-CEHC in the plasma (Table 1).
Fig. 5.
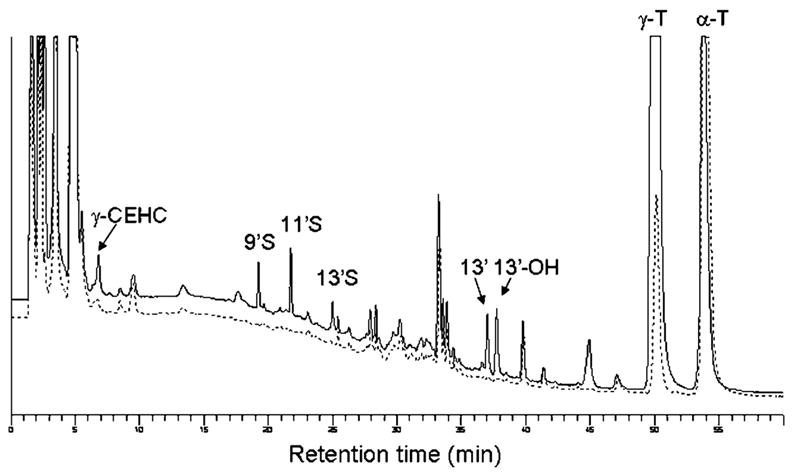
Metabolites identified in rat plasma upon γ-T supplementation. Wistar rats were fed a single dose of γ-T at 90 mg/kg in corn oil (upper trace) or tocopherol-stripped corn oil alone (lower trace). Six hours later, rats were euthanized and plasma as well as other tissues were collected. CEHC, 7,8-dimethyl-2-(β-carboxyethyl)-6-hydroxychroman; 13′-OH, 13′-hydroxychromanol; 13′, 13′-carboxychromanol; 9′S, 11′S, 13′S, sulfated 9′-, 11′-, and 13′-carboxychromanol.
TABLE 1.
Long-chain metabolites and their sulfated derivatives are found in rat tissues
| Treatment | γ-CEHC | 9′S | 11′S | 13′S | 13′-COOH | 13′-OH | α-T | γ-T |
|---|---|---|---|---|---|---|---|---|
| Plasma (μM) | ||||||||
| Corn control | 0.025 ± 0.02 | N.D. | N.D. | N.D. | N.D. | N.D. | 26.1 ± 5 | 1.5 ± 0.1 |
| γ-T, 9 | 0.036 ± 0.05 | 0.021 ± 0.01 | 0.02 ± 0.01 | 0.006 ± 0.01 | 0.016 ± 0.003 | 0.017 ± 0.003 | 19.8 ± 1.4 | 4.1 ± 1.1 |
| γ-T, 45 | 0.17 ± 0.05 | 0.09 ± 0.05 | 0.09 ± 0.05 | 0.034 ± 0.01 | 0.11 ± 0.1 | 0.10 ± 0.02 | 25.2 ± 6.4 | 17.8 ± 5.5 |
| γ-T, 90 | 0.11 ± 0.02 | 0.12 ± 0.02 | 0.12 ± 0.04 | 0.07 ± 0.03 | 0.14 ± 0.03 | 0.11 ± 0.1 | 22.7 ± 4.6 | 20.2 ± 9.1 |
| Liver (nmol/g tissue) | ||||||||
| Corn control | – | N.D. | N.D. | N.D. | N.D. | N.D. | 65.4 ± 8.6 | 3.2 ± 0.3 |
| γ-T, 9 | – | N.D. | N.D. | 0.04 ± 0.01 | 0.053 ± 0.04 | 0.05 ± 0.04 | 53.4 ± 3.3a | 11.6 ± 2.3 |
| γ-T, 45 | – | 0.03 ± 0.02 | N.D. | 0.31 ± 0.12 | 0.43 ± 0.24 | 0.27 ± 0.1 | 60.1 ± 8.5 | 45.8 ± 4.7 |
| γ-T, 90 | – | 0.07 ± 0.04 | N.D. | 0.43 ± 0.15 | 0.73 ± 0.21 | 0.37 ± 0.2 | 63.7 ± 5.7 | 63.1 ± 18.6 |
-T or γ-T, α- or γ-tocopherol; CEHC, 7,8-dimethyl-2-(β-carboxyethyl)-6-hydroxychroman; 13′-COOH, 13′-carboxychromanol; 13′-OH, 13′-hydroxychromanol; N.D., not detectable; 9′S, 11′S, and 13′S, sulfated 9′-, 11′-, and 13′-carboxychromanol. Wistar male rats were administered a single dose of γ-T at 9, 45, or 90 mg/kg body weight as indicated (n = 3 in each group) by gavage using tocopherol-stripped corn oil as the vehicle. Six hours later, animals were euthanized and tissues, including plasma and liver, were collected. The metabolites and tocopherols were analyzed as described in Materials and Methods. Animals were not fasted during the entire experiments. –, liver γ-CEHC could not be accurately measured because of interference peaks.
P < 0.05, significant difference of α-T between controls and rats supplemented with γ-T at 9 mg/kg.
In the liver, 13′-OH, 13′-COOH, and 13′S were detected in rats supplemented with γ-T at 9 mg/kg, whereas none of these metabolites was found in the control group (Table 1). At higher supplement doses of 45 and 90 mg/kg, 9′S was also observed. Liver concentrations of these metabolites were 3- to 5-fold higher than those in the plasma (Table 1). Supplementation of γ-T resulted in a similar increase of γ-T to that in plasma but did not significantly affect concentrations of α-T, with the exception of γ-T at 9 mg/kg.
DISCUSSION
A major finding of this study is the identification of sulfated long-chain carboxychromanols as novel vitamin E metabolites (Scheme 2). Using LC-ESI-MS and ICP-MS as well as experiments with sulfatase digestion, we unambiguously demonstrated that 9′S, 11′S, and 13′S were generated from γ-T and δ-T in cultured human A549 cells (Scheme 2). Significant amounts of these sulfated metabolites were detected by a HPLC fluorescence assay in rats that were moderately supplemented with γ-T (9 mg/kg). The level of sulfated metabolites in rat plasma increased proportionally to the supplement dosages of γ-T (Table 1). Previous reports on the formation of conjugated metabolites were limited to the terminal urinary metabolites, CEHCs (4–8, 16). Our study demonstrated that significant amounts of sulfation occurred at long-chain carboxychromanols, the intermediate metabolites generated from β-oxidation of the phytyl chain. This suggests that sulfation of intermediate long-chain carboxychromanols may occur parallel with β-oxidation (Scheme 2). In addition, the detection of 9′S, 11′S, and 13′S, as well as 13′-OH and 13′-COOH, in rat plasma and liver, together with previous findings documenting intermediate metabolites, including 5′-carboxychromanol and 13′-OH in tissues (17, 22, 24), provide direct evidence for the existence in tissue of intermediate metabolites as a result of ω-hydroxylation and β-oxidation.
We developed a sensitive HPLC fluorescence assay that allows the simultaneous analysis of sulfated and nonconjugated intermediate metabolites that differ greatly in hydrophobicity (Fig. 1). This assay made use of the fact that chromanol rings have strong fluorescent signals, regardless of the length of the side chain. Our results indicate that neither electrochemical detection nor GC-MS can be used to detect sulfated carboxychromanols, because of their lack of redox activity (Fig. 2C) or the inertness of the conjugated phenolic group to chemical derivatization, respectively. On the other hand, LC-MS could be an alternative approach for conjugated and non-conjugated metabolites. A LC-MS method for nonconjugated metabolites was recently reported by Leonard et al. (17).
Our study showed that the amounts of sulfated carboxychromanols formed varied between vitamin E forms. Thus, after 72 h of incubation, 45% of metabolites from γ-T, but only 10% from δ-T, were sulfated in A549 cells. These results suggest a possible distinct substrate specificity of sulfotransferase(s) (25) and the fact that sulfation may play distinctive roles in the metabolism of different vitamin E forms. In addition, this study suggests that sulfated long-chain carboxychromanols may be novel excreted metabolites, especially under supplementation conditions. Further study is necessary to detect the potential excretion of these metabolites in the urine or feces.
The current study revealed important aspects of sulfation. First, although both sulfated and unsulfated 9′-, 11′-, and 13′-COOH existed in cell culture media, only 9′S and 11′S, but not their unconjugated counterparts, were found in the plasma and liver (Table 1). The lack of 9′-COOH and 11′-COOH did not result from poor detection, as the current assay is slightly more sensitive to unconjugated carboxychromanols than sulfated ones (see Results). One explanation is that carboxychromanols were readily degraded to CEHCs, whereas sulfated carboxychromanols were accumulated, as they may be poor substrates for β-oxidation. This can be examined by following the pharmacokinetics of the generation of sulfated intermediate metabolites and CEHCs. It is also possible that in rats, 9′S and 11′S can be derived directly from 13′S via β-oxidation (Scheme 2), which needs to be further investigated. In addition, plasma concentrations of combined sulfated long-chain carboxychromanols were comparable to or exceeded those of γ-CEHC (Table 1). This suggests that sulfation may play an important role in metabolism, at least under supplementation conditions. To further elucidate the role of sulfation in vitamin E metabolism, studies are needed to investigate how sulfation inhibitors or modulation of sulfotransferase/sulfatase by genetic means would affect the generation of intermediate and terminal metabolites.
We showed that sulfated long-chain carboxychromanols are generated in a human cell line as well as in rats, but whether these metabolites exist in human tissues remains to be established. Previously, studies on conjugated CEHCs have reported both sulfation and glucuronidation. Thus, Schultz et al. (5) concluded that α-CEHC sulfate but not glucuronide conjugate was predominantly present in human urine. Pope et al. (16) showed that both glucuronidated and sulfated α-CEHC were detectable in human urine. On the other hand, Chiku, Hamamura, and Nakamura (4) reported that δ-CHEC sulfate was the major conjugate excreted in rat urine. The current study calls attention to further investigation of the potential formation of conjugated (both glucuronide and sulfate) long-chain carboxychromanols after vitamin E supplementation in humans. In addition, study of the potentially interesting activity of these conjugated carboxychromanols may be needed, because recent studies have suggested that sulfation is not just a simple modification involved in detoxification but could play a role in the regulation of specific biological activities (26, 27).
In summary, we have shown that γ-T and δ-T are metabolized to sulfated long-chain carboxychromanols in cultured human A549 cells and in rat tissues. The generation of these novel vitamin E metabolites suggests that sulfation of long-chain carboxychromanols is a parallel process to β-oxidation during vitamin E catabolism. The HPLC fluorescence assay described here should be a useful tool for the future study of vitamin E metabolism, which will include investigation of the role of sulfation in the metabolism of different forms of vitamin E in animals and humans and study of the bioactivities of the metabolites.
Acknowledgments
The authors thank Deborah Miles (LC/MS) and Arlene Rothwell (ICP-MS) at the Purdue University Campus-Wide Mass Spectrometry Center. The authors also thank Michelle Moreland for help with animal studies. This work was supported, in part, by National Institutes of Health Grant R01 AT-001821 (Q.J.).
Abbreviations
- α-T
β-T, γ-T, or δ-T, α-, β-, γ-, or δ-tocopherol
- CEHC
7,8-dimethyl-2-(β-carboxyethyl)-6-hydroxychroman
- 9′-
11′-, and 13′-COOH, 9′-, 11′-, and 13′-carboxychromanol
- ESI-MS
electrospray ionization mass spectrometry
- ICP-MS
inductively coupled plasma mass spectrometry
- 13′-OH
13′-hydroxychromanol
- 9′S
11′S, and 13′S, sulfated 9′-, 11′-, and 13′-carboxychromanol
Footnotes
This article is available online at http://www.jlr.org
References
- 1.Brigelius-Flohe R, Traber MG. Vitamin E: function and metabolism. FASEB J. 1999;13:1145–1155. [PubMed] [Google Scholar]
- 2.Jiang Q, Christen S, Shigenaga MK, Ames BN. Gamma-tocopherol, the major form of vitamin E in the US diet, deserves more attention. Am J Clin Nutr. 2001;74:714–722. doi: 10.1093/ajcn/74.6.714. [DOI] [PubMed] [Google Scholar]
- 3.Kayden HJ, Traber MG. Absorption, lipoprotein transport, and regulation of plasma concentrations of vitamin E in humans. J Lipid Res. 1993;34:343–358. [PubMed] [Google Scholar]
- 4.Chiku S, Hamamura K, Nakamura T. Novel urinary metabolite of d-delta-tocopherol in rats. J Lipid Res. 1984;25:40–48. [PubMed] [Google Scholar]
- 5.Schultz M, Leist M, Petrzika M, Gassmann B, Brigelius-Flohe R. Novel urinary metabolite of alpha-tocopherol, 2,5,7,8-tetramethyl-2(2′-carboxyethyl)-6-hydroxychroman, as an indicator of an adequate vitamin E supply? Am J Clin Nutr. 1995;62(Suppl 6):1527–1534. doi: 10.1093/ajcn/62.6.1527S. [DOI] [PubMed] [Google Scholar]
- 6.Traber MG, Elsner A, Brigelius-Flohe R. Synthetic as compared with natural vitamin E is preferentially excreted as alpha-CEHC in human urine: studies using deuterated alpha-tocopheryl acetates. FEBS Lett. 1998;437:145–148. doi: 10.1016/s0014-5793(98)01210-1. [DOI] [PubMed] [Google Scholar]
- 7.Swanson JE, Ben RN, Burton GW, Parker RS. Urinary excretion of 2,7,8-trimethyl-2-(beta-carboxyethyl)-6-hydroxychroman is a major route of elimination of gamma-tocopherol in humans. J Lipid Res. 1999;40:665–671. [PubMed] [Google Scholar]
- 8.Stahl W, Graf P, Brigelius-Flohe R, Wechter W, Sies H. Quantification of the alpha- and gamma-tocopherol metabolites 2,5,7,8-tetramethyl-2-(2′-carboxyethyl)-6-hydroxychroman and 2,7,8-trimethyl-2-(2′-carboxyethyl)-6-hydroxychroman in human serum. Anal Biochem. 1999;275:254–259. doi: 10.1006/abio.1999.4312. [DOI] [PubMed] [Google Scholar]
- 9.Wechter WJ, Kantoci D, Murray ED, Jr, D’Amico DC, Jung ME, Wang WH. A new endogenous natriuretic factor: LLU-α. Proc Natl Acad Sci USA. 1996;93:6002–6007. doi: 10.1073/pnas.93.12.6002. [DOI] [PMC free article] [PubMed] [Google Scholar]
- 10.Grammas P, Hamdheydari L, Benaksas EJ, Mou S, Pye QN, Wechter WJ, Floyd RA, Stewart C, Hensley K. Anti-inflammatory effects of tocopherol metabolites. Biochem Biophys Res Commun. 2004;319:1047–1052. doi: 10.1016/j.bbrc.2004.05.082. [DOI] [PubMed] [Google Scholar]
- 11.Jiang Q, Elson-Schwab I, Courtemanche C, Ames BN. Gamma-tocopherol and its major metabolite, in contrast to alpha-tocopherol, inhibit cyclooxygenase activity in macrophages and epithelial cells. Proc Natl Acad Sci USA. 2000;97:11494–11499. doi: 10.1073/pnas.200357097. [DOI] [PMC free article] [PubMed] [Google Scholar]
- 12.Jiang Q, Ames BN. Gamma-tocopherol, but not alpha-tocopherol, decreases proinflammatory eicosanoids and inflammation damage in rats. FASEB J. 2003;17:816–822. doi: 10.1096/fj.02-0877com. [DOI] [PubMed] [Google Scholar]
- 13.Sontag TJ, Parker RS. Cytochrome P450 omega-hydroxylase pathway of tocopherol catabolism. Novel mechanism of regulation of vitamin E status. J Biol Chem. 2002;277:25290–25296. doi: 10.1074/jbc.M201466200. [DOI] [PubMed] [Google Scholar]
- 14.Parker RS, Sontag TJ, Swanson JE, McCormick CC. Discovery, characterization, and significance of the cytochrome P450 omega-hydroxylase pathway of vitamin E catabolism. Ann N Y Acad Sci. 2004;1031:13–21. doi: 10.1196/annals.1331.002. [DOI] [PubMed] [Google Scholar]
- 15.Birringer M, Pfluger P, Kluth D, Landes N, Brigelius-Flohe R. Identities and differences in the metabolism of tocotrienols and tocopherols in HepG2 cells. J Nutr. 2002;132:3113–3118. doi: 10.1093/jn/131.10.3113. [DOI] [PubMed] [Google Scholar]
- 16.Pope SA, Burtin GE, Clayton PT, Madge DJ, Muller DP. Synthesis and analysis of conjugates of the major vitamin E metabolite, alpha-CEHC. Free Radic Biol Med. 2002;33:807–817. doi: 10.1016/s0891-5849(02)00974-7. [DOI] [PubMed] [Google Scholar]
- 17.Leonard SW, Gumpricht E, Devereaux MW, Sokol RJ, Traber MG. Quantitation of rat liver vitamin E metabolites by LC-MS during high-dose vitamin E administration. J Lipid Res. 2005;46:1068–1075. doi: 10.1194/jlr.D400044-JLR200. [DOI] [PubMed] [Google Scholar]
- 18.Christen S, Jiang Q, Shigenaga MK, Ames BN. Analysis of plasma tocopherols alpha, gamma, and 5-nitro-gamma in rats with inflammation by HPLC coulometric detection. J Lipid Res. 2002;43:1978–1985. doi: 10.1194/jlr.d200023-jlr200. [DOI] [PubMed] [Google Scholar]
- 19.Sattler W, Mohr D, Stocker R. Rapid isolation of lipoproteins and assessment of their peroxidation by high-performance liquid chromatography postcolumn chemiluminescence. Methods Enzymol. 1994;233:469–489. doi: 10.1016/s0076-6879(94)33053-0. [DOI] [PubMed] [Google Scholar]
- 20.Burton GW, Webb A, Ingold KU. A mild, rapid, and efficient method of lipid extraction for use in determining vitamin E/lipid ratios. Lipids. 1985;20:29–39. doi: 10.1007/BF02534359. [DOI] [PubMed] [Google Scholar]
- 21.You CS, Sontag TJ, Swanson JE, Parker RS. Long-chain carboxychromanols are the major metabolites of tocopherols and tocotrienols in A549 lung epithelial cells but not HepG2 cells. J Nutr. 2005;135:227–232. doi: 10.1093/jn/135.2.227. [DOI] [PubMed] [Google Scholar]
- 22.Parker RS, Sontag TJ, Swanson JE. Cytochrome P4503A-dependent metabolism of tocopherols and inhibition by sesamin. Biochem Biophys Res Commun. 2000;277:531–534. doi: 10.1006/bbrc.2000.3706. [DOI] [PubMed] [Google Scholar]
- 23.Thaler F, Valsasina B, Baldi R, Xie J, Stewart A, Isacchi A, Kalisz HM, Rusconi L. A new approach to phosphoserine and phosphothreonine analysis in peptides and proteins: chemical modification, enrichment via solid-phase reversible binding, and analysis by mass spectrometry. Anal Bioanal Chem. 2003;376:366–373. doi: 10.1007/s00216-003-1919-9. [DOI] [PubMed] [Google Scholar]
- 24.Mustacich DJ, Leonard SW, Devereaux MW, Sokol RJ, Traber MG. Alpha-tocopherol regulation of hepatic cytochrome P450s and ABC transporters in rats. Free Radic Biol Med. 2006;41:1069–1078. doi: 10.1016/j.freeradbiomed.2006.06.022. [DOI] [PubMed] [Google Scholar]
- 25.Chapman E, Best MD, Hanson SR, Wong CH. Sulfotransferases: structure, mechanism, biological activity, inhibition, and synthetic utility. Angew Chem Int Ed Engl. 2004;43:3526–3548. doi: 10.1002/anie.200300631. [DOI] [PubMed] [Google Scholar]
- 26.Totta P, Acconcia F, Virgili F, Cassidy A, Weinberg PD, Rimbach G, Marino M. Daidzein-sulfate metabolites affect transcriptional and antiproliferative activities of estrogen receptor-beta in cultured human cancer cells. J Nutr. 2005;135:2687–2693. doi: 10.1093/jn/135.11.2687. [DOI] [PubMed] [Google Scholar]
- 27.Strott CA, Higashi Y. Cholesterol sulfate in human physiology: what’s it all about? J Lipid Res. 2003;44:1268–1278. doi: 10.1194/jlr.R300005-JLR200. [DOI] [PubMed] [Google Scholar]