Abstract
Most mammalian cell types, including endothelial cells, respond to cell swelling by activating a Cl− current termed ICl,swell, but it is not known how the physical stimulus of cell swelling is transferred to the channels underlying ICl,swell. We have investigated the precise relation between cell volume and ICl,swell in endothelial cells by performing whole-cell current recordings while continuously monitoring cell thickness (Tc) as a measure for cell volume. The time course of Tc was accurately predicted by a theoretical model that describes volume changes of patch-clamped cells in response to changes in the extracellular osmolality (OSMo). This model also predicts significant changes in intracellular ionic strength (Γi) when OSMo is altered. Under all experimental conditions ICl,swell closely followed the changes in Γi, whereas ICl,swell and cell volume were often found to change independently. These results do not support the hypothesis that Γi regulates the volume set point for activation of ICl,swell. Instead, they are in complete agreement with a model in which a decrease of Γi rather than an increase in cell volume is the initial trigger for activation of ICl,swell.
All living cells are programmed to activate a series of cellular processes to counter the harmful effects of cell swelling. One of the first detectable effects of cell swelling in most vertebrate cells is an increase in the plasma membrane permeability to anions, through the opening of anion channels (1). Although different types of swelling-activated anion currents have been functionally described, one phenotype seems to be predominant. This outwardly rectifying current, which under normal conditions is mainly carried by Cl−, has been termed ICl,swell for swelling-activated Cl− current, and the underlying channel has been termed VRAC for volume-regulated anion channel. The biophysical and pharmacological properties of ICl,swell/VRAC have been extensively studied (for recent reviews, see refs. 2–4), but the precise activation mechanism of ICl,swell is still not resolved. Particularly, it remains unclear how the cell “senses” changes in its volume and translates this physical stimulus into the opening of VRAC.
Hypotonicity-induced cell swelling is accompanied by a dilution of the intracellular medium, resulting in a decrease of Γi, the intracellular ionic strength. Interestingly, it was recently shown that Γi modulates ICl,swell, independent of the molecular nature of the intracellular ions. A model was proposed in which Γi regulates the volume set point for activation of VRAC, by modulating a putative “volume sensor” (5–7).
In the present study we tested this model by investigating the relation between cell volume, Γi, and ICl,swell in endothelial cells. To this end, we set up a combined system that enables the simultaneous measurement of whole-cell currents and cell thickness (Tc). A theoretical model was developed that accurately predicts the osmotically induced volume changes and the concomitant changes in Γi. We demonstrate that ICl,swell is tightly coupled to Γi but not to cell volume. Our present results are discussed in the framework of a model in which a decrease of Γi rather than an increase in cell volume is the initial trigger for activation of ICl,swell.
MATERIALS AND METHODS
We used single endothelial cells from an established cell line from calf pulmonary artery (cell line CPAE; American Type Culture Collection). Cells were grown in DMEM (Life Technologies/GIBCO) with 20% fetal calf serum, 2 mM l-glutamine, 100 mg⋅ml−1 streptomycin, and 100 mg⋅ml−1 penicillin and were seeded on gelatin-coated coverslips 2–4 days before use.
The standard isotonic extracellular solution contained (in mM) 150 NaCl, 6 KCl, 1 MgCl2, 1.5 CaCl2, 10 glucose, and 10 Hepes, pH 7.4 with NaOH (320 mOsm). During the experiments, cells were perfused with a solution containing (in mM) 85 NaCl, 6 CsCl, 1 MgCl2, 1.5 CaCl2, 10 glucose, 10 Hepes, pH 7.4 with NaOH, and the appropriate amount of mannitol to reach the indicated osmolality (between 200 and 400 mOsm). In most experiments, a pipette solution was used containing (in mM) 40 CsCl, 100 cesium aspartate, 1 MgCl2, 1.93 CaCl2, 5 EGTA, 4 Na2ATP, and 10 Hepes, pH 7.2 with CsOH (290 mOsm). The ionic strength of this pipette solution (Γp) is 155 mM. The concentration of free Ca2+ in this solution was buffered at 100 nM, which is below the threshold for activation of Ca2+-activated Cl− currents (8) but sufficient to fully activate ICl,swell (9) in CPAE cells. For pipette solutions with a different Γp, the concentration of cesium aspartate was either increased or decreased. When necessary, sucrose was added to obtain the desired osmolality. We have chosen to use extra- and intracellular solutions containing Cs+ salts instead of K+ salts to minimize the contribution of an inwardly rectifying K+ current present in these cells.
Currents were monitored with an EPC-7 (List Electronic, Lambrecht/Pfalz, Germany) patch-clamp amplifier. Patch electrodes had dc resistances between 2 and 6 MΩ. Whole-cell membrane currents were measured in ruptured patches. Currents were sampled at 2-ms intervals and filtered at 200 Hz. The following voltage protocol was applied every 15 s from a holding potential of −20 mV: a step to −80 mV for 0.6 s, followed by a step to −100 mV for 0.2 s and a 2.6-s linear voltage ramp to +100 mV. Time courses of the whole-cell current were obtained by averaging the current in a 10-mV window around +95 mV and normalizing to the cell membrane capacitance (Cm). Cm values were obtained by using the analog compensation circuitry of the EPC7 amplifier. Except when mentioned otherwise, time zero corresponds to the rupture of the membrane. Our experimental conditions were designed such that measured whole-cell currents represent almost exclusively currents through VRAC. Therefore, all whole-cell currents are denominated ICl,swell. Cells showing any indication of other membrane and/or leak currents (e.g., changes in reversal potential and/or current rectification) were discarded from analysis.
The Cell surface area (CSA) of single cells was quantified from digital images recorded with a video camera (model CF 6, Kappa, Gleichen, Germany). Cell borders were traced manually and the surface of the traced region was determined by using the ImageTool 1.25 software (University of Texas Health Science Center, San Antonio). CSA was calculated as the average of three independent tracing procedures.
Tc was monitored with a slightly modified version of the method described by Van Driessche et al. (10). Gelatin-coated coverslips containing nonconfluent CPAE cells were incubated for about 30 min with 4 μl/ml Red Neutravidin-labeled microbeads (F-8775, Molecular Probes), followed by a 15-min washing with microbead-free solution. The microbeads were visualized by using a Xenon lamp and the XF40/E filter set (Omega Optical, Brattleboro, VT), which consists of a broadband excitation filter (maximal at 560 nm) and a 600-nm long-pass emission filter. Fluorescent images at different vertical positions were recorded with the CF 6 video camera, digitized, and displayed on a video monitor. The controlled vertical displacement of the objective was achieved by using a low-voltage piezoelectric translator (PIFOC P-721; Physik Instrumente, Waldbronn, Germany). The vertical position of preselected beads was determined as the position at which the fluorescent light intensity was maximal (10). Tc was calculated as the vertical distance between beads on the gelatin surface and on the cell surface. Home-written software was used to control the piezoelectric translator and perform the on-line image analysis.
Numerical solutions for the differential equations that describe changes in cell volume and Γi were generated by using the mathcad plus 6.0 software (Mathsoft, Cambridge, MA). The origin 5.0 software (Microcal Software, Northampton, MA) was used for statistical analysis and graphical presentation of the data. Whenever possible, a single experiment is shown representative of at least four similar experiments. Pooled data are given as mean ± SEM from n experiments.
RESULTS
The first aim of this work was to establish a system for measuring changes in endothelial cell volume during whole-cell patch-clamp measurements. In previous reports showing volume changes in patch-clamped cells, cell volume was mostly estimated from measurements of the cell diameter or cell surface area by using off-line image analyzing techniques (11–13). However, such volume measurements are restricted to cells with a simple spherical or cylindrical morphology and cannot be applied to flat cells such as endothelial cells. Here, we have combined the whole-cell patch-clamp technique with an optical method that monitors changes in cell thickness Tc by using fluorescent beads (10). This method combines an accuracy of <100 nm with a sampling rate of about 0.2 Hz. In comparison with the above-mentioned methods, it has the additional advantage that it enables on-line monitoring of cell volume.
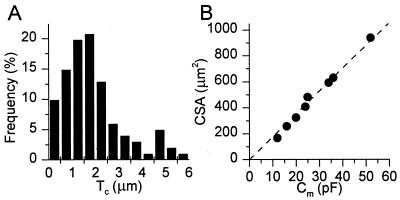
Fig. 1A shows a histogram of Tc values of single CPAE cells under isotonic conditions. Assuming a random distribution of the fluorescent beads over the whole cell surface, we obtain an average cell thickness of 1.86 ± 0.13 μm (n = 101). Tc values >3.5 μm were obtained exclusively from the region of the nucleus. Measurements of the cell surface area (CSA) of CPAE cells yielded an average value of 584 ± 63 μm2 (n = 12). Therefore, we estimate the average cell volume of a CPAE cell to be around 1 pl. The average cell membrane capacitance (Cm) in this study was 32.5 ± 2.2 pF (n = 62). As shown in Fig. 1B, CSA correlated very well (r = 0.996) with Cm. From the linear fit we obtain that CSA (μm2) = 17.6⋅Cm (pF). Given a specific membrane capacitance of ≈1 pF per 100 μm2 (14), it follows that, depending on the contribution of the basal membrane to Cm, CSA measurements underestimate total membrane area by a factor of 3–6. This probably indicates a high level of membrane folding in CPAE cells.
Figure 1.
Dimensions of CPAE cells. (A) Histogram of Tc values of nondialyzed CPAE cells in isotonic solution. Pooled data from 101 Tc determinations on 76 cells. (B) Correlation between CSA and Cm for eight whole-cell patch-clamped cells. The broken line represents the best linear fit, with a slope of 17.6 μm2/pF (r = 0.996). Note that these cells cover the whole range of CSA and Cm values observed in this study.
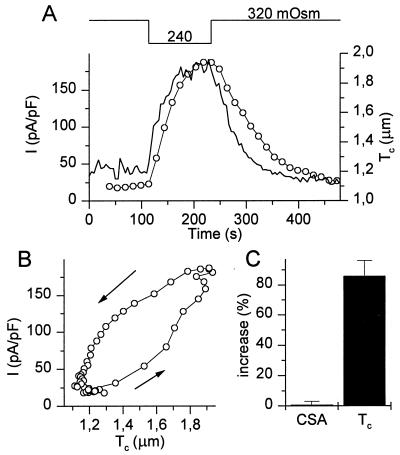
Fig. 2A shows a typical example of a simultaneous measurement of Tc and whole-cell current in a CPAE cell. Reducing the extracellular osmolality (OSMo) from 320 to 240 mOsm causes a rapid increase in Tc and the activation of an outward current, identified as ICl,swell. Both cell swelling and activation of ICl,swell were fully reversible. Fig. 2B shows the relation between Tc and ICl,swell for the experiment in Fig. 2A. The hysteresis between ICl,swell and Tc indicates that cell swelling and cell shrinking precede activation and deactivation of the current. To establish a relation between Tc and cell volume, we measured the relative increase of Tc and CSA after decreasing OSMo from 320 to 240 mOsm for 200 s. Fig. 2C shows that this maneuver induces an almost doubling of Tc without significantly changing CSA. Moreover, the relative increases in Tc measured at various spots on the cell surface were not significantly different (not shown). We can therefore conclude that Tc is a good measure of cell volume.
Figure 2.
Simultaneous measurement of Tc and whole-cell currents. (A) Changes in Tc (solid line) and whole-cell currents (circles) induced by the indicated changes in OSMo. The whole-cell current was identified as ICl,swell. (B) Correlation between Tc and ICl,swell during the experiment shown in A. (C) Average increase in CSA and Tc in dialyzed cells (n = 8) after 200 s in hypotonic solution (240 mOsm).
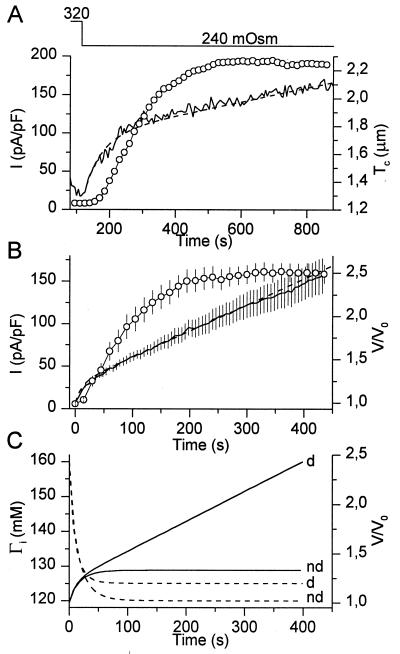
To further establish the relation between ICl,swell and cell volume, we performed experiments whereby ICl,swell and Tc were measured during prolonged hypotonic shocks. As illustrated in Fig. 3A, the increase in Tc during such a hypotonic challenge is biphasic, with a rapid initial swelling followed by a slower but persistent swelling. CPAE cells tolerated increases in Tc to ≈3 times the initial value before cell bursting occurred. We consistently observed that ICl,swell reached a plateau value, in spite of the fact that V/V0 continued to increase (Fig. 3B). This could indicate either that ICl,swell saturates at a level where all VRAC channels in the plasma membrane are activated, such that further swelling can no longer increase ICl,swell, or that some other parameter secondary to changes in cell volume triggers the activation of ICl,swell. What follows is an attempt to discriminate between these two possibilities.
Figure 3.
Changes in Tc and ICl,swell during a prolonged reduction of OSMo. (A) Changes in Tc (solid line) and ICl,swell (circles) as OSMo was lowered from 320 to 240 mOsm. (B) Average current density (circles) and relative volume V/V0 (solid line) during a 450-s reduction of OSM0 from 320 to 240 mOsm (n = 10). The broken line in A and B represents the best fit of the model. In this panel, time 0 corresponds to the time at which OSMo was reduced. (C) Model prediction of V/V0 (solid lines) and Γi (broken lines) for dialyzed (d) and nondialyzed (nd) cells.
We propose a simple mathematical model to predict changes in cell volume (V) and in intracellular ionic strength (Γi) when the extracellular solution and the intracellular pipette solution have a different osmolality. First, we assume that there is no pressure built up in a cell. This assumption is supported by the finding that CPAE cells that are not intracellularly dialyzed behave almost as perfect osmometers (15). This first assumption also implies that there is neither a pressure difference nor net water flux between pipette and cell. Additionally, we assume that the net flux of solutes across the plasma membrane is negligible compared with the exchange of solutes between pipette and cytosol. To achieve this, cells were held at a potential close to the reversal potential of ICl,swell (≈−20 mV under the ionic conditions used). Hence, changes in V equal the net influx or efflux of water across the plasma membrane (Jm), which is linearly dependent on the transmembrane osmotic gradient:
 |
1 |
where OSMi is the osmolality of the intracellular medium, Pf is the osmotic water permeability of the membrane, S is the cell membrane surface, and Vw is the partial molar volume of water (1.8⋅10−5 m3⋅mol−1). Osmolality can be estimated as the total concentration of solutes multiplied by the osmotic coefficient φ (≈0.93 for the osmolytes used). For simplicity, we also assume that the diffusion rate from the pipette into the cell is the same for all solute species in the pipette. Therefore, we use Ci and Cp as the global concentration of solutes in the cell and in the pipette, respectively. Ci changes due to solute exchange with the pipette and due to variations in the cell volume:
 |
2 |
where kd is a constant (m3/s) describing the rate of the diffusion of solutes from pipette to cell. The model essentially consists of two differential equations with two variables, Ci and V, and two unknown constants, Pf and kd. We used home-written software employing a Stoer–Bullirsch algorithm (16) to numerically solve the differential equations for each set of values for Pf and kd. A simplex method was used to determine the values of Pf and kd that gave the best fit to the experimental volume measurements. Examples of such fits are shown in Fig. 3 A and B, from which we obtained average values for Pf and kd of 2.53⋅10−5 m/s and 1.94⋅10−17 m3/s. The Pf value agrees very well with the value of 3⋅10−5 m/s, obtained from transmembrane fluxes of tritiated H2O in calf pulmonary endothelial cells (17). For a cell with a volume of 1 pl the obtained kd value corresponds to a diffusion time constant of 51.5 s. This is well in agreement with experimentally obtained time constants for the diffusion of solutes such as Fura-2, Ca2+, or Cs+ from the pipette into CPAE cells, which were found to range from 30 to 120 s. The above-mentioned constants were subsequently used to predict changes in V and Ci (or Γi) during osmotic challenges. Interestingly, the model predicts that Γi decreases significantly during an osmotic challenge and, like ICl,swell, reaches a plateau value, in spite of the continuous increase in V (Fig. 3C). Note that the decrease in Γi is even more pronounced in nondialyzed cells (Fig. 3C).
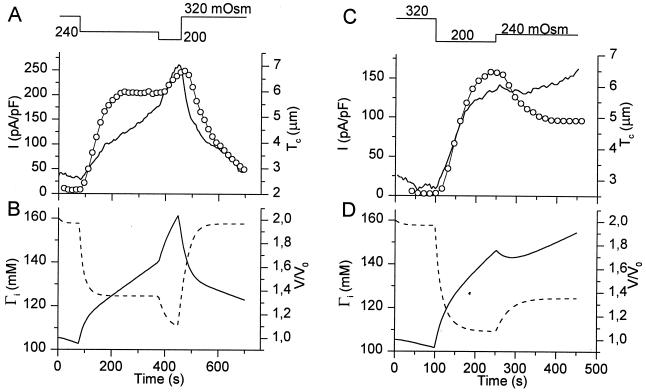
To further evaluate the relations between V, Γi, and ICl,swell, we have simultaneously measured Tc and ICl,swell in cells that were subjected to stepwise changes in extracellular osmolality, and we compared the experimental data with the model predictions of V and Γi. The experiment shown in Fig. 4A nicely illustrates how ICl,swell reaches a plateau during exposure to a 240-mOsm solution, in spite of the continuous increase in Tc. A subsequent decrease of the extracellular osmolality to 200 mOsm causes a higher rate of increase in Tc and a further increase of ICl,swell. The model predictions for Tc and Γi for this experiment are shown in Fig. 4B. It can be seen that the predicted values of V are in good agreement with the changes in Tc, whereas the predicted values of Γi closely mirror ICl,swell. This experiment also shows that the plateau level of ICl,swell during the 240-mOsm stimulus cannot be attributed to a saturated activation of all VRAC channels. Fig. 4C shows an experiment in which ICl,swell reaches a plateau value during exposure to a 200-mOsm solution. A subsequent increase in the extracellular osmolality to 240 mOsm causes only a transient decrease in Tc but a permanent decrease of ICl,swell to a lower plateau value. Again, the model accurately predicts the changes in V, and Γi closely mirrors ICl,swell (Fig. 4D).
Figure 4.
Comparison of experimental data of Tc and ICl,swell with model predictions of V/V0 and Γi during stepwise changes in OSMo. (A) Tc (solid line) and ICl,swell (circles) as OSMo is stepped first to 240 mOsm and thereafter to 200 mOsm. (B) Model prediction of cell volume (solid line) and Γi (broken line) for the experiment shown in A. (C) Tc (solid line) and ICl,swell (circles) as OSMo is stepped first to 200 mOsm and thereafter to 240 mOsm. (D) Same as B for the experiment shown in C.
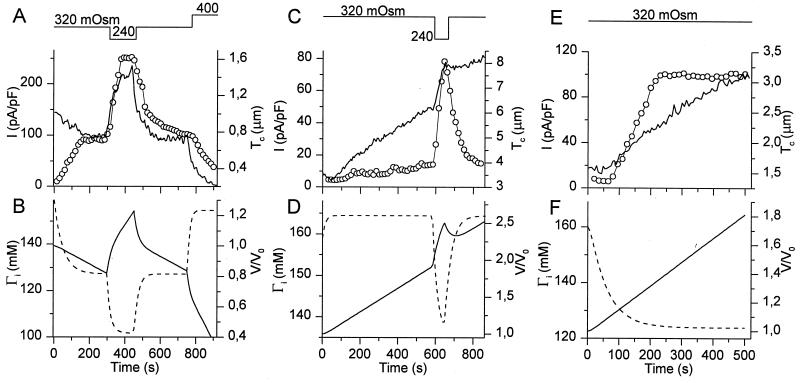
As the above experiments indicate that ICl,swell follows the decrease in Γi, we measured ICl,swell and Tc in cells where Γi was directly reduced by dialysis with a pipette solution of low salt content but normal osmolality (Γp = 125 mM; 290 mOsm). As shown in Fig. 5A, such a maneuver activates ICl,swell in spite of a slight decrease in Tc. A subsequent decrease in extracellular osmolality causes an increase in Tc and a further increase in ICl,swell. Finally, ICl,swell was fully deactivated by using a hypertonic extracellular solution, which is expected to increase Γi to basal levels (Fig. 5B). Fig. 5C shows an experiment where Γi was increased by using a pipette solution with a high salt content (Γp = 195 mM; 365 mOsm). This hypertonic pipette solution induces cell swelling but does not significantly activate ICl,swell. A short reduction of OSMo to 240 mOsm is still able to activate ICl,swell. As shown in Fig. 5D, the model accurately predicts the volume changes, whereas ICl,swell nicely mirrors Γi. It has to be noted that in 4 of 9 experiments using high-salt pipette solutions, ICl,swell was transiently activated but then returned to basal levels. In contrast, ICl,swell was consistently activated in cells dialyzed with a pipette solution that was made hypertonic by addition of sucrose (Γp = 155 mM; 365 mOsm) (Fig. 5E). In these cells, a significant reduction in Γi is expected (Fig. 5F).
Figure 5.
Tc and ICl,swell in cells dialyzed with pipette solutions with altered osmolality and/or salt content. (A) Activation of ICl,swell (circles) without any increase in Tc (solid line) in a cell dialyzed with a low-salt pipette solution (Γp = 125 mM; 290 mOsm), further activation of ICl,swell by reducing OSMo to 240 mOsm and inactivation of ICl,swell by increasing OSMo to 400 mOsm. (B) Model prediction of V/V0 (solid line) and Γi (broken line) for the experiment shown in A. (C) Increase in Tc (solid line) without significant activation of ICl,swell (circles) in a cell dialyzed with a high-salt pipette solution (Γp = 195 mM; 365 mOsm). Reducing OSMo to 240 mOsm causes further cell swelling and activation of ICl,swell. (D) Same as B for the experiment shown in C. (E) Increase in Tc (solid line) and activation of ICl,swell (circles) in a cell dialyzed with a hypertonic pipette solution with normal salt content (Γp = 155 mM; 365 mOsm). (F) Same as B for the experiment shown in E.
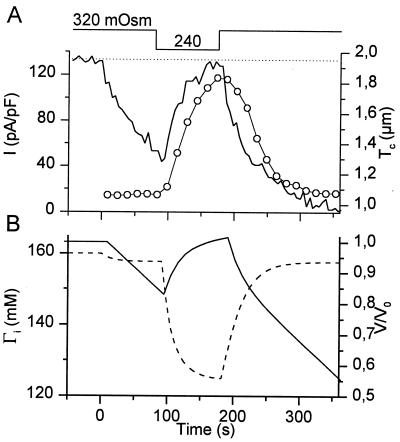
An alternative way to affect the volume of whole-cell patch-clamped cells is to apply pressure to the patch pipette. Our attempts to measure whole-cell currents while inducing cell swelling by application of positive pressure were, however, unsuccessful, as this approach most often resulted in activation of nonselective leaks and/or loss of the whole-cell configuration. In contrast, persistent application of a negative pressure to the patch-pipette was generally well tolerated by the endothelial cells. As illustrated in Fig. 6A, such a maneuver induced extensive shrinkage of the cells without affecting the activation of ICl,swell by a reduction of OSMo. Under this condition, the model assumption of no net flux of water between cell and pipette is no longer valid. We have therefore introduced the parameter Jp, the net flux of solution from the cell to the pipette, yielding the following modifications to Eqs. 1 and 2:
 |
3 |
and
 |
4 |
As we have no means to quantify Jp, we performed model simulations with Jp ranging from 0 to 5⋅10−21 m3/s (= 5 fl/s) and evaluated the effect of Jp on V and Γi. It was found that Jp, while strongly affecting V, has little effect on the time course of Γi and no effect on steady-state Γi. For the simulation shown in Fig. 6B, we used a value for Jp of 2⋅10−21 m3/s, which yielded a time course for V comparable with the experimental data in Fig. 6A. Again, activation and deactivation of ICl,swell nicely follow the changes in Γi, whereas cell volume remains below the resting value during the whole experiment.
Figure 6.
Application of negative pressure to the patch pipette does not affect activation of ICl,swell. (A) After break-in (time 0), a constant negative pressure was applied on the patch pipette, causing extensive shrinkage of the cell. Reducing OSMo to 240 mOsm causes an increase of Tc (solid line) to levels that remain below the resting Tc (indicated by the broken line). Neither activation nor deactivation of ICl,swell (circles) is affected by the negative pressure. (B) Model prediction of V/Vo (solid line) and Γi (broken line) for the experiment shown in A.
DISCUSSION
A swelling-activated, outwardly rectifying anion current termed ICl,swell has been detected in a wide range of vertebrate cell types, and its biophysical and pharamacological properties have been thoroughly described (for recent reviews, see refs. 2–4). It remains, however, obscure how the cell couples cell swelling to the opening of VRAC, the underlying volume-regulated anion channel. Several authors have proposed a mechanism whereby changes in cell volume are detected by a putative “volume sensor,” which directly or indirectly regulates the opening of VRAC. A change in Γi was supposed to alter the properties of this “volume sensor,” such that, at lower Γi, smaller increases in cell volume are sufficient to activate ICl,swell (5–7, 18). On the basis of our present results, we argue against such a mechanism in endothelial cells. First, all maneuvers that cause a reduction in Γi were found sufficient to activate ICl,swell, even when cell volume was at or far below the resting volume (Figs. 5A and 6), whereas cell swelling up to 200% of the initial volume did not activate ICl,swell at constant Γi (Fig. 5C). Second, once activated, ICl,swell was not sensitive to changes in cell volume but remained modulated by Γi (Figs. 3 and 4). Finally, in all experiments the time course of ICl,swell almost perfectly mirrored the time course of Γi, whereas such a correlation between ICl,swell and cell volume did not exist. We therefore propose a model in which the swelling-induced decrease in Γi, and not cell swelling itself, is the pivotal signal that regulates the opening of VRAC under anisosmotic conditions.
In accordance with this conclusion is a recent paper by Guizouarn and Motais (19) on swelling-activated transport pathways in trout erythrocytes. These authors show that fish erythrocytes can activate two distinct transport pathways in response to cell swelling: a channel of broad specificity with properties reminiscent of VRAC, and a K+–Cl− cotransporter. Whereas the K+–Cl− cotransporter seemed to be activated by the cell swelling itself, the VRAC-like channel was activated only when cell swelling was accompanied by a reduction of the intracellular ionic strength. In contrast, two recent studies proposed that VRAC activation is triggered by cell swelling as such, and not by a swelling-induced reduction in Γi (6, 7). Two arguments were used to support this conclusion. First, both studies state that in the whole-cell patch-clamp mode Γi is unlikely to change during water influx and cell swelling, because of the constant dialysis from the patch-pipette solution. We have, however, disproved this argument by showing experiments in which Γi deviates from Γp by up to 45 mM (≈30%). Second, Cannon et al. (7) reported activation of ICl,swell in CHO cells under conditions of apparently constant Γi, after the application of positive pressure to the patch pipette, in line with observations in other cell types (20–22). In contrast, we found no activation of ICl,swell after a >100% increase in cell volume under conditions of constant Γi (Fig. 5C). Several explanations can be given to explain this discrepancy. First, in most studies the osmolality of the pipette solution is lower than the osmolality of the “isotonic” bath solution. This leads to a constant efflux of water from the cytoplasm. According to our present data, the dialysis by the pipette solution may be too slow to compensate for this efflux, resulting in a Γi higher than Γp. Consequent application of positive pressure to the patch pipette leads to a faster dialysis of the pipette solution, causing a decrease in Γi which might be sufficient to activate ICl,swell in some cell types. Second, application of positive pressure to the cytoplasm may directly activate stretch-sensitive (anion) conductances, which may superficially resemble ICl,swell (23, 24). Third, although many of the properties of ICl,swell are similar in a wide range of mammalian cells, there seem to be important differences in the regulation of the current by intracellular pathways (for recent reviews, see refs. 2–4). Particularly, swelling-induced rearrangements of cytoskeletal elements regulate the opening of VRAC in some cell types (25–27), whereas a complete disruption of the cytoskeleton did not affect activation of ICl,swell in endothelial cells (28).
Okada (2) recently postulated that membrane unfolding would be a necessary step in the activation of VRAC. Membrane unfolding is indeed likely to occur during swelling of endothelial cells, given the high level of membrane folding that we estimated. However, the finding that reducing Γi per se activates VRAC without any cell swelling (see also ref. 7) argues against a critical role for such membrane unfolding. Similarly, intracellular γ-thio-GTP was found to activate ICl,swell without inducing changes in cell volume (T.V., unpublished observation).
It is important to note that nondialyzed cells swell to a much lesser extent than dialyzed cells when OSMo is reduced, whereas the concomitant drop in Γi is more pronounced (Fig. 3C). Therefore, smaller decreases in OSMo are expected to open VRAC under in vivo conditions. This explains why flux measurements in endothelial cells revealed significant activation of VRAC after reduction of OSMo by only 7% (29), whereas the same reduction of OSMo is mostly without effect in whole-cell patch-clamped cells (our unpublished results).
It remains unclear how Γi regulates VRAC, the channel underlying ICl,swell. A direct effect of Γi on VRAC seems unlikely, as activation of the current by lowered Γi remains dependent on protein tyrosine kinase activity (6, 30). We favor the idea that Γi acts similar to a second messenger, and directly or indirectly regulates the activity of the intracellular enzyme(s) that mediate the activation of ICl,swell. It will be of great interest to determine whether src-like tyrosine kinases such as p56lck, which directly activates ICl,swell in lymphocytes (31), or small G proteins such as p21rho, which is required for the activation of ICl,swell in intestine 407 cells (27), are directly influenced by Γi.
Acknowledgments
We thank Drs. W. Van Driessche and P. De Smet for helpful comments during development of the method for combined patch-clamp and volume monitoring. T.V. and J.E. are, respectively, Postdoctoral Researcher and Research Associate of the Flemish Fund for Scientific Research. This work was supported by grants from the Federal Belgian State (Interuniversity Pole of Attraction 3P4/23) and the Flemish Government (Flemish Fund for Scientific Research G.0237.95, C.O.F./96/22-A0659 to B.N.).
ABBREVIATIONS
- ICl,swell
swelling-activated Cl− current
- Tc
cell thickness
- OSMo extracellular osmolality
Γi, intracellular ionic strength
- Γp
ionic strength of the pipette solution
- VRAC
volume-regulated anion channel
- CSA
cell surface area
- Cm
membrane capacitance
Footnotes
This paper was submitted directly (Track II) to the Proceedings Office.
References
- 1.McManus M L, Churchwell K B, Strange K. N Engl J Med. 1995;333:1260–1266. doi: 10.1056/NEJM199511093331906. [DOI] [PubMed] [Google Scholar]
- 2.Okada Y. Am J Physiol. 1997;273:C755–C789. doi: 10.1152/ajpcell.1997.273.3.C755. [DOI] [PubMed] [Google Scholar]
- 3.Nilius B, Eggermont J, Voets T, Buyse G, Manolopoulos V, Droogmans G. Prog Biophys Mol Biol. 1997;68:69–119. doi: 10.1016/s0079-6107(97)00021-7. [DOI] [PubMed] [Google Scholar]
- 4.Strange K, Emma F, Jackson P S. Am J Physiol. 1996;270:C711–C730. doi: 10.1152/ajpcell.1996.270.3.C711. [DOI] [PubMed] [Google Scholar]
- 5.Emma F, McManus M, Strange K. Am J Physiol. 1997;272:C1766–C1775. doi: 10.1152/ajpcell.1997.272.6.C1766. [DOI] [PubMed] [Google Scholar]
- 6.Nilius B, Prenen J, Voets T, Eggermont J, Droogmans G. J Physiol (London) 1998;506:353–361. doi: 10.1111/j.1469-7793.1998.353bw.x. [DOI] [PMC free article] [PubMed] [Google Scholar]
- 7.Cannon C L, Basavappa S, Strange K. Am J Physiol. 1998;275:C416–C422. doi: 10.1152/ajpcell.1998.275.2.C416. [DOI] [PubMed] [Google Scholar]
- 8.Nilius B, Prenen J, Szücs G, Wei L, Tanzi F, Voets T, Droogmans G. J Physiol (London) 1997;497:95–107. doi: 10.1113/jphysiol.1997.sp021865. [DOI] [PMC free article] [PubMed] [Google Scholar]
- 9.Szücs G, Heinke S, Droogmans G, Nilius B. Pflügers Arch. 1996;431:467–469. doi: 10.1007/BF02207289. [DOI] [PubMed] [Google Scholar]
- 10.Van Driessche W, De Smet P, Raskin G. Pflügers Arch. 1993;425:164–171. doi: 10.1007/BF00374517. [DOI] [PubMed] [Google Scholar]
- 11.Ross P E, Garber S S, Cahalan M D. Biophys J. 1994;66:169–178. doi: 10.1016/S0006-3495(94)80754-4. [DOI] [PMC free article] [PubMed] [Google Scholar]
- 12.Jackson P S, Churchwell K, Ballatori N, Boyer J L, Strange K. Am J Physiol. 1996;270:C57–C66. doi: 10.1152/ajpcell.1996.270.1.C57. [DOI] [PubMed] [Google Scholar]
- 13.Miwa A, Ueda K, Okada Y. J Membr Biol. 1997;157:63–69. doi: 10.1007/s002329900216. [DOI] [PubMed] [Google Scholar]
- 14.Hille B. Ionic Channels of Excitable Membranes. Sunderland, MA: Sinauer; 1992. [Google Scholar]
- 15.Heinke S, Raskin G, De Smet P, Droogmans G, Van Driessche W, Nilius B. Cell Physiol Biochem. 1997;7:19–24. [Google Scholar]
- 16.Bloch R. Comput Biomed Res. 1991;24:420–428. doi: 10.1016/0010-4809(91)90017-q. [DOI] [PubMed] [Google Scholar]
- 17.Schnitzer J E, Oh P. Am J Physiol. 1996;270:H416–H422. doi: 10.1152/ajpheart.1996.270.1.H416. [DOI] [PubMed] [Google Scholar]
- 18.Motais R, Guizouarn H, Garcia Romeu F. Biochim Biophys Acta. 1991;1075:169–180. doi: 10.1016/0304-4165(91)90248-f. [DOI] [PubMed] [Google Scholar]
- 19.Guizouarn H, Motais R. Am J Physiol. 1999;276:C210–C220. doi: 10.1152/ajpcell.1999.276.1.C210. [DOI] [PubMed] [Google Scholar]
- 20.Doroshenko P, Neher E. J Physiol (London) 1992;449:197–218. doi: 10.1113/jphysiol.1992.sp019082. [DOI] [PMC free article] [PubMed] [Google Scholar]
- 21.Lewis R S, Ross P E, Cahalan M D. J Gen Physiol. 1993;101:801–826. doi: 10.1085/jgp.101.6.801. [DOI] [PMC free article] [PubMed] [Google Scholar]
- 22.Doroshenko P. J Physiol (London) 1999;514:437–446. doi: 10.1111/j.1469-7793.1999.437ae.x. [DOI] [PMC free article] [PubMed] [Google Scholar]
- 23.Marchenko S M, Sage S O. J Physiol (London) 1997;498:419–425. doi: 10.1113/jphysiol.1997.sp021868. [DOI] [PMC free article] [PubMed] [Google Scholar]
- 24.Sato R, Koumi S. J Membr Biol. 1998;163:67–76. doi: 10.1007/s002329900371. [DOI] [PubMed] [Google Scholar]
- 25.Levitan I, Almonte C, Mollard P, Garber S S. J Membr Biol. 1995;147:283–294. doi: 10.1007/BF00234526. [DOI] [PubMed] [Google Scholar]
- 26.Cornet M, Ubl J, Kolb H A. J Membr Biol. 1993;133:161–170. doi: 10.1007/BF00233796. [DOI] [PubMed] [Google Scholar]
- 27.Tilly B C, Edixhoven M J, Tertoolen L G J, Morii N, Saitoh Y, Narumiya S, deJonge H R. Mol Biol Cell. 1996;7:1419–1427. doi: 10.1091/mbc.7.9.1419. [DOI] [PMC free article] [PubMed] [Google Scholar]
- 28.Oike M, Schwarz G, Sehrer J, Jost M, Gerke V, Weber K, Droogmans G, Nilius B. Pflügers Arch. 1994;428:569–576. doi: 10.1007/BF00374579. [DOI] [PubMed] [Google Scholar]
- 29.Manolopoulos V, Voets T, Declerq P, Droogmans G, Nilius B. Am J Physiol. 1997;273:C214–C222. doi: 10.1152/ajpcell.1997.273.1.C214. [DOI] [PubMed] [Google Scholar]
- 30.Voets T, Manolopoulos V, Eggermont J, Ellory C, Droogmans G, Nilius B. J Physiol (London) 1998;506:341–352. doi: 10.1111/j.1469-7793.1998.341bw.x. [DOI] [PMC free article] [PubMed] [Google Scholar]
- 31.Lepple-Wienhues A, Szabo I, Laun T, Kaba N K, Gulbins E, Lang F. J Cell Biol. 1998;141:282–286. doi: 10.1083/jcb.141.1.281. [DOI] [PMC free article] [PubMed] [Google Scholar]


