Abstract
Many systems in medicine, biology, high-energy physics, and astrophysics require large area radiation sensors. In most of these applications, minimizing the amount of dead area or dead material is crucial. We have developed a new type of silicon radiation sensor in which the device is active to within a few microns of the mechanical edge. Their perimeter is made by a plasma etcher rather than a diamond saw. Their edges can be defined and also passivated by growing, in an intermediate step, a field oxide on the side surfaces. In this paper, the basic architecture and results from a synchrotron beam test are presented.
Keywords: Active edge, 3D, Silicon radiation sensors, Silicon radiation detectors
1. Introduction
Silicon radiation sensors are used extensively in many fields of research as well as industry. In most, the electrodes form thin layers on the top and bottom surfaces. A new type, employing a new fabrication technology, in which the three-dimensional (3D) electrodes form a 3D array, not confined to the surfaces, has been described in a series of papers giving their design, fabrication, and unique properties [1-9].
This paper initiates another series, in which additional new features are added, providing sensors with one or more edges that are turned into a 3D border electrode. The electrode is made from the surfaces exposed by etching a trench around the appropriate sensor edges. These structures can reduce the width of the insensitive border region, which ranges from about 100 μm to more than 1 mm, by two to three orders of magnitude, with an insensitive region of several microns or less. (One paper of the original series [6] presented some of the technology that was planned, and two IEEE–Nuclear Science Symposium talks [10] discuss the remainder.)
Fig. 1 shows several reasons why sensors made with standard planar technology have border dead areas. Such near-edge sensitivity is important because many applications require the coverage of areas that are much larger than the area of a single sensor. For example, use of tiled or overlapping sensors with inactive border regions for X-rays leads to insensitive or shadowed bands at their boundaries. Even in fields such as particle physics, with penetrating particles, minimizing the total amount of material in a detector can be important as this reduces the loss of information caused by multiple scattering and inelastic interactions and also allows sensitivity close to an otherwise forbidden region such as the near-vicinity of an accelerator beam [11]. Other applications in which X-rays impinge on a sensor edge also could benefit by the absence of insensitive edges, which would reduce the quantum efficiency [12,13].
Fig. 1.
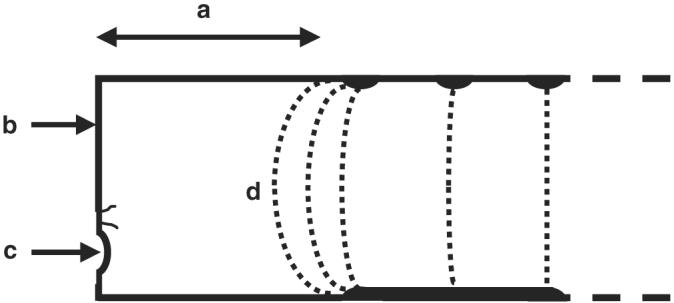
Schematic cross-section view of a standard sensor edge, showing some reasons for the insensitive region there: (a) space may be needed for guard and voltage-dropping rings, (b) the saw-cut edges are conducting, and (c) often contain chips or small cracks, all of which must remain clear of (d), the bulge of the edge of the electric field in the depleted region (from IEEE Trans. Nucl. Sci. NS-46 (1999) 1231).
2. Sensor types and fabrication
Several types of sensors have been made with active edges:
-
(1)
Full 3D-active edge: the interior electrodes are also 3D ones. They will be described in a separate paper. Fig. 2a shows a schematic example of one, including dopant diffused from the electrodes into the single crystal silicon. Another possibility besides the interchange of p and n dopants, and the two possibilities of bulk type, making four types, is to replace the edge poly with an oxide layer, so making eight possibilities. (This would normally add an extra mask step.)
-
(2)
Planar/3D-active edge: doped edge and bottom, diode junction at edges and bottom, interior electrodes in a plane on the top side. Fig. 2b shows one with n+ top signal electrodes, n−− bulk, and p+ bottom and sides. Another possibility is a p+ top, p−− bulk, and n+ bottom and sides.
-
(3)
Planar/3D-active edge: doped edge and bottom, planar diode junction at top-side electrodes. Fig. 2c shows one with n+ top signal electrodes, p−− bulk, and p+ bottom and sides. Another possibility is p+ top, n−− bulk, and n+ bottom and sides. Type 3 is not as easy to deplete fully with similarly low bias voltages, particularly at the bottom corners.
-
(4)
Planar/3D-active edge, doped bottom, no doping at oxide edge. These will be similar to Figs. 2b and c, with only a light n− layer, induced by the positive charge at the oxide–silicon boundary.
Fig. 2.
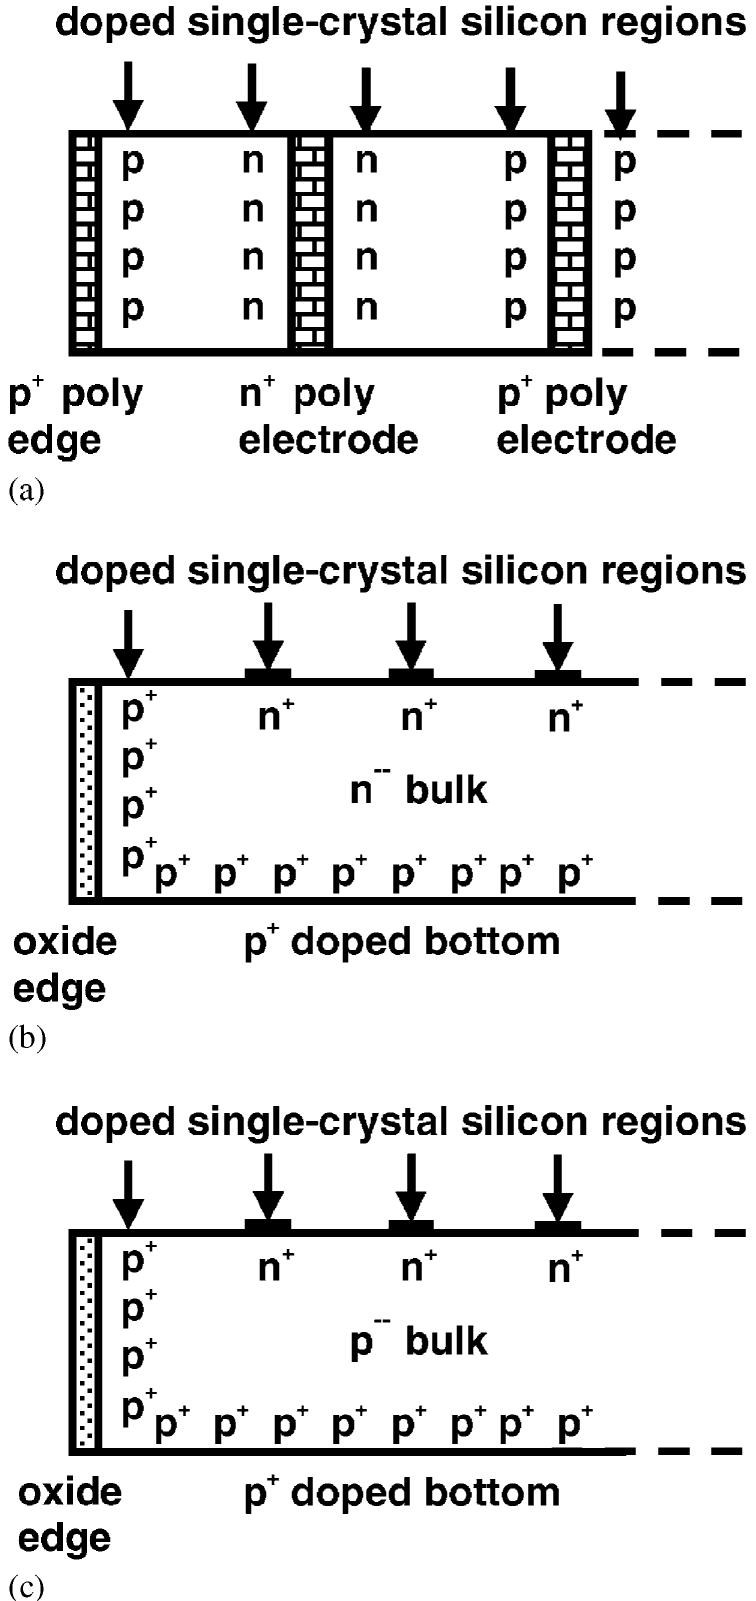
(a) Full 3D-active edge (alternate: interchange p, n). (b) Planar/3D-active edge (alternate: interchange p, n). (b) Same as 2b, but the junction is at the top electrodes.
Type 1 would usually be chosen if extreme radiation hardness was required, and 2−4 if ease of fabrication or the absence of the small dead regions in the 3D electrodes were important.
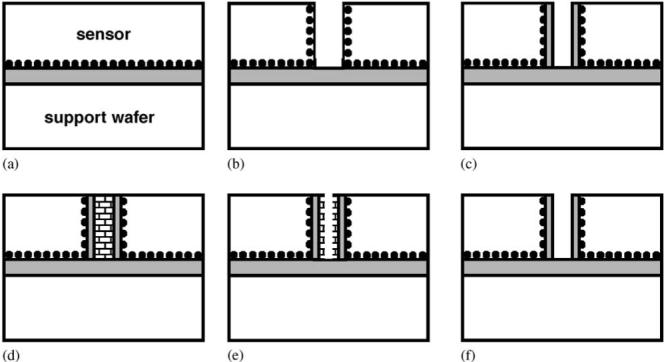
The active edge fabrication steps are sketched for types 2 and 3 in Fig. 3. The use of a plasma etch to establish the edges of radiation sensors can be extended to other materials besides silicon such as germanium, diamond, and compound semiconductors.
Fig. 3.
-
(a)implant bottom of sensor (dots), oxide bond to support wafer;
-
(b)active edge etch with side wall protection steps; dope active edge border trench;
-
(c)side-wall thermal oxide;
-
(d)fill trench with polycrystalline silicon to provide level surface for following steps;
-
(e)dicing etch with side wall protection on after sensor fabrication steps are finished Note: photoresist keeps etch away from edge where it might damage the sensor;
-
(f)turn off side wall protection (photoresist still protects sensor), isotropic etch to self-aligned stop at thermal oxide;
-
(g)(not shown) a temporary support wafer is attached to the top of sensor wafer with photoresist, the assembly is placed upside down in a plasma etcher, the support wafer is etched off, and the photoresist is dissolved with acetone, freeing the sensors.
3. Tests
Types 1 and 2 have been tested in accelerator beams. Type 1 was tested in 2003 in the 120 GeV X5 muon beam at CERN. Results from that test will be published separately. Type 2 has been tested with an X-ray microbeam at the Lawrence Berkeley Lab Advanced Light Source. Results will be described below. Results of the calculations of equipotentials for this type will be described in Section 4. Type 3 has also been fabricated. A 100-μm strip pitch sensor of type 4 was tested with an infra-red microbeam. The insensitive edge width, measured to an accuracy of ±5 μm, was similar to those of the other types of devices, and was compatible with the thickness of the oxide edge layer, shown in Figs. 3c–f, of somewhat less than 1 μm.
The infrared microbeam was made by placing a Hewlett-Packard HFBR-1404 infrared light-emitting diode on the center of the eyepiece of the Mitutoyo microscope on our Alessi probe station, and projecting the light onto a moveable stage with ±2 μm readout which held the sensor. The light-emitting diode had a wavelength of 820 nm, and a penetration depth of about 14 μm in silicon.
The Lawrence Berkeley Laboratory Advanced Light Source beam line 10.3.1, had a 12.4 keV X-ray microbeam with an energy passband of 6% and a width of 6 μm. Fig. 4 shows results from one of the wire scans that were used to measure the beam size. The wire diameter of 20 μm was much larger than both the beam size and the X-ray absorption length, so the scan distance to block the beam from a following sensor gives the beam size. It was made of tungsten (for strength) plated with gold (for surface smoothness) and was scanned across the beam in 0.2 μm steps. Despite its circular cross section, which might not seem to be ideal for such a measurement, at 0.4 μm in from the wire edge, 90% of the X-rays are already absorbed. The X-ray sensor used for this beam-shape scan was a 10 cm thick argon ion chamber at room temperature and pressure. Similar wire scans were made 3 mm upstream and 6 mm downstream from the sensor position. The measured widths from the 10% to 90% points on curves such as the one in Fig. 4 were 9 μm( −3 mm), 6 μm (0), and 12 μm (6 mm). Thus it is clear that there was no significant broadening of the beam in crossing the 0.1 mm thickness of the sensor. From the close locations of the vertical and horizontal grazing incidence beam focusing mirrors, the beam angular spread in the vertical direction would be expected to be similar.
Fig. 4.
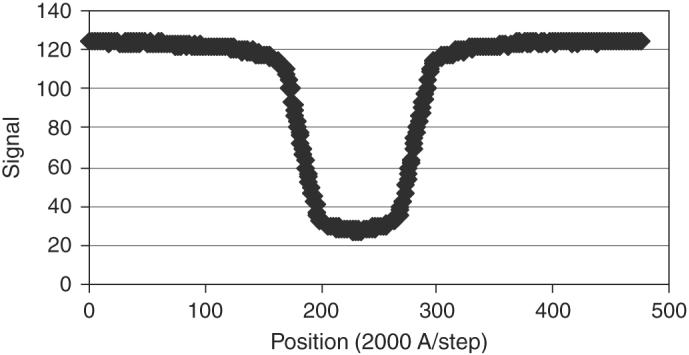
Beam signal as a tungsten wire is swept past the X-ray microbeam. The rise and fall distances each provide a measure of the beam size (∼5 μm) in the direction of the wire motion.
Fig. 5 shows an active edge sensor that was tested in this beam. The sensor had 16 p-type strips with a pitch of 150 μm, p-type bulk, and n-type bottom and sides, the latter covered with a thermal oxide layer about 0.8 μm thick (as in Fig. 3c). The room temperature was 26 °C, and the sensor was not cooled.
Fig. 5.
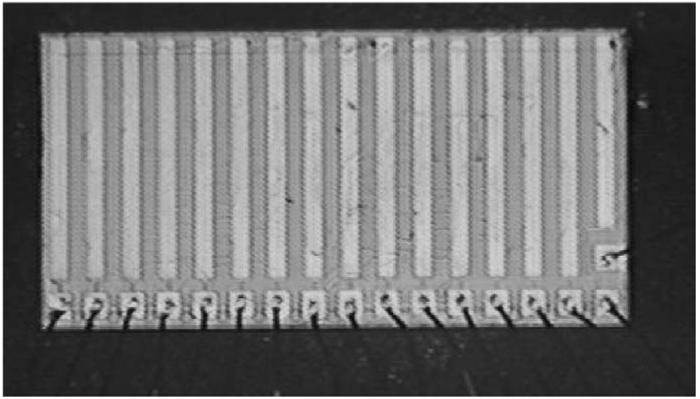
Active edge–planar sensor with 16 p strips on a 150 μm pitch connected by narrow aluminum traces to bonding pads at the bottom. (The extra pad above the bottom right corner pad is a metal square on the field oxide.)
The silicon sensor was scanned across the beam in 1 or 2 μm steps. Signals from it were taken by sending the current through a 100 k. resistor to the parallel combination of the 1 MΩ input impedance of a digital oscilloscope and a 100 nF capacitor (to reduce pickup and other sources of noise). The scope was triggered by the trailing edge of the stage motion pulse. After allowing 50 ms for the stage motion to settle and the current to stabilize, the current was determined by averaging 128 measurements taken over an 800 ms period.
Fig. 6 shows the edge and next-to-edge channel signals as the sensor is scanned across the beam. The rapid rise in signal height within several microns of the edge is expected. The oxide capping layer, which is less than 1 μm thick, indicated schematically in Fig. 3c, should be insensitive, but the side-wall diffusion turns the single crystal silicon immediately inside into an edge electrode. Ionization charge generated there should be able to diffuse, in several ns, to regions several μm away where, when the bulk is depleted, there is an electric field. The graded junction at the edge should also establish an electric field pushing one type of charge carriers away from the edge.
Fig. 6.
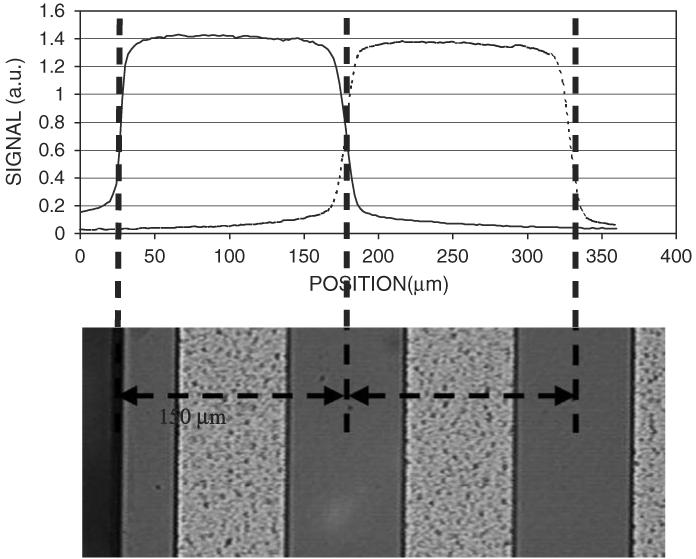
Signal from edge and next-to-edge channels as the sensor is scanned across the X-ray microbeam. The rapid turn-on at the left edge is clear. The tails come partly from the back-scattering of penetrating X-rays, and at the channel 1−2 border, partly from diffusion along the charge collection path.
Fig. 7 shows a bias voltage plateau for the signal voltage. There is a substantial signal even at zero bias voltage and a plateau from 2 to 30 V. Since collection times are relatively long at 0 V, this is an indication of good lifetimes and efficient charge collection, even near the active edges. The edge doping for active-edge types 2 and 3 will be the same as the bottom doping to prevent a high field junction at the bottom edges. There will thus be a diode junction between the top, edge electrodes and the physical edge, regardless of bulk type, making that a relatively high-field region. Breakdown voltages have been measured for 12 such devices, 250 μm thick, with a 30 μm strip pitch. One each broke down at 50 and 70 V, five at 200 V, and four did not break down at 210 V, the limit of the supply.
Fig. 7.
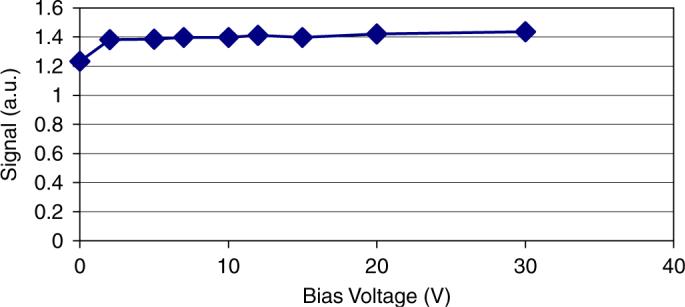
The signal height in the X-ray beam as a function of bias voltage.
Fig. 8 is similar to Fig. 6, but shows the collection from the two edge channels, with a rapid near-edge turn on, even with zero bias voltage.
Fig. 8.
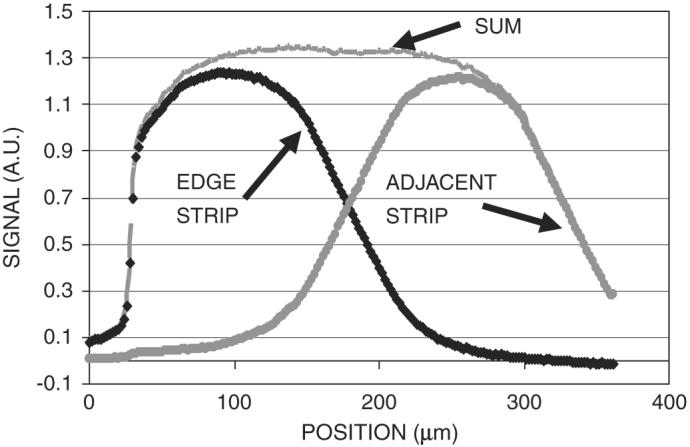
Signal from edge and next-to-edge channels as the sensor is scanned across the X-ray microbeam, but now with zero bias voltage.
Fig. 9 shows the signal from the edge channel only, but for four bias voltages from 0 to 20 V. From 2 V up, the collection pattern is almost constant.
Fig. 9.
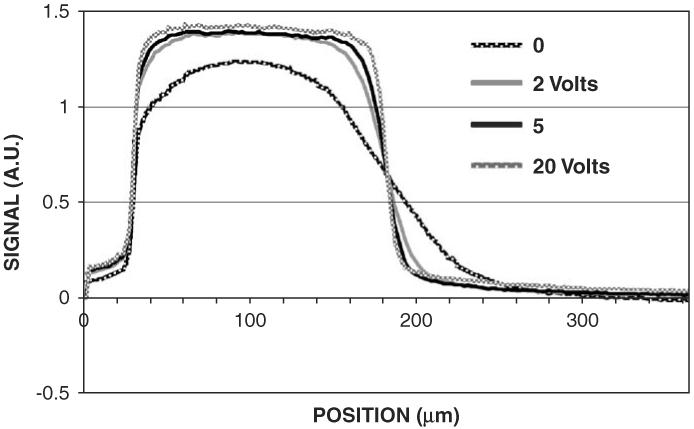
Scans of edge channel for four values of bias voltage: 0, 2, 5, and 20 V. The nearly identical signals for all bias voltages from 2 V and higher indicates good edge charge collection and carrier lifetimes.
4. Calculations of equipotentials
Fig. 10 shows the equipotentials for this sort of 3D active edge/planar sensor. The sensors are fully depleted with a bias of 5 V. Making the diode junction along the back and sides not only reduces the peak fields, but also makes it easy to deplete the corners. A general purpose partial differential equation solver, FlexPDE, Version 4 [14] was used to calculate potentials and electric fields in devices processed using 3D technology. This has a script language that can describe the equations, boundary conditions and complex geometry of 3D devices even when these involve a mix of cylindrical and rectangular structures. Normally one needs to solve the Poisson equation and continuity equations for electrons and holes. For the situation in which a reverse bias is used across a junction, and when leakage currents are negligible, one can use the non-linear Poisson equation only, Ref. [15]. This simplifies the problem considerably and allows one to solve for the potential distribution very quickly on a high-end PC.
Fig. 10.
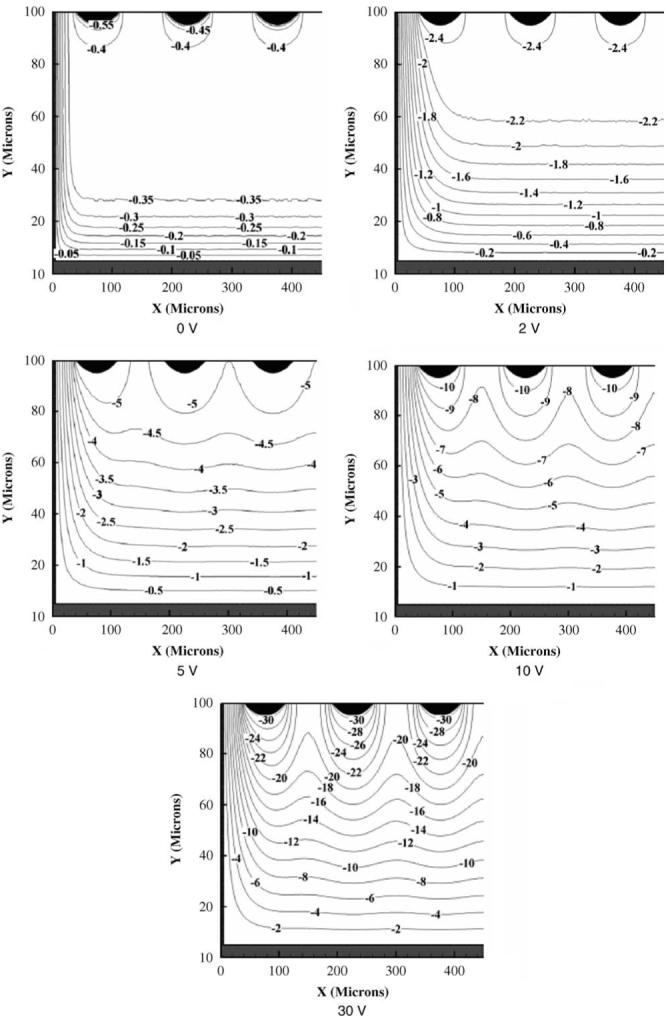
Equipotentials for a 100 μm-thick, 150 μm pitch sensor. This is a 3D-active edge/planar sensor with p+ strip collection electrode implants (black) , p+ bulk (white), n+ sides (active edges, grey) and n+ bottom (grey). The substrate dopant level is 6 × 1011 cm−3. Bias voltages are 0, 2, 5, 10 and 30 V. The sensors are fully depleted at 5 V. The n+ bottom is held at 0 V. The built-in potential is about 0.6 V between the n+ and p+ implants.
5. Conclusions
Using elements of 3D fabrication technology, sensors with either planar or 3D electrodes have been made with edges that act as electrodes, and with sensitive volumes that have been measured with X-ray microbeams to extend to within several microns or less, of their physical boundaries.
Acknowledgments
This work was supported in part by the National Institutes of Health, Center for Research Resources under grant R01 RR16230 and the Department of Energy under grant DE-FG02−04ER41291. Support from the UK Particle Physics and Astronomy Research Council (PPARC) is gratefully acknowledged. The devices were fabricated at the Stanford Nanofabrication Facility, which is supported by the National Science Foundation. We greatly appreciate the help provided by Michael Jimenez-Cruz and Al Thompson of the Advanced Light Source at the Lawrence Berkeley National Laboratory, and Steven Cliff of U.C. Davis.
References
- 1.Parker SI, Kenney CJ, Segal J. Nucl. Instr. and Meth A. 1997;395:328. [Google Scholar]
- 2.Kenney C, Parker S, Segal J, Storment C. Comparison of 3D and planar silicon detectors. Proceedings of the 9th Meeting of the Division of Particles and Fields of the American Physical Society; Minneapolis, MN. 11−15 August 1996; Singapore: World Scientific; 1998. p. 1342. [Google Scholar]
- 3.Kenney C, Parker S, Segal J, Storment C. IEEE Trans. Nucl. Sci. 1999;NS-46:1224. [Google Scholar]
- 4.Kenney C, Parker S, Krieger B, Ludewigt B, Dubbs T, Sadrozinski H. IEEE Trans. Nucl. Sci. 2001;48:189. [Google Scholar]
- 5.Parker SI, Kenney CJ. IEEE Trans. Nucl. Sci. 2001;NS-48:1629. [Google Scholar]
- 6.Kenney CJ, Parker SI, Walckiers E. IEEE Trans. Nucl. Sci. 2001;NS-48:2405. [Google Scholar]
- 7.Da Via C. Radiation Hard Silicon Detectors Lead the Way CERN Courier. 2003. p. 223.
- 8.Da Via C, Anelli G, Hasi J, Jarron P, Kenney C, Kok A, Parker S, Perozziello E, Watts SJ. Nucl. Instr. and Meth. A. 2003;509:86. [Google Scholar]
- 9.Morse J, Kenney C, Westbrook E, Naday I, Parker S. Nucl. Instr. and Meth. 2004;524:236. [Google Scholar]
- 10.Kenney C, et al. Hasi J, et al. “Planar active edge sensors” NS-6. “3D active edge radiation sensors” N26−15, IEEE Nuclear Science Symposium; Portland, OR. October 2003. [Google Scholar]
- 11.TOTEM technical design report 2004. CERN-LHCC-2004−002.
- 12.Arfelli F, Bonvicini V, Bravin A, Cantatore G, Castelli E, Fabrizioli M, Longo R, Olivo A, Pani S, Pontoni D, Poropat P, Prest M, Rashevsky A, Rigon L, Tromba G, Vacchi A, Vallazza E. Nucl. Phys. B. 1999;78(1):592. [Google Scholar]
- 13.Baldazzi G, et al. Nucl. Instr. and Meth. A. 2003;509:315. [Google Scholar]
- 14.FlexPDE4 http://www.pdesolutions.com/
- 15.Kramer K, Hitchon W. Semiconductor Devices—A Simulation Approach. Prentice-Hall; Englewood Cliffs, NJ: 1997. p. 304. [Google Scholar]


