

Abstract
Receptor kinases play a key role in the cellular perception of signals. To verify models for receptor activation through dimerization, an experimental system is required to determine the precise oligomerization status of proteins within living cells. Here we show that photon counting histogram analysis and dual-color fluorescence cross correlation spectroscopy are able to monitor fluorescently labeled proteins at the single-molecule detection level in living plant cells. In-frame fusion proteins of the brassinosteroid insensitive 1 (BRI1) receptor and the Arabidopsis thaliana somatic embryogenesis receptor-like kinases 1 and 3 (AtSERK1 and 3) to the enhanced cyan or yellow fluorescent protein were transiently expressed in plant cells. Although no oligomeric structures were detected for AtSERK3, 15% (AtSERK1) to 20% (BRI1) of the labeled proteins in the plasma membrane was found to be present as homodimers, whereas no evidence was found for higher oligomeric complexes.
Introduction
The classical model for activation of the membrane-located receptor kinase involves ligand binding induced dimerization of the receptor, resulting in autophosphorylation of both partners in the dimer (1,2). The mechanisms by which plant receptors transduce signals across the cell surface are largely unknown, but plant receptors may also dimerize (3). For both the clavata1 (4) and the brassinosteroid receptor (BR) complexes (5,6), heterooligomerization has been shown. However, no evidence has been presented that shows the level of oligomerization in living cells in a quantitative manner. Here the homooligomerization state of the brassinosteroid insensitive 1 receptor (BRI1) and two members of the Arabidopsis thaliana somatic embryogenesis receptor-like kinase family 1 and 3 (AtSERK1 and 3) are studied. BRI1, a plasma membrane receptor, is one of the components involved in brassinosteroid signaling. The BRI1 protein consists of an extracellular domain, a single transmembrane domain, and a cytoplasmic serine/threonine kinase. The extracellular domain contains 25 leucine-rich repeats (LRR) and a 70 amino acid island domain between the 21st and the 22nd LRR, which was found essential for BR binding. A BRI1-associated receptor kinase 1 (BAK1) was identified in an activation-tagging screen for bri1 suppressors (5) and in a yeast two-hybrid screen for BRI1 kinase domain interacting proteins (6). BAK1 is identical to AtSERK3, and both genetic and molecular data support that BRI1 and BAK1 (AtSERK3) are part of the same BR receptor complex (7). AtSERK1 is expressed during ovule and embryo development and facilitates the formation of plant embryos from somatic cells (8). The predicted primary structure of the AtSERK1 protein (69 kDa) consists of an N-terminal signal peptide followed by a leucine zipper (LZ) domain, 5 LRR units, a proline-rich domain, a single transmembrane domain, and the 12 conserved domains of a serine-threonine kinase (9).
To study BRI1, AtSERK3, and AtSERK1 by fluorescence techniques, complementary DNA (cDNA) was fused C-terminally to the cyan (CFP) or yellow (YFP) variant of enhanced green fluorescent protein (EGFP) (10) and transiently expressed in plant cells. Shah et al. (9) have shown by confocal imaging that the labeled AtSERK1 fusion protein is localized in the plasma membrane of such cells. These authors showed the potential for oligomerization of the AtSERK1 protein by yeast two-hybrid experiments and measurements of the YFP/CFP fluorescence emission ratio at the membrane of protoplasts that were cotransfected with both the CFP- and the YFP-fusion construct. In 15% of the measurements this ratio was enhanced due to the interaction of AtSERK1-CFP with AtSERK1-YFP, resulting in Förster resonance energy transfer (FRET) (11,12). Elimination of the extracellular LZ domain reduced the YFP/CFP emission ratio to control levels, indicating that without the LZ domain AtSERK1 is monomeric (9). Although FRET provides a molecular proximity assay with nanometer-scale resolution, techniques to visualize FRET with high spatial resolution such as fluorescence microscopy (13) and fluorescence lifetime imaging microscopy (FLIM) (14) require a large amount of fluorescently tagged molecules (>1 μM). This may be well above physiologically relevant concentrations. In addition, it is difficult to retrieve information about the oligomeric status of proteins. Techniques like photon counting histogram (PCH) analysis (15) and fluorescence correlation spectroscopy (FCS) (16) can provide this information at the single-molecule detection level. For FCS and PCH, the fluorescence intensity is monitored in a small observation volume that is continuously illuminated.
A particle with a given molecular brightness produces an intensity fluctuation as it passes the observation volume. Particles with a higher molecular brightness will result in stronger intensity fluctuations. Since small particles will diffuse more rapidly through the observation volume than large molecules, the duration of the fluorescence bursts contains information on the diffusion speed of the particles. Both PCH and FCS analysis use the same experimental data, but each technique focuses on a different property of the signal. Although FCS is a measure of the time-dependent decay of the fluorescence fluctuations, PCH analysis calculates the amplitude distribution of these fluctuations. This latter technique yields the distribution of molecular brightness per particle where molecular brightness is defined as the average fluorescence photon count rate detected per particle. Müller et al. (17) showed that PCH analysis is capable of resolving particles having a brightness ratio of 2. Therefore PCH should have the sensitivity to resolve the number of AtSERK or BRI1 proteins present in oligomeric complexes, since oligomers consisting of n monomers are expected to be n times as bright as the monomer. FCS has been applied successfully to study molecular interactions (for a review, see Hess et al. (16)). In most applications a small fluorescently labeled molecule binds to a nonlabeled molecule of much higher molecular weight. Autocorrelation analysis can distinguish the small, faster diffusing molecules from the large, slower diffusing complex and quantify both fractions. Meseth et al. (18) examined the resolving power of FCS to distinguish particles of different molecular size. When the molecular brightness of the fluorophore does not change upon interaction, the diffusion coefficients of the particles have to differ by a factor of at least 1.6.
This corresponds to a molecular weight ratio of ∼4, which is required to distinguish the species without prior knowledge of the system. Therefore, to determine the distribution of protein monomers, dimers, and possible higher states of oligomers from FCS analysis, the exact values of the molecular brightness of each species have to be known. These parameters cannot be obtained from the autocorrelation curves directly but can be retrieved from PCH analysis. Another possibility to study the interacting receptors is dual-color fluorescence cross correlation spectroscopy (FCCS) as has been developed by Schwille et al. (19). Here two spectrally different fluorescent groups, e.g., green and red emitting dyes, are used to label each of the interacting partners. Each dye is excited and detected by separate light sources and detectors. Molecular interactions can be studied by following the coincidence of the fluorescence fluctuations in the two detectors. The amplitude and decay of the cross correlation curves correspond to the number and dynamics of those complexes that carry both fluorescent dyes (19). So far only a few articles have been published using either PCH or FCCS to study molecular complexes in living cells (20–31). In this work we combined both techniques to study fluorescently tagged BRI1, AtSERK3, and AtSERK1 receptors. The results show that an accurate determination of the oligomerization status of individual proteins in living cells is possible through the use of FCCS and PCH.
Materials and methods
Constructs
The full-length cDNA of the BRI1 was polymerase chain reaction (PCR) amplified from expressed sequence tags obtained from Kazusa DNA Research Institute (Kisarazu, Japan) by using primers BRI1_F CATGCCATGGATGAAGACTTTTTCAAGC and BRI1_RCATGCCATGGCTAATTTTCCTTCAGGAA containing an NcoI restriction site. The cDNA was then inserted upstream of the enhanced cyan fluorescent protein (ECFP) or EYFP tags in the NcoI site of the pMON999 (Monsanto, Saint Louis, MO) vectors to generate BRI1-ECFP and BRI1-EYFP fusions, respectively. The AtSERK3 cDNA was PCR amplified with primers Serk3_FCATGCCATGGAACGAAGATTAATGATC and Serk3_RCATGCCATGGCTCTTGGACCCGAGGG and subcloned in the NcoI site of the vectors pMON999-ECFP/EYFP. The full-length and truncated (AtSERK1kin and AtSERK1ΔLZ) fusions of AtSERK1 to ECFP and EYFP were described before (9). Control experiments were performed using pMon999 lacking the sequence encoding for a fluorescent protein to estimate the contribution of autofluorescence, which is dependent on culture growth conditions and seasonal influences. All constructs were verified by sequencing.
Protoplast isolation
Cowpea mesophyll protoplasts were prepared by first peeling off the lower epidermis of the primary leaves of 10-day-old Vigna unguiculata, using forceps. Three leaves were floated on a 15 ml enzyme solution (0.1% cellulase, 0.05% pectinase, 10 mM CaCl2, and 0.5 M mannitol, pH 5.5) for 3.5 h at room temperature with gentle shaking. The cells were washed twice by adding 2 ml solution containing 10 mM CaCl2 and 0.5 M mannitol followed by centrifugation for 5 min at 600 rpm.
Transfection
Ten micrograms of purified plasmid in 30 μl water was added to 0.5–1 × 10⁶ protoplasts in 75–150 μl solution of 0.6 M mannitol, 10 mM CaCl2, pH 5.5. After gentle mixing, 3 ml solution containing 40% (w/v) polyethylene glycol Mw 6000, 0.6 M mannitol, 0.1 M Ca(NO3)2 was added. The protoplast suspension was incubated for 10 s under gentle shaking followed by addition of 4.5 ml washing solution consisting of 0.5 M mannitol, 15 mM MgCl2, and 0.1% MES (2-(N-morpholilino)ethanesulfonic acid), pH 5.5 to stop the transfection. After incubation at room temperature for 20 min, the cells were washed three times and incubated in petri dishes at room temperature under constant illumination. To study the effect on dimerization of the BRI1 receptor, 2,4-epibrassinolide (EBR) (Sigma-Aldrich, Zwijndrecht, The Netherlands) was applied to the protoplasts in a concentration of 1 μM from 0.5 mM stock solution in 80% ethanol, and the protoplasts were taken for measurements after 2 h incubation with BR.
Fluorescence fluctuation measurements
The fluorescence fluctuation experiments were carried out with a Confocor2/LSM510 microscope (Carl Zeiss, Jena, Germany) as have been described before (23). Briefly, the ECFP- and/or EYFP-labeled samples were excited with the 458 nm and/or 514 nm line of an Argon-ion laser. The excitation light was focused by a Zeiss water immersion C-Apochromat 40× objective lens (numerical aperture = 1.2) into the sample that was stored in 96-well plates (Whatman, Maidstone, UK) with borosilicate bottom. The fluorescence was separated from excitation light by a dual dichroic filter, reflecting both the 458 and 514 nm lines. A secondary dichroic filter, LP510, separated the emission into two different detection channels. The fluorescence emission was detected with avalanche photodiodes (Perkin-Elmer Optoelectronics, Vaudreuil, Canada) placed behind size adjustable pinholes. To maximize the overlap of both detection volumes, the position and diameter of the pinholes were optimized with ECFP. Appropriate band-pass filters (BP470-500 for CFP and BP527-562 for YFP, respectively) were used for spectral selection. Measurements were performed in protoplasts 5–9 h after transfection.
Since only 60% of the cells were successfully transfected, those cells were selected that had a fluorescence intensity higher than 12 or 20 kHz in the cell membrane or cytoplasm, respectively, which was above the highest intensity (6 and 12 kHz, respectively) observed for the local autofluorescence. For cross correlation measurements only cells were selected that expressed both the CFP and the YFP fusion proteins. The observation volume element was positioned in the cytoplasm or in the middle of the upper plasma membrane that was identified by acquiring a fluorescence intensity scan along the optical (z) axis. The laser power was set not higher than 2.5 kW cm−2 for the 458-nm laser line and 3.1 kW cm−2 for the 514-nm laser line to prevent photobleaching, cellular damage, and photophysical effects. These excitation intensities were still sufficient to achieve reasonable signal/noise ratios (SNRs) (5–10) within measurement times of 60–180 s. Greater than 3.2 (458 nm) or 4.0 kW cm−2 (514 nm), respectively, photobleaching and dye saturation lead to significant distortions of the correlation and PCH curves.
Auto and cross correlation analysis
The theoretical basis of FCS has been previously described and reviewed (16,32,33). Fluctuations of the fluorescence intensity observed in detection channel i, Fi(t), can be described by the normalized correlation function Gij(τ)
| (1) |
where δFi(t) describes the deviation of signal i from the time-average fluorescence intensity, 〈Fi〉, according to δFi(t) ≡ Fi(t) − 〈Fi(t)〉. In this study the fluorescence intensity fluctuations were caused by the two-dimensional (2D) diffusion of the fluorescently labeled membrane proteins through the diffraction-limited observation volume. In addition, EYFP shows signal variations due to fluctuations between fluorescent and dark states. This results in the following correlation function
| (2) |
where the first term corrects for the background fluorescence (Fbackground). The value of this parameter was determined by averaging the fluorescence intensity in the membrane of wild-type protoplasts. N is the mean number of molecules in the observation volume. The fraction and relaxation time of molecules in the dark state are given by T and τT. Each molecular species, m, contributes to the correlation curve function according to its fraction (Ym), molecular brightness (ηm), and mean diffusion time (τdif,m). The latter parameter is related to the translational diffusion constant D according to
| (3) |
with ωxy the axial radius of the observation volume.
FCCS experiments were performed using two spectrally different dyes (ECFP and EYFP), two laser wavelengths, and two detectors. The two fluorescence intensity signals are cross correlated according to Eq. 1 with i ≠ j. In the ideal case where the two detection volumes of the CFP and YFP detection channels share the same observation volume and when the dyes are fully spectrally separated the cross correlation function GCY(τ) follows from
| (4) |
Note that in Eq. 4 the time-independent part of the cross correlation function, GCY(0), is not only related to the concentration of doubly labeled particles, CCY, observed in the observation volume, Veff, but is also dependent on the particles labeled by only one type of dye, CC and CY. The effective observation volume was estimated from the cross correlation curve using a sample of ECFP. Here we make use of the cross talk of ECFP since some emission of ECFP will be detected in the YFP detection channel. The emission of EYFP in the CFP channel could be omitted. The following expression (34) corrects for the cross talk:
| (5) |
where NC, NY, and NCY are the number of particles labeled with ECFP, EYFP, and both dyes, respectively. The ηdye,excitation,emission values correspond to the molecular brightness values for the dyes as detected for the different excitation and emission wavelengths. For example ηCCY should be read as the molecular brightness of ECFP as detected in the YFP channel using the 458 nm “CFP” laser line. In our experimental system the oligomers do not consist only of particles carrying both the ECFP and the EYFP label, but multiple ECFP or multiple EYFP labels could also be present. From the PCH analysis of single FP-labeled AtSERK1 and BRI1, it became evident that the observed oligomeric structures consist of dimers. Therefore Eq. 5 has to be modified to take into account the presence of ECFP-ECFP or EYFP-EYFP labeled dimers. The molecular brightness of these dimers is twice the value of the monomeric form, as has been determined by PCH. Hence, since the contribution of each species to the correlation curve scales with the square of the relative brightness, the amplitude of the cross correlation curve now reads
| (6) |
The fluorescence intensity traces were stored, correlated, and analyzed in a home-developed software package which allows global fitting with several types of fitting models, using Marquardt least square fitting algorithms (35). The quality of the fitting was checked using the minimal value of χ2 and by visual inspection of the fitted trace and the residuals. Fitting parameters were averaged over 25–40 different FCS-curves, each curve obtained in another plant cell.
Photon counting histogram analysis
A theoretical overview of PCH has been described in the literature (15,17). The experimentally determined histogram of photon counts can be described by a theoretical distribution function that is dependent on the molecular brightness (η) and the number of particles (N). The experimental intensity traces were stored using a sampling frequency of 200 kHz. The data were analyzed in a home-developed software package (35) where it was binned to 5 kHz and fitted to a one- or two-species model including autofluorescence background assuming a 2D Gaussian detection volume for the membrane targeted proteins and a three-dimensional (3D) Gaussian detection volume for AtSERK1kin-FP and the free fluorescent proteins. The brightness of the autofluorescence was fixed to the values obtained in mock transfected cells (first two rows in Table 1). Control experiments using fluorescent proteins in the cytoplasm and membrane localized phospholipids (β-BODIPY530/550 C5-HPC) confirmed that at the SNR achieved in the cellular experiments no distinction could be made between models with or without restricted diffusion (36). To ensure that we could compare the retrieved molecular brightness values directly, without the need to correct for different diffusion times (37), PCH curves were generated using a binning of 20, 5, 1, and 0.1 kHz (Supplementary Fig. 1). The values remained stable when the binning was larger than 1 kHz. To validate the number of species included in the PCH fitting model, PCH traces and fits were exported to Igor Pro (Wavemetrics, Lake Oswego, OR). The reduced (Eq. 7) (17) indicates the quality of the fit model used and gives a measure of the ability to distinguish between the PCH curves of n and (n − 1) species systems. Values of lower than 1 indicate that the data statistics are not sufficient to resolve the species completely, whereas a larger than 1 indicates that more species than assumed in the fitting model are present:
| (7) |
Here M is the number of data points, d the number of fitting parameters, and kmin and kmax are the minimal and maximal, respectively, number of photon counts per bin. Nn and ηn represent the number of particles and molecular brightness of the nth species. σk is the standard deviation of finding k counts r times out of M trials and Π (k; N1,..,Nn, η1,.., ηn) are the theoretical nth species PCH functions (15).
Table 1.
Photon counting histogram analysis of the fluorescent proteins expressed in plant protoplasts
| Construct | ηCFP chan (kHz/mol) | NCFP chan (−) | ηYFP chan (−) | NYFP chan (kHz/mol) |
|---|---|---|---|---|
| no FP* | 0.4 ± 0.2 | 3.5 ± 1.4 | 0.3 ± 0.0 | 2.0 ± 0.7 |
| no FP† | 0.4 ± 0.1 | 22 ± 16 | 0.3 ± 0.1 | 24 ± 12 |
| ECFP† | 8.9 ± 0.5 | 1.2 ± 0.4 | – | – |
| EYFP† | – | – | 9.3 ± 0.5 | 0.85 ± 0.22 |
| AtSERK1-FP* (1st component) | 10.9 ± 1.3 | 1.3 ± 0.3 | 11.0 ± 0.5 | 1.4 ± 0.4 |
| (2nd component) | 22.3 ± 0.2 | 0.20 ± 0.04 | 19.8 ± 1.1 | 0.19 ± 0.10 |
| AtSERK1-FPΔLZ* | 10.6 ± 1.8 | 1.8 ± 0.5 | 11.0 ± 0.7 | 1.6 ± 0.3 |
| AtSERK1-FPkin† | 9.2 ± 0.6 | 0.95 ± 0.09 | 9.1 ± 0.7 | 1.1 ± 0.3 |
| AtSERK3-FP* | 11.4 ± 0.9 | 2.0 ± 0.6 | 11.3 ± 0.9 | 2.0 ± 0.3 |
| BRI1-FP* (1st component) | 11.0 ± 0.6 | 1.6 ± 0.5 | 11.1 ± 1.1 | 1.7 ± 0.4 |
| (2nd component) | 22.5 ± 1.0 | 0.31 ± 0.07 | 20.8 ± 1.3 | 0.40 ± 0.06 |
| CAAX-ECFP* | 10.6 ± 0.2 | 2.0 ± 0.4 | – | – |
| CAAX-(ECFP)2* | 20.3 ± 0.8 | 1.9 ± 0.6 | – | – |
The molecular brightness, η, and number of molecules, N, were retrieved by PCH analysis from the data acquired in the CFP and YFP detection channels. All PCH curves were fitted according to a single-species 2D (membrane) or 3D (cytoplasm) model, except for the data of AtSERK1 and BRI1, which had to be fitted by a two-species model to obtain a satisfactory fit. The standard deviations represent the variation of the parameter over experiments in different cells (n = 35).
Experiments in the plasma membrane.
Experiments in cytoplasmic regions lacking chloroplasts.
Figure 1.
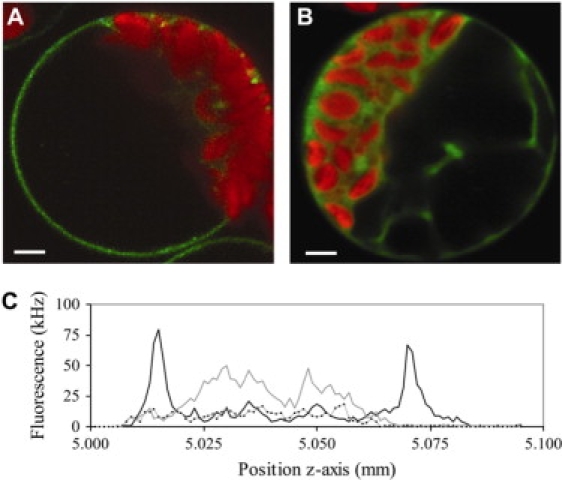
Expression of AtSERK1-ECFP. (A) Fluorescent confocal images of ECFP-labeled AtSERK1 protein expressed in cowpea protoplasts 16 h after transfection. CFP fluorescence, detected using a 480DF30 band-pass filter, is green in the false color-coded image, and chlorophyll fluorescence (LP650) is indicated by a red color. (B) AtSERK1kin-ECFP. The confocal images were acquired in the equator of the protoplast by accumulating four subimages of 512 × 512 pixels with a focused laser beam of 458 nm set at 2.5 kW cm−2. The bar represents 10 μm. (C) Lateral fluorescence intensity scans in the equator of cowpea protoplasts expressing AtSERK1-ECFP (black line) or AtSERK1kin-ECFP (gray line). The intensity profile of nontransfected cells is indicated by the dotted line.
Results and discussion
Expression of AtSERK1-, AtSERK3-, and BRI-VFP fusion proteins
The full-length AtSERK1-, AtSERK3-, or BRI1-ECFP/EYFP constructs were transfected into protoplasts. The confocal images, acquired in the middle of the spherically shaped protoplast, showed the localization of ECFP labeled AtSERK1 (Fig. 1 A), labeled AtSERK3 and BRI1 (data not shown) at the plasma membrane, similar to what has been observed in Arabidopsis roots for BRI1 (38) and BAK1 (AtSERK3) (5). A more extensive description of the localization of AtSERK3 and BRI1 has been given by Russinova et al. (39). A lateral intensity scan through the equatorial plane of the protoplast displays two strong fluorescent peaks separated ∼50 μm from each other (Fig. 1 C), which corresponds to the average diameter of a protoplast. The fluorescence intensities in the cytoplasm, vacuole, and nucleus were similar to the values obtained in nontransfected cells. The labeling pattern is similar to a protoplast loaded with the membrane marker BODIPY FL-HPC (data not shown), and it is therefore concluded that the two peaks represent the plasma membrane at the left and right border of the protoplast.
Two AtSERK1 constructs were included as negative controls for AtSERK1 oligomerization. The first is AtSERK1kin, encoding only the intracellular kinase domain fused to ECFP and EYFP. This results in localization of the fluorescent fusion protein in the cytoplasm (Fig. 1 B). Previous work clearly indicated that AtSERK1kin-ECFP/EYFP proteins did not show any oligomerization as determined by fluorescence spectral imaging microscopy (FSPIM) (9). The expression pattern is similar to that found in protoplasts expressing (nontargeted) ECFP. However, in contrast to AtSERKkin-ECFP, the small cytosolic ECFP is able to enter the protoplast nucleus. The level of expression and the localization of the proteins were found to be independent of the type of fluorescent protein used for labeling. The second control was the AtSERKΔLZ-ECFP/EYFP proteins. The deletion of the LZ domain resulted in proteins being targeted to the plasma membrane comparable to the wild-type proteins but that were no longer able to form homodimers (9).
Photon counting histogram analysis of labeled proteins
AtSERK1 and BRI1 were seen to form oligomeric structures in the plasma membrane (9,38), but the exact composition of these aggregates is not known. PCH analysis can retrieve this composition on the basis of differences in molecular brightness between single labeled monomers and multiple labeled complexes. To detect the fluorescence fluctuations of the proteins, the observation volume was positioned in the upper plasma membrane of the transfected protoplasts after determining the fluorescence intensity profile along the optical (z) axis. Measurements of free fluorescent protein and AtSERK1kin were performed in the cytoplasm. Since PCH and FCCS are techniques to analyze the relative fluorescence fluctuations, an upper concentration limit exists above which no information can be retrieved. The lower concentration limit is set by the number and the relative brightness of background components such as endogenous autofluorescent molecules. The concentration of fluorescent dye used in fluctuation spectroscopy is typically 100 pM-1 μM in vitro, but in cowpea protoplasts a lower concentration of 5 nM is required to detect ECFP or EYFP in the cytoplasm. Here, the fusion constructs were expressed under control of the strong 35S promoter that leads to high levels of expressed protein (>1 μM) after prolonged incubation times.
To identify the time window where the expression level of the fluorescent proteins is optimal for fluctuation analysis, the molecular brightness and autocorrelation amplitude, G(0), have been monitored over time. G(0) − 1 is related to the inverse number of fluorescent particles in the observation volume and thus is a measure for the concentration of fluorescent particles. In the first 3 h after transfection the acquired autocorrelation curves have very low SNR and low correlation amplitudes. PCH analysis of these data traces according to a single species model identified a high number of molecules with a low molecular brightness as source for the intensity fluctuations. The fluctuations observed are caused by the presence of a large number of dim, autofluorescent molecules. No indication for the presence of the relatively bright ECFP fusion proteins was found. Three hours after transfection the SNR of the autocorrelation and PCH curves improved significantly. After 9 h the normalized autocorrelation amplitude was approximately equal to 1 and the PCH histogram approached a Poissonian distribution. This indicates that the expression levels of fluorescent proteins were so high that no information could be retrieved from the fluctuation analysis. Therefore, fluctuation experiments in transfected protoplasts were performed 5–9 h after transfection.
The expression level of ECFP, EYFP, and the fluorescently labeled proteins was homogeneous throughout the population of successfully transfected protoplasts and remained stable during the measurement (Fig. 2 A). No intensity drift was observed, as reported for EGFP in HeLa cells (40) and Dictyostelium cells (41). The PCHs were analyzed according to a model assuming the presence of a single species and an autofluorescent component. The single species fits led to a good description of the experimental histograms for ECFP (Fig. 2 B). Similar results were obtained for protoplasts expressing EYFP or the fluorescently labeled AtSERK3, AtSERK1ΔLZ, and AtSERK1kin. The normalized residuals produced by the fits are close to 1 and distributed randomly. The fits yield a , indicating the proper choice of fitting model. It was noted that the differences in expression level of the fusion protein among the cells did not affect the average molecular brightness, as shown for AtSERK1-ECFP and two control constructs, ECFP and CAAX-(ECFP)2, in Fig. 3. CAAX-(ECFP)2 is a fusion protein containing two ECFP moieties that is targeted to the plasma membrane due to the presence of a CAAX amino acid motif that results in posttranslational attachment of an isoprenyl group to the cysteine residue (42).
Figure 2.
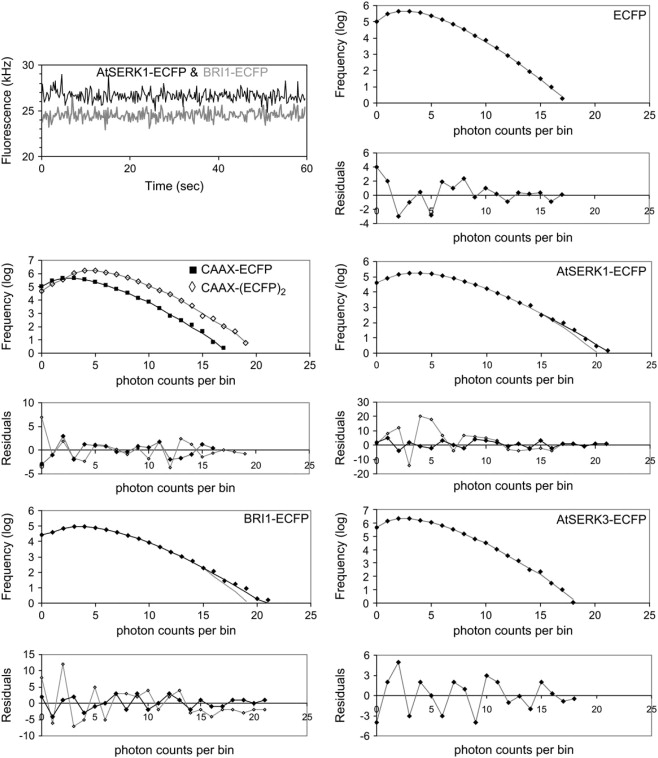
Oligomerization of ECFP fusion proteins in protoplasts from PCH analysis. In the top left panel typical ECFP fluorescence intensity traces are displayed for AtSERK-ECFP (black) and BRI1-ECFP (gray). The traces are stable during the measurement time and do not show spikes or drifting. From the fluorescence intensity trajectories, PCHs were derived for ECFP, CAAX-ECFP, CAAX-(ECFP)2, AtSERK1-ECFP, BRI1-ECFP, and AtSERK3-ECFP. The lines in the panels represent the fits to the data points (diamonds) using a single-species model (gray line) or a two-species model (black line) with background. In the panels below the histograms the normalized residuals between fit and experimental data are plotted. The residuals indicate the quality of the fit for both models.
Figure 3.
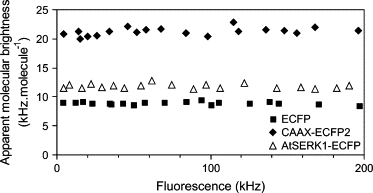
Apparent molecular brightness of ECFP and fusion proteins as a function of expression level. The fluorescence intensity has been measured in the cytoplasm of protoplasts expressing ECFP and in the upper plasma membrane of protoplasts expressing CAAX-(ECFP)2 or AtSERK1-ECFP between 5 and 9 h after transfection. The PCH data were fitted according to a single-species model with background assuming 2D (membrane) or 3D (cytoplasm) Gaussian diffusion.
The molecular brightness of CAAX-ECFP measured in the membrane yields 10.6 ± 0.2 kHz per molecule and is similar for all the membrane targeted ECFP-fusion proteins used in this study, although the fusion proteins are slightly dimmer compared to the free fluorescent protein (Table 1). This brightness is somewhat higher than the ones retrieved for ECFP and its cytoplasmic fusion proteins, which can be explained by the differences in the point spread function assumed in the 2D and 3D Gaussian fitting models. The molecular brightness of 20.3 ± 0.8 kHz for CAAX-(ECFP)2 (Fig. 2) agrees well with the expected doubling of the molecular brightness compared to CAAX-ECFP. Only the PCH analysis of fluorescent AtSERK1-ECFP and BRI1-ECFP required a multicomponent model to fit the data, since the reduced for the single-species model was 16 and 21, respectively. The two-species fit resulted in a of 0.8 and 0.7 with randomly distributed residuals (Fig. 2).
Expansion of the fitting model by a third species did not result in an improvement of χ2 . The fitting results identified a large fraction of AtSERK1-FP (86%) and BRI1 (77%) molecules with a molecular brightness of 10.9 kHz per molecule. This value corresponds well to the value obtained from CAAX-ECFP, and therefore this fraction is considered to represent the monomeric form of AtSERK1 and BRI1. The second fraction of molecules had a brightness value of approximately twice the value of the larger fraction (similar to CAAX-(ECFP)2) and most likely represented the dimerized molecules (22 kHz per molecule). A similar fraction with a doubled molecular brightness has been observed using the EYFP fusion proteins. The AtSERK1-FPΔLZ and AtSERK3-FP fusion proteins gave rise to photon count distributions that could be fitted by a single-species model with a brightness value corresponding to that of the negative control, the CAAX-ECFP membrane protein. In addition, the single molecular brightness value found for AtSERK1-FPkin corresponded to the one found for the free fluorescent protein. Therefore it was concluded that the deletions in AtSERK1ΔLZ and AtSERK1kin prevent the receptor to dimerize, confirming the data obtained with the same constructs using FSPIM (9). No evidence was found for the homooligomerization of labeled AtSERK3 (Fig. 2). This result is in accordance with the data obtained by FRET-FLIM measurements where no lifetime reduction was observed upon cotransfection of both ECFP- and EYFP-fusion proteins (38). In comparison with AtSERK1, AtSERK3 lacks the second cysteine pair flanking the LRR in the extracellular domain, and this pair might be essential for intermolecular interactions and receptor homodimerizaton (43).
Fluorescence (cross) correlation microscopy of ECFP and EYFP labeled proteins
To confirm the presence and to monitor the diffusion properties of the homooligomeric structures, dual-color FCCS was applied to the protoplasts expressing both ECFP and EYFP fusion proteins. It has been noted that all fluorescence bursts detected in the CFP channel were accompanied by simultaneous bursts in the YFP channel. This phenomenon is caused by the “cross talk”, the emission of the ECFP fluorophore in the YFP detector due to its long emission tail in the spectrum. The cross talk intensity ratio in the bursts, IYFP/ICFP, as determined from CAAX-ECFP transfected protoplasts amounted to 0.30 ± 0.12, and this value was used to correct the YFP intensity trace after both traces were corrected for background fluorescence. Alternatives for eliminating cross talk are pulsed interleaved excitation (27), in which each fluorophore is excited and detected sequentially, or the use of other labels that are spectrally well separated. Besides the genetically encoded fluorophores like GFP, one of the recently developed in vivo chemical labeling strategies, such as biarsenide dyes (44) or the acyl carrier protein system (45), can be chosen.
From the photon arrival time traces, the auto- and cross correlation curves were calculated using Eqs. 2, 5, and 6. Fig. 4 presents the auto- and cross correlation curves measured in the protoplasts transfected with the ECFP/EYFP and ECFP/EYFP fusion proteins. The positive control CAY, consisting of an ECFP moiety fused to EYFP via a 25 amino acid linker (23), gives rise to high cross correlation amplitude with respect to the autocorrelation amplitudes since all particles contain both labels. For both AtSERK1 and BRI1 but not for AtSERK3, cross correlating particles could be detected. The diffusion coefficients of the proteins were obtained by fitting the auto and cross correlation curves from 25 to 40 different cells to a 2D diffusion model (Table 2). The obtained diffusion times were converted into diffusion coefficients according to Eq. 3 using axial radii of the observation volume of 225 nm (CFP channel), 238 nm (YFP channel), and 230 nm (cross correlation). The corresponding sizes of the detection volumes (19), required for calculating the protein concentrations, are 0.24 fl (CFP), 0.34 fl (YFP), and 0.30 fl (cross correlation). No multicomponent or restricted anomalous diffusion models were required to analyze the data, as reported for membrane proteins in other cell types (36).
Figure 4.
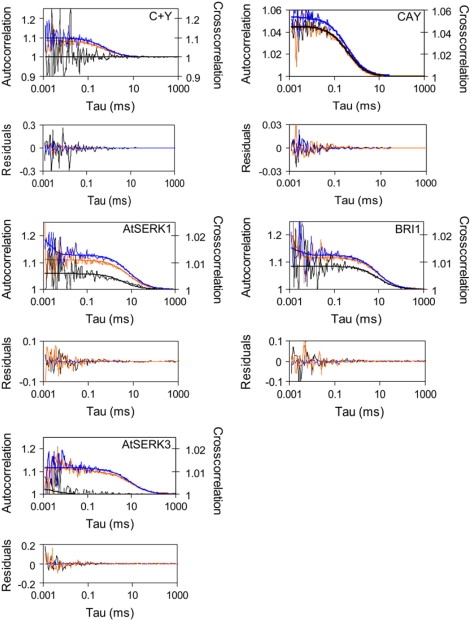
Autocorrelation (blue, CFP channel; orange, YFP channel) and cross correlation curves (black) of free ECFP and EYFP, CAY, AtSERK1, BRI1, and AtSERK3 in cotransfected cowpea protoplasts. The curves (thin lines) have been corrected for noncorrelating background and cross talk. The measurement time for these samples was 2 min. The curves were fitted according to a model describing 2D Brownian motion (thick lines), and the fit residuals are displayed in the panels below.
Table 2.
Diffusion coefficients (×1013 m2s−1) of the fluorescent fusion proteins expressed in plant protoplasts
| Construct(s) | D (CFP channel) | D (YFP channel) | D (Cross correlation channel) |
|---|---|---|---|
| AtSERK1-ECFP or -EYFP* | 4.0 ± 0.5 | 4.2 ± 0.6 | n.f. |
| AtSERK1-ECFP and -EYFP* | 4.2 ± 1.3 | 3.9 ± 0.7 | 2.6 ± 0.7 |
| AtSERK1ΔLZ-ECFP or -EYFP* | 3.7 ± 0.5 | 4.0 ± 0.5 | n.f. |
| AtSERK1ΔLZ-ECFP and -EYFP* | 4.2 ± 0.9 | 4.1 ± 0.6 | n.f. |
| AtSERK1kin-ECFP or -EYFP† | 90 ± 8 | 84 ± 5 | n.f. |
| AtSERK1kin-ECFP and -EYFP† | 78 ± 16 | 75 ± 15 | n.f. |
| AtSERK3-ECFP and -EYFP* | 4.4 ± 0.7 | 4.6 ± 0.6 | n.f. |
| BRI1-ECFP and -EYFP* | 4.5 ± 0.8 | 4.3 ± 0.5 | 3.8 ± 0.8 |
| CAAX-ECFP and -EYFP* | 5.3 ± 0.7 | 5.2 ± 0.7 | n.f. |
| CAAX-(ECFP)2* | 5.1 ± 0.8 | n.f. | n.f. |
| ECFP or EYFP† | 370 ± 41 | 410 ± 46 | n.f. |
The diffusion coefficients were obtained from FCS or FCCS analysis. All FCS curves were fitted according to a single-species model, except for the data of AtSERK1 and BRI1, which were fitted to a two-species model. The standard deviations represent the variation of the diffusion coefficient over experiments in different cells (n = 25–40 for each type of sample). n.f., not found.
Experiments in the plasma membrane.
Experiments in cytoplasmic regions lacking chloroplasts.
When ECFP-labeled proteins can only form complexes with EYFP-labeled proteins, the number of protein complexes can be directly retrieved from the FCCS-curve. From PCH analysis of single FP-labeled AtSERK1 and BRI1, it was evident that the oligomeric structures consist of dimers. Therefore in the FCS analysis we have to consider that not only do the dimers consist of particles carrying both the ECFP and the EYFP label (NCY), but also dimers with two ECFP (NCC) or EYFP (NYY) labels may be present. To retrieve NCY the parameters describing the auto and cross correlation curves were globally linked. Cross correlation curves were analyzed by combining Eqs. 4 and 6, and autocorrelation curves were analyzed according to Eq. 2. Parameters ηCCY and Fbackground were set to zero since the curves have been corrected for background already. The analysis of the AtSERK1 yielded NCY = 1.0 ± 0.3, which corresponds to 7% of the total amount of AtSERK1 protein. Fitting the CFP and YFP autocorrelation curves of AtSERK1 with a three-component 2D Brownian motion model, fixing the amount of cross correlating particles, and taking into account the differences in molecular brightness yielded NCC = 0.5 ± 0.1 and NYY = 0.4 ± 0.1 complexes for the CFP and YFP channels, respectively.
The sum of these complexed molecules (NCC + NYY + NCY) corresponds to 15% ± 5% of the total amount of protein, which agrees well with the values of 14% as obtained from PCH. Therefore it was concluded that ∼14% of AtSERK1 is present in a dimerized form in the plasma membrane. Spectral imaging (9) and FRET-FLIM measurements (39) of AtSERK1-ECFP/EYFP fusion proteins at the protoplast membrane have shown that a small percentage of the AtSERK1 protein might exist as oligomers. It also appeared that there are only certain regions in the plasma membrane where AtSERK1 proteins are not monomeric. This indicates that a minority of the AtSERK1 receptor molecules on the plasma membrane is in a predimerized state. This observation is in line with EGF receptor dimerization. In mammalian cells 12% of the high-affinity ErbB1 receptors are dimerized in specific regions of the plasma membrane. Based on the quantitative determination of FRET on the EGF receptor in mammalian cells, it was suggested that the high-affinity subclass of receptors is present in a predimerized state in the absence of the ligand (46).
Since it is not known whether ligands that bind to AtSERK1 are present in the growth medium, it is not possible to assign the presence of AtSERK1 dimers to ligand-induced dimerization or to preassociated receptor molecules. Therefore, identification of the ligand will be essential for determining the exact functioning of AtSERK1. The mutated forms of AtSERK1, AtSERK1ΔLZ, lacking the LZ domain, AtSERK1kin, lacking the transmembrane and extracellular domain, did not result in a cross correlating complex, and therefore it is concluded that these domains are essential in dimerization of the AtSERK1 receptor. The total number of fluorescent receptor molecules in the cell membrane of protoplasts (diameter ∼50 μm) can be estimated from the average number of fluorescent receptors (∼12) that have been detected in our microscopic field of view (∼0.2 μm2). Assuming a homogeneous receptor distribution over the membrane of a spherical protoplast, ∼300,000 receptor molecules are present per cell. This number is in the same range as the number of receptor molecules per cell in EGF-expressing mammalian cells (47).
The FCCS results confirmed the dimerization of BRI1 (22% ± 5% in dimeric form), whereas no evidence was found for oligomerization of AtSERK3. To determine whether brassinolide (BL) treatment of the protoplasts expressing BRI1-ECFP would affect the oligomerization status, PCH experiments were performed on protoplasts incubated with 0–10 μM BL (Fig. 5). In the absence of exogenous BL, 20% of the BRI1-ECFP in the plasma membrane was present as a homodimer, resulting in an average molecular brightness of 8.7 kHz per molecule. Titration of 0.5–10 μM BL altered neither the fraction nor the oligomerization state of the labeled BRI1 proteins, indicating that the oligomerization state of the protein is ligand independent.
Figure 5.
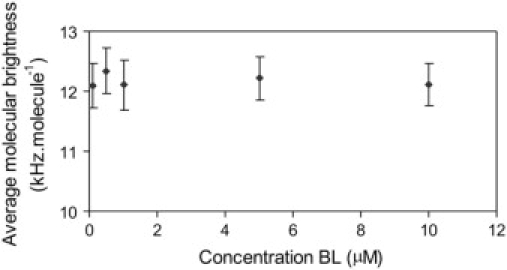
Oligomerization state of BRI1-ECFP upon titration with brassinosteroid ligand (BL). The average molecular brightness of BRI1-ECFP was measured in the plasma membrane of protoplasts after incubation with EBR for 2 h. The PCH curves were fitted to a two-species model (with background), and the obtained brightness values were averaged by weighting their molar fractions.
Conclusions
Dual-color FCCS and PCH were successfully applied to study the oligomerization state and mobility of Arabidopsis thaliana somatic embryogenesis receptor kinases (AtSERK1 and 3) and Brassinosteroid insensitive receptor (BRI1) in the plasma membrane of cowpea protoplasts. PCH analysis of fluorescently labeled proteins showed that a small fraction of the AtSERK1 (13%) and BRI1 (20%) fusion proteins in the plasma membrane is present in dimerized form, whereas no indication was found for higher oligomeric complexes. No evidence was found for homooligomerization of AtSERK3. These results were confirmed by FCCS. In addition, it was shown that both monomeric and dimerized forms of the AtSERK1 and BRI1 fusion proteins diffuse in the plasma membrane according to normal two-dimensional Brownian motion. Our results show that it is feasible to determine the oligomerization status of individual proteins in living cells. Although we focused on homooligomerization here, the techniques described in this work can also be applied to analyze heterooligomerization, and therefore future studies can be performed to study the interactions between the AtSERK family members, BRI1, and other components involved in brassinosteroid signaling.
Supplementary material
To view all of the supplemental files associated with this article, visit www.biophysj.org.
Appendix A.
Supplement
Acknowledgments
We are grateful to Frank van Breukelen (Laboratory for Biochemistry, Wageningen University, The Netherlands) for DNA isolation of the AtSERK3 and BRI1 constructs, Jeroen Pouwels (Laboratory for Molecular Biology, Wageningen University, The Netherlands) for assistance with the protoplast transfections, and Jan Willem Borst (MicroSpectroscopy Centre, Wageningen University, The Netherlands) for valuable discussions.
This work was supported by grants from the Netherlands Council of Earth and Life Sciences (ALW-NWO) and the European Union (QLG2-CT-2001-01428).
Footnotes
Editor: Byron Goldstein.
References
- 1.Lemmon M.A., Schlessinger J. Regulation of signal transduction and signal diversity by receptor oligomerization. Trends Biochem. Sci. 1994;19:459–463. doi: 10.1016/0968-0004(94)90130-9. [DOI] [PubMed] [Google Scholar]
- 2.Schlessinger J. Signal transduction by allosteric receptor oligomerization. Trends Biochem. Sci. 1998;13:443–447. doi: 10.1016/0968-0004(88)90219-8. [DOI] [PubMed] [Google Scholar]
- 3.Williams R.W., Wilson J.M., Meyerowitz E.M. A possible role of kinase-associated protein phosphatase in the Arabidopsis CLAVATA1 signaling pathway. Proc. Natl. Acad. Sci. USA. 1997;94:10467–10472. doi: 10.1073/pnas.94.19.10467. [DOI] [PMC free article] [PubMed] [Google Scholar]
- 4.Jeong S., Trotochaud A.E., Clark S.E. The Arabidopsis CLAVATA2 gene encodes a receptor-like protein required for the stability of the CLAVATA1 receptor-like kinase. Plant Cell. 1999;11:1925–1935. doi: 10.1105/tpc.11.10.1925. [DOI] [PMC free article] [PubMed] [Google Scholar]
- 5.Li J., Wen J., Lease K.A., Doke J.T., Tax F.E., Walker J.C. BAK1, an Arabidopsis LRR receptor-like protein kinase, interacts with BRI1 and modulates brassinosteroid signaling. Cell. 2002;110:213–222. doi: 10.1016/s0092-8674(02)00812-7. [DOI] [PubMed] [Google Scholar]
- 6.Nam K.H., Lee J. BRI1/BAK1, a receptor kinase pair mediating brassinosteroid signaling. Cell. 2002;110:203–212. doi: 10.1016/s0092-8674(02)00814-0. [DOI] [PubMed] [Google Scholar]
- 7.Yin Y., Wu D., Chory J. Plant receptor kinases: systemin receptor identified. Proc. Natl. Acad. Sci. USA. 2002;99:9090–9092. doi: 10.1073/pnas.152330799. [DOI] [PMC free article] [PubMed] [Google Scholar]
- 8.Hecht V., Vielle-Calzada J.-P., Hartog M.V., Schmidt E.D.L., Boutilier K., Grossniklaus U., de Vries S.C. The Arabidopsis somatic embryogenesis receptor kinase 1 gene is expressed in developing ovules and embryos and enhances embryogenic competence in culture. Plant Physiol. 2001;127:803–816. [PMC free article] [PubMed] [Google Scholar]
- 9.Shah K., Gadella T.W.J., van Erp H., Hecht V., de Vries S.C. Subcellular localization and oligomerization of the Arabidopsis thaliana somatic embryogenesis receptor kinase 1 protein. J. Mol. Biol. 2001;309:641–655. doi: 10.1006/jmbi.2001.4706. [DOI] [PubMed] [Google Scholar]
- 10.Tsien R.Y. The green fluorescent protein. Annu. Rev. Biochem. 1998;67:509–544. doi: 10.1146/annurev.biochem.67.1.509. [DOI] [PubMed] [Google Scholar]
- 11.Förster T. Zwischenmolekulare Energiewanderung und Fluorescenz. Ann. Phys. 1948;2:55–75. [Google Scholar]
- 12.Stryer L. Fluorescence energy transfer as a spectroscopic ruler. Annu. Rev. Biochem. 1978;47:819–846. doi: 10.1146/annurev.bi.47.070178.004131. [DOI] [PubMed] [Google Scholar]
- 13.Xia Z., Liu Y. Reliable and global measurement of fluorescence resonance energy transfer using fluorescence microscopes. Biophys. J. 2001;81:2395–2402. doi: 10.1016/S0006-3495(01)75886-9. [DOI] [PMC free article] [PubMed] [Google Scholar]
- 14.Bastiaens P.I.H., Squire A. Fluorescence lifetime imaging microscopy: spatial resolution of biochemical processes in the cell. Trends Cell Biol. 1999;9:48–52. doi: 10.1016/s0962-8924(98)01410-x. [DOI] [PubMed] [Google Scholar]
- 15.Chen Y., Müller J.D., So P.T.C., Gratton E. The photon counting histogram in fluorescence fluctuation spectroscopy. Biophys. J. 1999;77:553–567. doi: 10.1016/S0006-3495(99)76912-2. [DOI] [PMC free article] [PubMed] [Google Scholar]
- 16.Hess S.T., Huang S., Heikal A.A., Webb W.W. Biological and chemical applications of fluorescence correlation spectroscopy: a review. Biochemistry. 2002;41:697–705. doi: 10.1021/bi0118512. [DOI] [PubMed] [Google Scholar]
- 17.Müller J.D., Chen Y., Gratton E. Resolving heterogeneity on the single molecular level with the photon-counting histogram. Biophys. J. 2000;78:474–486. doi: 10.1016/S0006-3495(00)76610-0. [DOI] [PMC free article] [PubMed] [Google Scholar]
- 18.Meseth U., Wohland T., Rigler R., Vogel H. Resolution of fluorescence correlation measurements. Biophys. J. 1999;76:1619–1631. doi: 10.1016/S0006-3495(99)77321-2. [DOI] [PMC free article] [PubMed] [Google Scholar]
- 19.Schwille P., Meyer-Almes F.J., Rigler R. Dual-color fluorescence cross-correlation spectroscopy for multicomponent diffusional analysis in solution. Biophys. J. 1997;72:1878–1886. doi: 10.1016/S0006-3495(97)78833-7. [DOI] [PMC free article] [PubMed] [Google Scholar]
- 20.Ruan Q., Chen Y., Gratton E., Glaser M., Mantulin W.W. Cellular characterization of adenylate kinase and its isoform: two-photon excitation fluorescence imaging and fluorescence correlation spectroscopy. Biophys. J. 2002;83:3177–3187. doi: 10.1016/S0006-3495(02)75320-4. [DOI] [PMC free article] [PubMed] [Google Scholar]
- 21.Bacia K., Majoul I.V., Schwille P. Probing the endocytic pathway in live cells using dual-color fluorescence cross-correlation analysis. Biophys. J. 2002;83:1184–1193. doi: 10.1016/S0006-3495(02)75242-9. [DOI] [PMC free article] [PubMed] [Google Scholar]
- 22.Chen Y., Müller J.D., Ruan Q.Q., Gratton E. Molecular brightness characterization of EGFP in vivo by fluorescence fluctuation spectroscopy. Biophys. J. 2002;82:133–144. doi: 10.1016/S0006-3495(02)75380-0. [DOI] [PMC free article] [PubMed] [Google Scholar]
- 23.Hink M.A., Borst J.W., Visser A.J.W.G. Fluorescence correlation spectroscopy of GFP fusion proteins in living plant cells. Methods Enzymol. 2003;361:93–111. doi: 10.1016/s0076-6879(03)61007-4. [DOI] [PubMed] [Google Scholar]
- 24.Kim S.A., Heinze K.G., Waxham M.N., Schwille P. Intracellular calmodulin availability accessed with two-photon cross-correlation. Proc. Natl. Acad. Sci. USA. 2004;101:105–110. doi: 10.1073/pnas.2436461100. [DOI] [PMC free article] [PubMed] [Google Scholar]
- 25.Saito K., Wada I., Tamura M., Kinjo M. Direct detection of caspase-3 activation in single live cells by cross-correlation analysis. Biochem. Biophys. Res. Commun. 2004;324:849–854. doi: 10.1016/j.bbrc.2004.09.126. [DOI] [PubMed] [Google Scholar]
- 26.Baudendistel N., Muller G., Waldeck W., Angel P., Langowski J. Two-hybrid fluorescence cross-correlation spectroscopy detects protein-protein interactions in vivo. ChemPhysChem. 2005;6:984–990. doi: 10.1002/cphc.200400639. [DOI] [PubMed] [Google Scholar]
- 27.Thews E., Gerken M., Eckert R., Zapfel J., Tietz C., Wrachtrup J. Cross talk free fluorescence cross-correlation spectroscopy in live cells. Biophys. J. 2005;89:2069–2076. doi: 10.1529/biophysj.104.057919. [DOI] [PMC free article] [PubMed] [Google Scholar]
- 28.Chen Y., Wei L.N., Müller J.D. Unraveling protein-protein interactions in living cells with fluorescence fluctuation brightness analysis. Biophys. J. 2005;88:4366–4377. doi: 10.1529/biophysj.105.059170. [DOI] [PMC free article] [PubMed] [Google Scholar]
- 29.Muto H., Nagao I., Demura T., Fukuda H., Kinjo M., Kotaro T. Fluorescence cross-correlation analyses of the molecular interaction between an AUX/IAA protein, MSG2/IAA19, and protein-protein interaction domains of auxin response factors of Arabidopsis expressed in HeLa cells. Plant Cell Physiol. 2006;47:1095–1101. doi: 10.1093/pcp/pcj080. [DOI] [PubMed] [Google Scholar]
- 30.Liu P., Sudhaharan T., Koh R.M.L., Hwang L.C., Ahmed S., Maruyama I.N., Wohland T. Investigation of the dimerization of proteins from the epidermal growth factor receptor family by single wavelength fluorescence cross-correlation spectroscopy. Biophys. J. 2007;93:684–698. doi: 10.1529/biophysj.106.102087. [DOI] [PMC free article] [PubMed] [Google Scholar]
- 31.Rosales T., Georget V., Malide D., Smirnov A., Xu J., Combs C., Knutson J.R., Nicolas J.-C., Royer C.A. Quantitative detection of the ligand-dependent interaction between the androgen receptor and the co-activator, Tif2, in live cells using two color, two photon fluorescence cross-correlation spectroscopy. Eur. Biophys. J. 2007;36:153–161. doi: 10.1007/s00249-006-0095-1. [DOI] [PubMed] [Google Scholar]
- 32.Elson E.L., Magde D. Fluorescence correlation spectroscopy. I. Conceptual basis and theory. Biopolymers. 1974;13:1–27. doi: 10.1002/bip.1974.360130103. [DOI] [PubMed] [Google Scholar]
- 33.Rigler R., Elson E.L. Springer; Berlin: 2001. Fluorescence Correlation Spectroscopy. Theory and Applications. [Google Scholar]
- 34.Rigler R., Földes-Papp Z., Meyer-Almes F.J., Sammet C., Völcker M., Schnetz A. Fluorescence cross-correlation: a new concept for polymerase chain reaction. J. Biotechnol. 1998;63:97–109. doi: 10.1016/s0168-1656(98)00079-0. [DOI] [PubMed] [Google Scholar]
- 35.Skakun V.V., Hink M.A., Digris A.V., Engel R., Novikov E.G., Apanasovich V.V., Visser A.J.W.G. Global analysis of fluorescence fluctuation data. Eur. Biophys. J. 2005;34:323–334. doi: 10.1007/s00249-004-0453-9. [DOI] [PubMed] [Google Scholar]
- 36.Gennerich A., Schild D. Fluorescence correlation spectroscopy in small cytosolic compartments depends critically on the diffusion model used. Biophys. J. 2000;79:3294–3306. doi: 10.1016/S0006-3495(00)76561-1. [DOI] [PMC free article] [PubMed] [Google Scholar]
- 37.Müller J.D. Cumulant analysis in fluorescence fluctuation spectroscopy. Biophys. J. 2004;86:3981–3992. doi: 10.1529/biophysj.103.037887. [DOI] [PMC free article] [PubMed] [Google Scholar]
- 38.Friedrichsen D.M., Joazeiro C.A.P., Li J., Hunter T., Chory J. Brassinosteroid-insensitive-1 is ubiquitously expressed leucine-rich receptor serine/threonine kinase. Plant Physiol. 2000;123:1247–1255. doi: 10.1104/pp.123.4.1247. [DOI] [PMC free article] [PubMed] [Google Scholar]
- 39.Russinova J., Borst J.W., Kwaaitaal M., Yin Y., Caño-Delgado A., Chory J., de Vries S.C. Heterodimerization and endocytosis of Arabidopsis brassinosteroid receptors BRI1 and AtSERK3 (BAK1) Plant Cell. 2004;16:3216–3229. doi: 10.1105/tpc.104.025387. [DOI] [PMC free article] [PubMed] [Google Scholar]
- 40.Chen Y., We L.N., Müller J.D. Probing protein oligomerization in living cells with fluorescence fluctuation spectroscopy. Proc. Natl. Acad. Sci. USA. 2003;100:15492–15497. doi: 10.1073/pnas.2533045100. [DOI] [PMC free article] [PubMed] [Google Scholar]
- 41.Ruchira, Hink M.A., Bosgraaf L., van Haastert P.J.M., Visser A.J.W.G. Pleckstrin homology domain diffusion in Dictyostelium cytoplasm studied using fluorescence correlation spectroscopy. J. Biol. Chem. 2004;279:10013–10019. doi: 10.1074/jbc.M310039200. [DOI] [PubMed] [Google Scholar]
- 42.Rodríguez-Concepción M., Yalovsky S., Zik M., Fromm H., Gruissem W. The prenylation status of a novel plant calmodulin directs plasma membrane or nuclear localization of the protein. EMBO J. 1999;18:1996–2007. doi: 10.1093/emboj/18.7.1996. [DOI] [PMC free article] [PubMed] [Google Scholar]
- 43.Diévart A., Clark S.E. Using mutant alleles to determine the structure and function of leucine-rich repeat receptor-like kinases. Curr. Opin. Plant Biol. 2003;6:507–516. doi: 10.1016/s1369-5266(03)00089-x. [DOI] [PubMed] [Google Scholar]
- 44.Griffin B.A., Adams S.R., Tsien R.Y. Specific covalent labeling of recombinant protein molecules inside live cells. Science. 1998;281:269–272. doi: 10.1126/science.281.5374.269. [DOI] [PubMed] [Google Scholar]
- 45.Keppler A., Pick H., Arrivoli C., Vogel H., Johnsson K. Labeling of fusion proteins with synthetic fluorophores in live cells. Proc. Natl. Acad. Sci. USA. 2004;101:9955–9959. doi: 10.1073/pnas.0401923101. [DOI] [PMC free article] [PubMed] [Google Scholar]
- 46.Gadella T.W.J., Jovin T.M. Oligomerization of epidermal growth factor receptors (EGFR) on A431 cells studied with time-resolved fluorescence imaging microscopy. A stereochemical model for tyrosine kinase receptor activation. J. Cell Biol. 1995;129:1543–1558. doi: 10.1083/jcb.129.6.1543. [DOI] [PMC free article] [PubMed] [Google Scholar]
- 47.Verveer P.J., Wouters F.S., Reynolds A.R., Bastiaens P.I.H. Quantitative imaging of lateral ErbB1 receptor signal propagation in the plasma membrane. Science. 2001;290:1567–1570. doi: 10.1126/science.290.5496.1567. [DOI] [PubMed] [Google Scholar]
Associated Data
This section collects any data citations, data availability statements, or supplementary materials included in this article.
Supplementary Materials
Supplement