

Abstract
The permselectivity (permeance/conductance) of Cx43-comprised gap junctions is a variable parameter of junctional function. To ascertain whether this variability in junctional permselectivity is explained by heterogeneous charge or size selectivity of the comprising channels, the permeance of individual Cx43 gap junctions to combinations of two dyes differing in either size or charge was determined in four cell types: Rin43, NRKe, HeLa43, and cardiac myocytes. The results show that Cx43 junctions are size- but not charge-selective and that both selectivities are constant parameters of junctional function. The consistency of dye selectivities indicates that the large continuum of measured junctional permselectivities cannot be ascribed to an equivalent continuum of individual channel selectivities. Further, the relative dye permeance sequence of NBD-M-TMA ∼ Alexa 350 > Lucifer yellow > Alexa 488 ≫ Alexa 594 (Stokes radii of 4.3 Å, 4.4 Å, 4.9 Å, 5.8 Å, and 7.4 Å, respectively) and the conductance sequence of KCl > TEACl ∼ Kglutamate are well described by hindered diffusion through an aqueous pore with radius ∼10 Å and length 160 Å. The permselectivity and dye selectivity data suggest the variable presence in Cx43-comprised junctions of conductive channels that are either dye-impermeable or dye-permeable.
Introduction
Gap junctions are clusters of channels that connect the cytoplasms of adjacent cells and serve as intercellular conduits for diffusion of inorganic ions (electrical communication) and other small molecules (chemical communication). These channels are composed of two hemichannels, each consisting of six protein subunits called connexins (Cx). There are 21 genes in the human genome and 20 in the mouse genome that encode Cx proteins (1). The increasing number of hereditary diseases linked to Cx mutations (2), as well as the results of targeted deletion and replacement studies (2), provide increasing evidence for the importance of gap junctions in normal development and function of a diverse array of tissues, organs, and organ systems. Expression of the different Cxs, including Cx43, which is the focus of this study, varies with time, location, and physiological state (3,4). The presence of so many Cx types and the control of their expression suggest properties that are unique and specific to each.
The various Cxs form channels with different conductance, permeance, and selectivity properties (5), suggesting Cx-specific roles for gap-junction-mediated intercellular communication (6–8). The importance of electrical communication via gap junctions is well documented but does not alone necessitate so many Cx types. Modulation of electrical coupling could be accomplished by changes in channel number or open probability, resulting in a broad range of electrical communication levels independent of changes in channel conductance afforded by different Cx isoforms. Perhaps of equal importance, junctions composed of different Cx isoforms are able to uniquely discriminate among chemical signals that could diffuse intercellularly (9) and possibly differentially regulate this selectivity. Indeed, with regard to small inorganic ions, gap junctions are relatively nonselective (9–12); however, there is increasing evidence that some gap junctions can discriminate between very similar permeants of larger size (13–15). Understanding the basic principles leading to such discrimination should provide further insight into specific functional roles of communication via gap junctions formed of different connexins.
Gap-junction-mediated intercellular communication is typically measured in one of two ways: intercellular diffusion of fluorescent dyes (permeance) or passage of electrical current (conductance). The former is generally regarded as indicative of metabolic or chemical communication and the latter of electrical communication. For a simple, nonselective, cylindrical pore, the properties of permeance and conductance should be linearly related; as the number of open channels increases, both permeance and conductance should increase according to a defined and constant proportion. Comparison of electrical conductance and permeance of the same junction to either the small cationic dye NBD-M-TMA (16,17) or the slightly larger anionic dyes Lucifer yellow or calcein (18) reveal that these parameters are not well correlated for Cx43 channels. Indeed, the range of junctional permselectivity (junctional dye permeance/conductance; kdye/gj) values for Cx43 gap junctions varies across several orders of magnitude. These data suggest that Cx43 channels can adopt states with considerably different selectivity properties.
The aims of this study were to measure the charge and size selectivity of Cx43 junctions and to determine the extent to which the reported heterogeneity in junctional kdye/gj for Cx43 is due to heterogeneity in these selectivities. To do this, it was necessary to use an approach that could provide specific information about the charge or size selectivity of individual gap junctions. The approach used in this study was to simultaneously compare the permeance of individual Cx43 gap junctions to two dyes differing in either size or charge. This approach allowed for comparison of the permeance of the same Cx43 channels to molecules differing primarily by only one parameter (size or charge) and, as such, was ideal for determining the extent to which charge and size selectivity vary among different populations of Cx43 channels. We show that Cx43 junctions, as formed in several cell types, demonstrate a constant dye selectivity profile that is based solely on the size of the dye permeant. Thus, the previously observed interjunctional variation in permselectivity cannot be due to a similar interjunctional variation in the selectivity of the comprising Cx43 channels. Furthermore, the relative dye permeance sequence and unitary conductance data are consistent with hindered diffusion through a reasonably uniform aqueous pore with a radius of ∼10 Å.
Methods
Cells
Three rat Cx43 (rCx43)- and one mouse Cx43 (mCx43)-expressing cell lines were used: rat insulinoma cells stably transfected with rCx43 (Rin43) (from Dr. Paolo Meda) (19), HeLa cells stably transfected with mCx43 (HeLa43) (from Dr. Ross Johnson), normal rat kidney epithelial cells (NRKe, from Dr. Paul Lampe) that endogenously express rCx43, and fetal rat cardiac ventricular myocytes (from Dr. Joe Bahl), prepared as described (20), that also endogenously express rCx43. Generation of the rat Cx40 (rCx40)-expressing cell line (Rin40) was described previously (21). Rin43 and Rin40 cells were grown in RPMI (Sigma-Aldrich, Natick, MA) with 10% FBS and 300 μg/ml G418. HeLa43 cells were grown in Dulbecco's modified Eagle's medium (Sigma) with 10% FBS and 500 μg/ml G418. NRKe cells were grown in Dulbecco's modified Eagle's medium (Sigma) with 10% FBS. Cardiac myocytes were grown and maintained as previously described (20). All cells were maintained at 37°C in a 5% CO2 humidified incubator.
Electrophysiological measurements
The composition of solutions (in mM) was as follows. KCl internal solution: KCl 133.5, HEPES 8.6, EGTA 8.6, CaCl2 0.5, glucose 4.5, TEACl 8.6, Na2ATP 4.8, and MgCl2 2.9; Kglutamate internal solution: Kglutamate 128.5, HEPES 7.8, EGTA 7.8, CaCl2 0.4, glucose 4.1, TEACl 7.8, Na2ATP 4.3, and MgCl2 2.6; TEACl internal solution: TEACl 138.0, HEPES 8.4, EGTA 8.4, CaCl2 0.5, glucose 4.4, TEACl 8.4, Na2ATP 4.7, and MgCl2 2.8; External solution: NaCl 142.5, KCl 4, MgCl2 1, glucose 5, sodium pyruvate 2, HEPES 10, CsCl 15, TEACl 10, BaCl2 1, and CaCl2 1. The pH of all solutions was adjusted to 7.2 by addition of KOH and the osmolarity was adjusted to 315–320 mOsm/L by addition of H2O (Wescor 5520 osmometer; Logan, UT). Conductivities of the internal solutions, measured by conductivity meter (Model 2052, VWR, West Chester, PA), were (in mS/cm) 15.95 for KCl, 11.17 for Kglutamate, and 11.24 for TEACl.
Data collection
Cells were trypsinized (0.25% trypsin in Ca2+-and-Mg2+-free solution) and plated at low density on glass coverslips 4–24 h before experimental use. Coverslips were mounted in a chamber and bathed in external solution. Dual whole-cell voltage clamp experiments were performed on Rin43 cells as described previously (22). Briefly, electrodes were pulled from 1.2-mm filament glass (A-M Systems; Everett, WA) to resistances of 5–10 MΩ using a Sutter Instruments puller (Novato, CA) and filled with one of the internal solutions listed above. Gigaohm seals were established on both cells of a pair and direct access to the cytosol was obtained by light suction and ringing (capacitance overcompensation) of the electrode. Cell pairs were electrically uncoupled by suffusion of halothane to allow measurement of single-channel events. Single-channel recordings were made at a transjunctional voltage of 40 mV, with one cell held at 0 mV and the other at +40 mV or −40 mV (Axopatch 1C amplifiers, Axon Instruments, Burlingame, CA). Current signals were low-pass filtered at 100 Hz (LPF-202, Warner Instruments, Hamden, CT) and current and voltage signals were digitized (Digidata 1322A, Axon Instruments) and stored electronically using Clampex software (pClamp8, Axon Instruments) for subsequent analysis.
Data analysis
Current traces were notch-filtered at 60 Hz (Clampfit, Axon Instruments) to further reduce noise. Gap junction channel events were recognized as equal-amplitude but opposite-polarity events in the two current traces; for events lasting 50 ms or longer, transition amplitude was measured in the cell held at 0 mV using Clampfit and the data exported to Excel (Microsoft, Redmond, WA) for analysis. Conductance of these channel events was calculated according to Ohm's law:
| (1) |
where γj is the channel event conductance; ΔIjunction is the quantal change in junctional current amplitude; and ΔVjunction = Vcell 1 – Vcell 2.
The resulting conductance values were binned into 5-pS bins and event frequency histograms were generated and fit with Gaussian peaks using Origin software (Rockware, Golden, CO) to yield the final γj values.
Dye selectivity measurement
Filters and dyes
The junctionally permeable anionic dyes used (all from Molecular Probes, Invitrogen, Carlsbad, CA) were Lucifer yellow CH lithium salt (molecular weight 457), Alexa 350 hydrazide sodium salt (molecular weight 349), Alexa 488 hydrazide sodium salt (molecular weight 570), and Alexa 594 hydrazide sodium salt (molecular weight 759). The junctionally permeable cationic dye used was NBD-M-TMA {N,N,N-trimethyl-2-[methyl-(7-nitro-2,1,3-benzoxadiol-4-yl)amino]ethanaminium} (23). The junctionally impermeable dextran dyes used (Molecular Probes) were Alexa Fluor 488 dextran (molecular weight 3000) or tetramethlyrhodamine dextran (molecular weight 3000). Physical properties of these dyes are summarized in Table 1. Dye spectra and the filter sets used to visualize each dye can be found in Supplementary Material.
Table 1.
Physical properties of permeants
| Molecular weight (no counterion) | DAqueous (25°C) (10−6 cm2/s) | Stokes-Einstein radius (Å) | λex/λem (nM) | Net charge | |
|---|---|---|---|---|---|
| NBD-M-TMA | 280 | 5.8* | 4.3 | 458/580 | 1+ |
| Alexa 350 | 326 | 5.6* | 4.4 | 345/445 | 1− |
| Lucifer yellow | 443 | 5.0* | 4.9 | 428/536 | 2− |
| Alexa 488 | 546 | 4.2* | 5.8 | 493/517 | 2− |
| Alexa 594 | 734 | 3.3* | 7.4 | 588/613 | 2− |
| K | 39 | 19.6† | 1.3 | — | 1+ |
| Cl | 35 | 20.3† | 1.2 | — | 1− |
| TEA | 130 | 9.7† | 2.9 | — | 1− |
| Glutamate | 164 | 9.7‡ | 2.9 | — | 1+ |
Calculated using Wilke-Chang correlation (see Methods).
Calculated from mobility (32).
Assumed equal to TEA due to similar solution conductivities.
Calculation of dye aqueous diffusion constant and Stokes-Einstein radii
Diffusion constants for each of the dyes were calculated according to the Wilke-Chang correlation (24),
| (2) |
where Ddye is the dye diffusion constant (cm2/s); M is the molecular weight of the solvent (g/mol); T is temperature (298°K); η represents the solvent viscosity (centipoise) (0.89 for H2O at 298°K); and V is the molar volume of dye (cm3/mol), calculated using Schroder increments ((cm3/mol) of +7 for each C, H, O, N, and double bond, +21 for each S, and −7 for each ring) for prediction of molar volumes (27).
The resulting values were then used to calculate Stokes-Einstein radii for each dye (25,26) using
| (3) |
where Rdye is the Stokes-Einstein radius of the dye (Å); Ddye is the dye diffusion constant (cm2/s); η is the solvent viscosity (centipoise) (0.89 for H2O at 298°K); K is Boltzman's constant (1.38 × 10⁻²³ J/°K); and T is temperature (298°K).
Data collection
Cells were trypsinized and replated on glass coverslips 4–48 h before study. The coverslips were mounted in a chamber that was placed on and secured to the stage of a fluorescent microscope (IX71, Olympus, Melville, NY). Injection electrodes (pulled from thin-walled 1.0-mm glass to 15–30 MΩ resistance when backfilled with 3 M KCl) were filled via capillary action with a dye mixture that included: 2.5 mM Alexa 350, 1 mg/ml labeled dextran (Alexa 488 or rhodamine), and either 2.5 mM NBD-M-TMA, 2.5 mM Alexa 488, or 1 mM Alexa 594 in internal electrophysiology solution (KCl; see above) and backfilled with 3 M KCl. The dye mixture was injected into one cell of a pair by “ringing” the electrode, which deposited a single bolus of dye, followed by immediate removal of the electrode. Sets of fluorescent images with the appropriate filter sets (see Supplementary Material) were then taken at regular intervals with a CCD camera (CoolSnap ES from Photometrics driven by V++ software); each image set contained images for each dye that were taken at 5-s intervals (with intervening switch of the filter sets necessary for the dye-specific image). Timing of images and exposure durations were controlled by a program written in V++, which controlled both the camera and light-source shutter, allowing for cells to be exposed to excitation light only during image capture. This reduced the impact of photobleaching (exposure times <500 ms) and allowed for excellent reproducibility in the timing of images. These images were labeled and stored in the computer for future analysis.
Data processing
Fluorescence intensity was measured using ImageJ software (public domain; http://rsb.info.nih.gov/ij/download.html). The images acquired for each pair were stacked in chronological order. An analysis area was then selected that encompassed the entire donor or recipient cell and the total intensity of the pixels in this selected area was measured for each frame. A selection area outside but near the cell pair was similarly analyzed for background fluorescence. This was repeated for all images in the stack for each dye and the values were exported to a spreadsheet (Excel) for analysis.
Data analysis
Analysis of the diffusion of dyes between the two cells was performed based on Fick's equation for diffusion between two compartments, as previously described (28,29), with modification as follows:
| (4) |
Since concentration (C) is proportional to fluorescence intensity (F), then
| (5) |
where F(t) is the total fluorescence in the cell at time t; Feq is the total fluorescence in the cell at equilibrium; F(0) is the total fluorescence in the cell at the time of the first image; and B is the rate constant describing permeance of the junction.
To best fit the data from this study, two modifications to the above equation were made. To determine permeance for junctions where Feq for one or both dyes was not observed, Feq for the donor and recipient cells was defined as follows (modification 1):
or
| (6) |
where V represents volume, Vtotal = Vdonor + Vrecipient, Ftotal(to) = Fdonor(to) + Frecipient(to), and t0 is the time of the first image of the sequence of images taken during the experiment. Vdonor/Vtotal and Vrecipient/Vtotal were defined by a single parameter, Vratio = as follows: Vdonor/Vtotal = Vratio/(Vratio + 1) and Vrecipient/Vtotal = 1/(Vratio + 1). Vratio was best fit when intercellular diffusion approached equilibrium. In cases where the more slowly diffusing dye did not approach equilibrium, the volume ratio from the more quickly diffusing dye was used for both dyes; if neither dye approached equilibrium, Vratio was set to 1.
To account for dye loss due to photobleaching or leakage, a factor describing the decrease in total intensity of dye in the two-cell system over time was incorporated (modification 2). This was done by combining the total intensity from the donor and recipient cells at each time point, yielding the total intensity (Ftotal(t)), and then determining Ftotal(t/t0) = Ftotal(t)/Ftotal(t0) for each time point. With these modifications, the final form of Eq. 5 becomes
| (7) |
Fluorescence as a function of time data for both the donor and recipient cells were fit simultaneously using the above formula and the solver feature in Excel set to minimize root mean-squared deviations between observed and predicted values as parameters B and Vratio were varied.Equation 7 can be rearranged to the form
| (8) |
where the permeance rate constant B is defined as the slope of a linear relationship between the two parameters –ln((Feq – F(t)/Ftotal(t/t0))/(Feq – F(0))) and time (T). If the data were not fit by a line of constant slope, then the rate constant, and therefore the permeance, was not constant throughout the experiment; such data (<10% of junctions) were discarded. Cell pairs in which the decrease in intensity in the donor cell was noticeably faster than the increase in intensity in the recipient cell or where the exponential rate constant (Bloss) describing the rate of loss in total intensity (donor + recipient) over time was >0.1 min−1 likely indicated damage to the cell by injection; these data were also not included. This occurred in ∼10–20% of junctions. To accurately fit higher permeance pairs to a single rate constant, it was necessary to have at least two images after the first image of a sequence where the intensity in the recipient was detectably increasing. This eliminated some (<5% of all junctions) of the highest-permeance cell pairs. For the lower-permeance junctions, only those junctions in which the intensity of the recipient detectably increased between all images during the time of measurement were included. This eliminated some (<5% of all junctions) of the lowest permeance cell pairs.
Rationale for and suitability of modification 1
Since channel number, open state, and even selectivity could be acutely regulated, determining the selective properties (size and charge) of specific Cx43 junctions requires simultaneous measurement of two dyes differing in either size or charge characteristics. For dyes with substantially different intercellular diffusion rates, for example, Alexa 594 compared to Alexa 350, the need for simultaneous measurement required deriving permeance values from nonequilibrium data for the slowly diffusing dye. This was accomplished by using the cell volume ratio value derived from the quickly diffusing dye for fitting of the slowly diffusing dye. The appropriateness of these strategies is evaluated here.
To determine whether rate constants derived from the whole time course of intercellular diffusion differed from those derived from just the early portion, two comparisons were made using data from a junctional selectivity experiment where intercellular diffusion was monitored to equilibrium for both Alexa 350 and Alexa 594 (∼1.5 and 60 min, respectively (see Fig. 4)). First, the rate constant for Alexa 594, determined by fitting all time points (0.073 min−1), was not obviously different from that determined by fitting only those points occurring before equilibrium of Alexa 350 (0.069 min−1). Second, using the plot of –ln((Feq – F(t)/Ftotal(t/t0))/(Feq – F(0))) versus time (T), the rate constants derived by regression analysis of all time points (0.072 min−1) versus only early time points (0.071 min−1) were not obviously different. These comparisons demonstrate that fitting the early time points of a longer time course of intercellular dye diffusion adequately describes the dye permeance of a junction.
Figure 4.
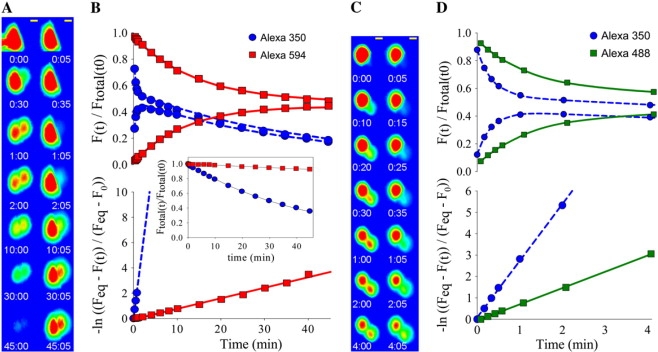
Dual dye size selectivity measurement method. (A) Results from a typical dye experiment showing intercellular dye diffusion over time for Alexa 350 (left) and Alexa 594 (right). Yellow scale bar, 10 μm. (B, upper graph) Total cell fluorescence intensity values for donor (upper curves) and recipient (lower curves) cells normalized to the total (donor + recipient) intensity of the first image. Curves represent the fits of the data by Eq. 7 to determine the rate constants (Bdye) of diffusion (BAlexa350 = 2.8 min−1 and BAlexa594 = 0.08 min−1). (B, inset) Loss in total fluorescence intensity (donor + recipient) over time. The lines are fits to an exponential decay function with rate constants of 0.02 min−1 (Alexa 350) and 0.002 min−1 (Alexa 594). (B, lower graph) Plot of the intensities from the upper graph converted using Eq. 8 (see Methods). Lines represent linear regressions, the slopes of which equal the diffusion rate constants (BAlexa350 = 2.7 min−1 and BAlexa594 = 0.08 min−1). (C) Results from a typical dye experiment showing dye transfer over time for the same cell pair for Alexa 350 (left) and Alexa 488 (right). Yellow scale bar, 10 μm. (D, upper graph) The resulting total cell fluorescence intensity values for donor (upper curves) and recipient (lower curves) cells normalized to the total (donor + recipient) intensity of the first image. Curves represent fits of the data by Eq. 7 (BAlexa350 = 2.96 min−1 and BAlexa488 = 0.77 min−1). (D, lower graph) Plot of the intensities from E converted using Eq. 8. Lines are linear regressions, the slopes of which represent the diffusion rate constants (BAlexa 350 = 2.81 min−1 and BAlexa 594 = 0.76 min−1).
To verify that the volume ratio values determined for dyes with rapid versus slow intercellular diffusion rates were comparable, we derived these values from dual dye experiments where dye diffusion approached equilibrium for both Alexa 350 and Alexa 594, the two dyes showing the largest difference in intercellular diffusion rates. The volume ratios for Alexa 350 and Alexa 594 for one such junctional experiment were 1.09 and 1.02, respectively (see Fig. 3). In addition, the average volume ratios obtained for each dye from four cell pairs that were connected by cytoplasmic bridges, where both dyes were followed to equilibrium, were 1.03 and 1.07 for Alexa 350 and 594, respectively. All of these cell pairs consisted of two cells that appeared visually similar in volume. These data indicate no significant tendency for either Alexa 350 or Alexa 594 to remain bound in the donor cell; thus, the volume ratio obtained during fitting of Alexa 350 intercellular diffusion can be used to fit Alexa 594 data.
Figure 3.
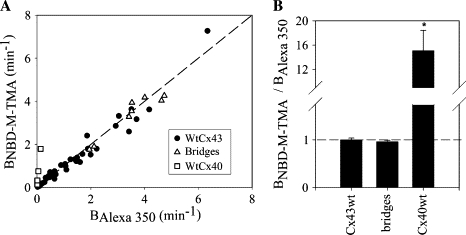
Cx43 junctions are not charge-selective for diffusion of dyes. (A) Rate constants for NBD-M-TMA (BNBD-M-TMA) versus Alexa 350 (BAlexa 350) for multiple Cx43 junctions (solid circle) (n = 4, HeLa43; n = 12, Rin43; n = 25, NRKe; and n = 1, cardiac ventricular myocytes), cytoplasmic bridges (open triangles, n = 8), and Cx40 junctions (open squares, n = 6, Rin40). The dashed line represents relative calculated aqueous diffusion constants for NBD-M-TMA/Alexa 350 (Table 1). (B) Average BNBD-M-TMA/BAlexa350 (charge selectivity) for junctions shown in A. The dashed line represents relative calculated aqueous diffusion constants for NBD-M-TMA/Alexa 350. (asterisk) Cx40 junctions were significantly different (p < 0.05) from both Cx43 junctions and cytoplasmic bridges. Selectivity of Cx43 junctions was not significantly different from that of bridges.
Dual dye technique applied to cytoplasmic bridges and Cx40-comprised junctions
Before complete cytokinesis, a cytoplasmic bridge connects apparently distinct cells. These bridges are readily permeated by molecules of >3000 Da molecular mass, as well as by small, charged molecules such as the dyes used in this study (16). Cytoplasmic bridges should be revealed as non-charge-selective by the dual dye injection and analysis technique used in this study. To verify this, cell pairs were injected with a mixture of Alexa 350, NBD-M-TMA, and rhodamine-dextran; when the rhodamine dextran diffused rapidly from the injected donor to the recipient cell, the presence of a cytoplasmic bridge was concluded. The rate constants for intercellular diffusion of the NBD-M-TMA and Alexa 350 were determined as described above, and their relative permeance was calculated. As expected, the results (see Fig. 3) were consistent with a non-charge-selective pathway for diffusion of molecules between the cells, with all points falling near the line of unity (mean BNBD-M-TMA/BAlexa 350 = 0.99 ± 0.06, n = 7); the two permeances were significantly well correlated (r = 0.93; p < 0.05).
Several studies (10,30,31) have shown that Cx40-comprised junctions display cation selectivity. To demonstrate that the dual dye technique can detect such charge selectivity, we injected pairs of Rin40 cells with NBD-M-TMA, Alexa 350, and rhodamine dextran for detection of bridges. The average BNBD-M-TMA/BAlexa 350 for Cx40 junctions revealed by six such experiments was 15.1 ± 3.35 (see Fig. 3 B), with all of the points falling above the line of unity (see Fig. 3 A).
Relationship of rate constant to permeance
Channel permeability to a molecule is the product of the effective diffusion constant (length2/time) within the channel and a dimensionless partition coefficient divided by the length of the channel (32). The product of permeability (length/time) and concentration difference (molecules/length3) across the channel then predicts a rate/unit of area (molecules/time/length2) for flux of molecules through the channel for a given difference in concentration across the channel. In the case of junctional permeability, the contributions of all permeable channels per unit area of junctional membrane are considered together. Without an accurate knowledge of the cross-sectional area of a channel or junction, the parameter that is often described is the product of channel or junctional area and permeability, which is termed permeance (volume/time) (18,33,34). Permeance (Pdye) of a junction predicts a rate of dye flux across the junction at a given concentration gradient. This flux rate is determined by measuring the rate of change in fluorescence and, thus, concentration in the recipient cell, which is proportional to the flux rate divided by the recipient cell volume. In the absence of a cell volume measurement, the resultant parameter is a rate constant (time−1). Equations 7 and 8, above, were used to fit the data to an exponential rate constant (Bdye) (time−1) that is proportional to the permeance according to cell volume (see below). Comparison of individual rate constants as a measure of relative permeance is thus rigorously valid only for cells with identical volumes. Such relative comparisons in this study were done only across the same junction, so that the actual volume of the cells need not be determined. The rate constant Bdye can be related specifically to Pdye by arrangement of the derivative of Eq. 4 with respect to time:
| (9) |
which is similar to that for permeance:
| (10) |
If the two cells are equal in volume and all dye is available to diffuse, then
| (11) |
and
| (12) |
Cytoplasmic resistance was not significant relative to junctional resistance
Some studies that have measured intercellular dye diffusion via gap junctions between Xenopus ooctyes have characterized the resistance to diffusion of the cytoplasm, so that its contribution to intercellular permeance measurements could be accounted for (7,34). This was necessitated in those studies, in large part, by the relatively large volume (∼1 μL) of the Xenopus cells (34). In this study, the smaller-volume (∼1 pL) mammalian cells used were treated as two well stirred compartments for analysis. For this to be the case, diffusion through the gap junction must be substantially rate-limiting relative to diffusion in the cytosol. Evidence for this from the study presented here was that, even in the largest cells, there was no apparent redistribution of dye within individual cells even between the first and second images (10- to 15-s interval). This indicated that each cell was behaving as a well stirred compartment; thus, the permeance values obtained for dye diffusion between cells could be taken as indicative of the permeance of the connecting gap junction.
Results
Cx43 junctions are not charge-selective
The charge selectivity of Cx43-comprised junctions has previously been tested using current-carrying ions (KCl, TEACl, Kglutamate, and TEA-Asp) and electrophysiological approaches. In most cases (12,35,36), the fully open channel was revealed as nonselective, but in at least one case, cation selectivity was reported (11). The latter study explored Cx43 channel behavior in a cell type different from those used in the former studies, raising the possibility that selectivity could differ in a cell-specific manner. Consequently, we determined the channel conductance of Cx43 channels in Rin43 cells—one of the cell types used here for the dye selectivity studies that was not used in the above-mentioned studies (12,35,36)—using KCl, TEACl, and Kglutamate as the prominent current-carrying ions. Frequency histograms of channel event conductances for each salt solution (Fig. 1 A) were well fit with single Gaussian peaks revealing conductances of 104.6 ± 0.3 pS (KCl), 69.7 ± 0.3 pS (TEACl), and 67.5 ± 0.4 pS (Kglutamate). Comparison of these conductances to the conductivity of each of the salt solutions (Fig. 1 B) showed that the values for both TEACl and Kglutamate were very near the values predicted by the solution conductivities relative to KCl. These data indicate that Cx43 forms a conductive pathway that is nonselective with regard to charge. The measured values for both TEACl and Kglutamate fell slightly below the predicted conductance values, indicating a very modest size selectivity of Cx43 channels for molecules in this size range.
Figure 1.
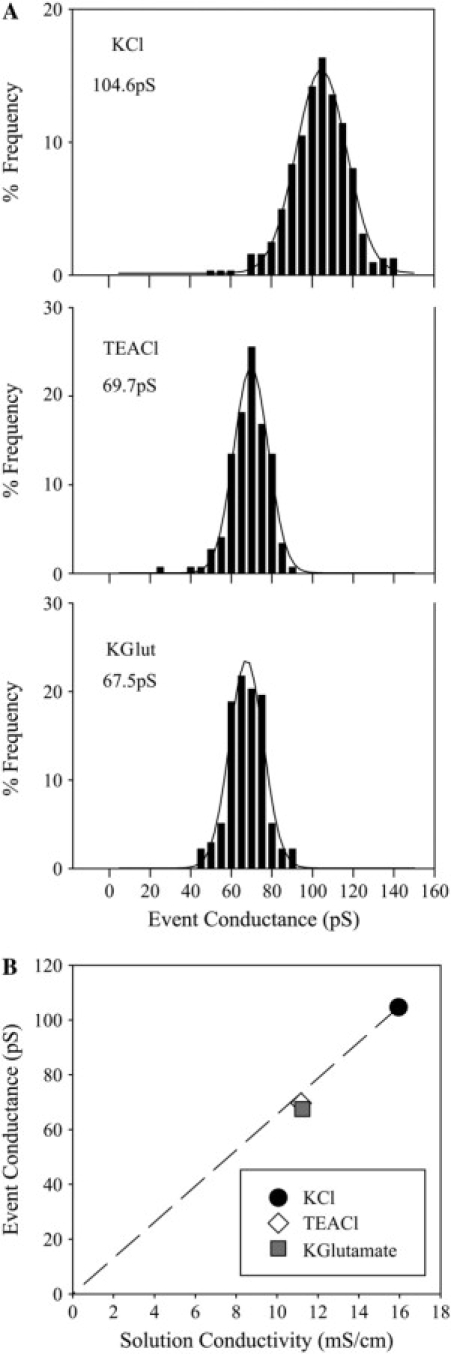
Cx43 conductance measurements show a lack of charge selectivity among ions. (A) Channel event conductances (40 mV transjunctional voltage) determined from fitting channel event frequency histograms with single Gaussian peaks for KCl (324 events, two preparations), TEACl (148 events, one preparation), and Kglutamate (138 events, one preparation). (B) Plot of channel event conductance versus solution conductivity for Cx43wt junctions measured using KCl (solid circle), TEACl (open diamond), and Kglutamate (solid square) as primary-current-carrying ions. The dashed line represents conductances relative to KCl predicted by solution conductivities.
It has been suggested (17,18) that the heterogeneity in permselective properties of Cx43 channels could reflect enhanced or reduced dye flux relative to ionic current due to regulated changes in charge selectivity of these channels. To test the possibility that charge selectivity differences might sometimes occur for larger dye molecules that may not be easily resolved by comparing conductances of smaller ions, we determined the relative permeances of individual Cx43-comprised gap junctions to dyes of similar size but opposite charge, NBD-M-TMA (1+, 4.3 Å) and Alexa 350 (1−, 4.4 Å). These dyes can be visualized independently using appropriate filter sets (see Supplementary Material); thus, their passages across the same junction can be monitored essentially simultaneously. After injection of one cell of a pair, the movement of dye from the injected cell to the neighboring recipient cell was monitored over time (Fig. 2 A). Fluorescence intensity values from the resulting images for the donor and recipient cells were fit with an exponential rate constant for each dye (Bdye; see Eqs. 7 and 8) (Fig. 2, B). These rate constants were then compared to give a relative permeance or selectivity of the junction. Data from multiple Cx43-expressing cell pairs revealed that the average BNBD-M-TMA/BAlexa350 was 1.00 ± 0.03, n = 42 (Fig. 3 B). A plot of these data points (Fig. 3 A) showed that they were well approximated by the slope of unity (nonselective) and were significantly well correlated (r = 0.98, p < 0.05). Thus, although the dual dye technique could detect charge-selective junctions when they were present (see Cx40 data, Fig. 3), the results of the Cx43 dual dye charge selectivity experiments indicated a constant lack of charge selectivity for Cx43-comprised gap junctions across a wide range of permeance rate constants (∼250-fold in 42 cell pairs) in four different cell types.
Figure 2.
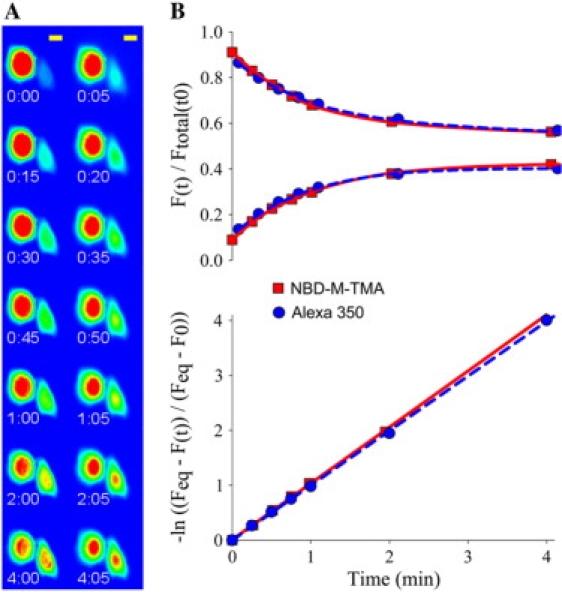
Dual dye charge selectivity measurement method. (A) An image sequence from a typical experiment comparing NBD-M-TMA (left column) to Alexa 350 (right column) (false color) (NRKe cells). Yellow scale bar, 10 μm. (B) Experimental data from A plotted as a function of time either as fluorescence normalized to total intensity (donor + recipient) at t0 (upper panel) or as the –ln((Feq – F(t)/Ftotal(t/t0))/(Feq – F(0))) (Eq. 8) (lower panel). Data from both dyes are well fit to a single rate constant (1.0 min−1) by Eq. 7 (upper panel) or by linear regression of data points converted using Eq. 8 (lower panel), as evidenced by the fit lines through the data points.
Cx43 size-selectivity sequence is constant and well predicted by dye molecule size
The data presented above indicate that the observed heterogeneity in Cx43 junctional permselectivity (kdye/gj) does not result from similar heterogeneity in junctional charge selectivity. Heterogeneous junctional permselectivity could also result from channel configurations that variably restrict the passage of large versus small molecules. To test for possible heterogeneity in junctional size selectivity, the permeance of individual Cx43-comprised junctions to dyes of similar charge but different size was compared (Fig. 4). The dyes used for these experiments were Alexa 350, Lucifer yellow, Alexa 488, and Alexa 594 (characterized in Table 1). Results of experiments for Alexa 350 versus either Lucifer yellow, Alexa 488, or Alexa 594 (Fig. 5) showed significant correlation between the permeances of the dyes (r = 0.99, 0.99, and 0.93, respectively; p < 0.05 for all three). This excellent correlation between permeances of dyes of different sizes indicates a consistent size selectivity between the dye molecules for Cx43 junctions with a broad range of permeance rate constants (∼100-fold in 67 cell pairs consisting of 12 Lucifer yellow, 28 Alexa 488, and 27 Alexa 594). Thus, heterogeneous permselectivity of Cx43 junctions (17,18) is not explained by an equivalent heterogeneity in the size selectivity of dye-permeable Cx43 channels. Additionally, the trend of relative permeances (BLucifer yellow/BAlexa350 = 0.35 ± 0.02; BAlexa488/BAlexa350 = 0.27 ± 0.01; BAlexa594/BAlexa350 = 0.029 ± 0.002) is consistent with what is expected from diffusion through a simple channel pore for which the diameter of Alexa 594 approaches the limiting diameter of the pore.
Figure 5.
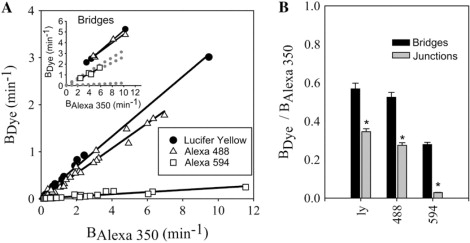
Cx43 junctions show constant size selectivity. (A) Plot of permeance rate constants (Bdye) for Lucifer yellow (solid circles) (Rin43, n = 6; NRKe, n = 3; HeLa43, n = 3); Alexa 488 (open triangles) (NRKe, n = 14; Rin43, n = 9; HeLa43, n = 5); and Alexa 594 (open squares) (NRKe, n = 11; Rin43, n = 10; HeLa43, n = 2; cardiac ventricular myocytes, n = 2) versus Alexa 350 (BAlexa 350) from individual cell pairs for Cx43wt junctions. Lines are linear regressions for each dye combination. All combinations were significantly correlated (p < 0.05). (Inset) The same plot as in A for cytoplasmic bridges, where the dotted lines represent the regression fits from junctions. (B) Average BAlexa dye/BAlexa 350 of experiments shown in A. (asterisk) All dye combinations are significantly different (p < 0.05) from cytoplasmic bridges for the same dye combination.
Size selectivity is not simply due to differences in cytoplasmic diffusion
To test whether the observed size selectivity was simply a result of the relative abilities of the dyes to diffuse freely in the cytoplasmic environment, the permeances for Lucifer yellow, Alexa 488, and Alexa 594 relative to that for Alexa 350 were determined for cytoplasmic bridges (incompletely divided cells) using the dual dye technique. Cytoplasmic bridges were detected by their ability to pass 3000-Da dextran dyes, which are too large to pass through gap junctions. The relative permeances (BLucifer yellow/BAlexa350 = 0.57 ± 0.03; BAlexa488/BAlexa350 = 0.50 ± 0.02; BAlexa594/BAlexa350 = 0.27 ± 0.02) (Fig. 5) presumably represent the relative diffusion constants for the dyes in the cytoplasmic environment, which would be expected to be inversely proportional to the size of the molecule, as seen here. Table 1 shows calculated aqueous diffusion constants (Eq. 2) for each of the dyes used in this study. The relationship between these calculated aqueous diffusion constants for the dyes used to measure size selectivity (DLucifer yellow/DAlexa350 = 0.89; DAlexa488/DAlexa350 = 0.75; DAlexa594/DAlexa350 = 0.59) was somewhat different from the cytoplasmic bridge relative permeances above. These differences are likely due to increased hindrance of diffusion of larger molecules in the cytoplasm (37). Despite these increased size selectivities in the cytoplasm compared to those predicted by aqueous diffusion constants, the size selectivities across Cx43 junctions were significantly different from those for cytoplasmic bridges for Lucifer yellow (BAlexa350/BLucifer yellow = 3.0 ± 0.1 (junctions) versus 1.8 ± 0.1 (bridges)), Alexa 488 (BAlexa350/BAlexa488 = 3.7 ± 0.2 (junctions) versus 2.0 ± 0.1 (bridges)), and Alexa 594 (BAlexa350/BAlexa594 = 37 ± 2 (junctions) versus 3.8 ± 0.4 (bridges)) (Fig. 5). This indicates that the extent of size selectivity observed across Cx43 junctions was not due simply to differences in cytoplasmic diffusion of each of the dyes but rather was also due to greater restriction of diffusion of larger dyes by the Cx43 channels themselves. Additionally, no redistribution of dye in each individual cell was observed over time (Fig. 4). This indicates that the cells behaved as well stirred compartments, and that permeance measurements were indeed indicative of the permeance of the gap junction and not diffusion in the cytoplasm.
Diffusion of multiple dyes through Cx43 channels is independent
The permeance sequence (Alexa 350 > Lucifer yellow > Alexa 488 ≫ Alexa 594) found in this study is what is expected based on the relative sizes of the dye molecules and the proposed size of the Cx43 channel (11,38), but it is different from that derived from comparison of the permselectivity values for each of the dyes measured separately (7,39). In the latter studies, the intermediately sized Alexa 488 displayed a higher permselectivity than either Alexa 350 or Alexa 594. It was also suggested (7) that Alexa 488 was more permeable than Lucifer yellow. To determine whether differences in the permeance sequence stemmed from interactions between the dyes in the dual dye experiments, the permeance of Cx43 junctions was determined for each of these dyes individually by injecting only the dye to be tested along with a labeled dextran for detection of cytoplasmic bridges. No significant difference in average permeance rate constant was detected for any of these dyes when measured alone or in concert with another dye (Fig. 6). These data indicate the absence of any interaction between the dyes that significantly affects their permeance through Cx43 channels.
Figure 6.
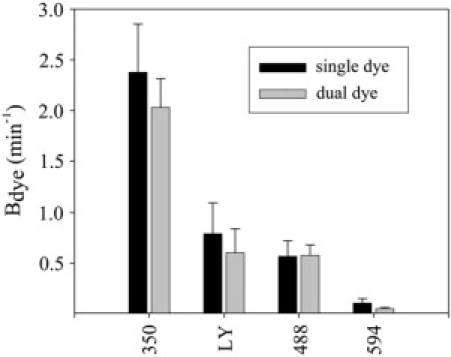
Dye diffusion is independent in dual dye measurements. Plot of average rate constants for Alexa 350, Lucifer yellow, Alexa 488, and Alexa 594 from the dual dye size selectivity experiments (dual dye) from NRKe and Rin43 cells (Alexa 350, n = 53; Lucifer yellow, n = 9; Alexa 488, n = 23; Alexa 594, n = 21) compared to the average rate constant for each dye when injected alone (single dye) using the same cell types (Alexa 350, n = 23; Lucifer yellow, n = 7; Alexa 488, n = 10; Alexa 594, n = 9). None of the dyes showed significantly different rate constants when measured alone compared to when measured in concert with another dye.
Discussion
Recently published data show that junctional permselectivity (the quotient of a junction's dye permeance and its conductance) varies over several orders of magnitude for Cx43-comprised junctions (17,18). This heterogeneous junctional permselectivity suggests the presence of multiple selectivity states for Cx43 channels. The two most obvious criteria for discriminating between permeants in specifying channel selectivity are their size and charge. Thus, one goal of this study was to determine whether variability in charge or size selectivity of Cx43 channels could explain the observed heterogeneity in junctional permselectivity. Several approaches to test this were considered. Although comparison of permselectivity values for individual dyes is sufficient to demonstrate differences in permselective properties between junctions, it is insufficient to determine the extent to which charge or size is important for this variability, as there are possible differences in both size and charge of the dye permeants and the current-carrying ions used for the measurement. Conversely, comparison of the average junctional permeances to individual dyes can demonstrate the average size or charge selectivity of junctions, but the extent to which these selectivities could vary cannot be distinguished from variability in channel number between junctions. The simultaneous measurement of the permeance of a single gap junction to multiple dyes of differing size or charge done in this study allowed for direct determination of the relative permeance or selectivity of the same population of channels to the dyes being tested. If different junctions displayed different selectivities for the parameter (size or charge) being measured, it would be readily apparent from the comparison of permeance rate constants for the two dyes across each junction. Simultaneous measurement of multiple dyes was thus ideally suited both to determine selectivity of individual gap junctions and to detect any differences in the selectivity properties of junctions from one cell pair to the next. Additionally, since the comparison of rate constants was done across the same junction, the measurement of cell volumes needed to make a valid comparison of permeance rate constants between different cell pairs is obviated.
Comparison of charge selectivity data to previously published work
The results of the charge selectivity experiments in this study are consistent with previously published data. Using technical approaches somewhat different from those used here, others have compared the permeance of Cx43 junctions to dyes of differing charge and found no consistent trend for discrimination between the dyes based on charge (5,12,40). Additionally, the comparison of single-channel conductances using different salt solutions in this study also indicated a lack of charge selectivity among current-carrying ions. This is also consistent with data from other studies using the same approach (35,36) or a reversal potential strategy (12). These combined results point to a consistent lack of charge selectivity for Cx43 gap junctions and channels that are not forced into a residual subconductance state by large (≥60 mV) transjunctional voltages. In addition, the results of the Cx40 dual dye charge selectivity experiments (∼15:1 cationic selectivity) were similar to published selectivities found by comparing the permeance of the same dyes used in this study but measured separately (40) or using electrophysiological measurements (10,31).
Comparison of size selectivity data to previously published work
Studies done by Weber et al. (7) and Dong et al. (39) are the only studies in which the permeance of Cx43 channels to each of the Alexa dyes (350, 488, 594) used herein was determined in a manner suitable for comparison to the values found in this study. In those studies, the permselectivity of Cx43 junctions was determined separately for each of these dyes. The permselectivity sequences relative to Alexa 350 of ∼1:2:0.5 (7) and ∼1:3:1 (39) for Alexa 350, 488, and 594, respectively, are not entirely consistent with the relative permeance sequence of ∼1:0.25:0.025 found in this study. The reasons for the disparate results are not clear but could reflect several factors. Differences in technical approach would not (necessarily) be expected to lead to the disparate results. Some degree of error could result from measurement of the conductance of junctions with the high levels of electrical coupling found in both the Dong and Weber studies. Both studies, however, addressed the impact of such error in an apparently appropriate fashion. Errors in measuring junctional dye permeances could also arise from the impact of photobleaching and leakage of dye across the nonjunctional membrane. A comparison of Ftotal(t)/Ftotal(t0) values (see Methods) at equivalent time points in this study showed that loss in intensity over time was approximately 10 times faster for Alexa 350 and Lucifer yellow than for either Alexa 488 or 594 (Fig. 4 B, inset). The rate of dye intensity loss of Alexa 350 and Lucifer yellow (Bloss ∼ 0.02 min−1) relative to the rate of intercellular diffusion was not sufficiently large to have a significant impact on measured permeances in this study, for which intercellular dye diffusion was typically complete in <10 min. However, the slow rates of transfer (Bdye ∼ 0.2 min−1) found in HeLa43 cells by Dong, and the long duration of experiments (>5 h) in oocytes by Weber could increase the significance of the loss in intensity of Alexa 350 in measuring junctional dye permeance. The impact of this loss in intensity, however, would not necessarily be expected to explain the extent of the difference in the relative permeance sequences. Alternatively, Cx43 channels could display an additional selectivity state not present in this study that could explain the disparate results. To address possible cell-specific regulation of Cx43 selectivity we measured the dye-selective properties of Cx43 junctions formed by four different cell types: Rin43, NRKe, HeLa43, and fetal rat cardiac ventricular myocytes. The junctional size and charge selectivities were similar for all of the cell types.
Comparison of permeance values to previously published work
The most appropriate measure for the specific description of ease of diffusion through a gap junction is permeance (permeability × total cross-sectional area of the junction) (18,33,34). The rate constant (Bdye) from this study can be converted to junctional permeance (volume rate) by multiplying Bdye by half the cell volume (Eqs. 8–11). If all cells are assumed to have a volume of 1 pL, the resulting average junctional permeance values were (in mm3/s) ∼2.0 × 10⁻⁸ (NBD-M-TMA and Alexa 350), ∼6.0 × 10⁻⁹ (Lucifer yellow), ∼5.0 × 10⁻⁹ (Alexa 488), and ∼5.0 × 10⁻¹⁰ (Alexa 594). Specific comparisons with permeance values from other studies are limited by the fact that junctional permeances are dependent on open channel number, which is not directly available from this study. However, the average junctional permeance for NBD-M-TMA in this study was similar to that found by Ek-Vitorin (17) (∼2.0 × 10⁻⁸ mm3/s) in the same cell types (Rin43 and NRKe) using a somewhat different approach.
Channel pore radius estimated from relative dye permeances and channel conductances
If the Cx43 channel behaves as a simple mechanical filter discriminating solely on the basis of permeant size, the relative permeability sequence (Table 2) of the molecules of different sizes used for the size selectivity experiments (Fig. 5) can be used to estimate the Cx43 channel pore radius according to the following formula (11,41):
| (13) |
where P is the permeance, α is the permeant radius/pore radius, and C is a scaling factor. Based on the ratio of permeant to pore radii (α), this formula predicts the extent to which the effective diffusion constant of a molecule is decreased in a simple aqueous pore relative to bulk aqueous solution. This decrease in effective diffusion constant is due primarily to two effects. The (1 – α)2 term describes the impact of the entire cross section of the channel not being available to each ion. The remaining term describes the effect of solvent drag on a sphere moving through an aqueous cylinder. The combined effect of solvent drag and available cross-sectional area reduces the permeance (diffusion constant × partition coefficient × channel area/channel length) for each dye. As such, Eq. 13 can be used to generate a predicted relative permeability sequence for a given channel pore radius (41). A plot of the permeance relative to Alexa 350 versus hydrodynamic radius for each of the dyes (Fig. 7) was best fit with a channel radius of ∼10 Å. Lucifer yellow was fit with a somewhat smaller (∼7.5 Å) radius, indicating that despite moving more quickly than the larger dyes, it did not move as well through the pore relative to its size as the other dyes did. This could represent a modest selectivity among these molecules beyond that predicted by their size. However, a similar relative permeance profile was observed across cytoplasmic bridges (Fig. 7, inset). This indicates that, instead of being due to channel selectivity, the apparent slowing of Lucifer yellow relative to its size was a result of the calculated hydrodynamic radius for Lucifer yellow (Table 1) not accurately predicting its ability to diffuse in solution relative to the other dyes. Indeed, if the hydrodynamic radius of Lucifer yellow is estimated according to its permeance across cytoplasmic bridges relative to that of the Alexa dyes (Fig. 7, inset, gray triangle), the relative permeance of Lucifer yellow is also consistent with an aqueous channel pore of ∼10 Å (Fig. 7, gray triangle).
Table 2.
Permeances relative to Alexa 350
| NBD-M-TMA | Lucifer yellow | Alexa 488 | Alexa 594 | |
|---|---|---|---|---|
| Cx43wt | 1.00 ± 0.03 (n = 41) | 0.35 ± 0.02 (n = 12) | 0.27 ± 0.01 (n = 28) | 0.029 ± 0.002 (n = 27) |
| Bridges | 0.96 ± 0.03 (n = 8) | 0.56 ± 0.03 (n = 3) | 0.52 ± 0.03 (n = 4) | 0.28 ± 0.01 (n = 4) |
| Cx40 wt | 15 ± 3.3 (n = 6) | — | — | — |
Figure 7.
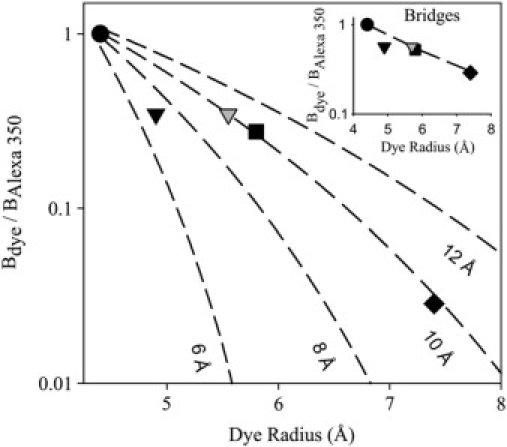
Permeance measurements yield a 10-Å pore radius estimate. Logarithmic scale plot of relative junctional permeances (Bdye/BAlexa 350) versus calculated Stokes-Einstein radii (see Methods) for each of the dyes used in the size-selectivity measurements: Alexa 350 (solid circles), Lucifer yellow (black inverted triangle), Alexa 488 (solid square), and Alexa 594 (solid diamond). Also shown (gray inverted triangle) is the relative permeance of Lucifer yellow plotted against its radius corrected for diffusion across cytoplasmic bridges. Dashed lines represent predicted relative permeances for simple aqueous pores of the given channel radii according to Eq. 13. (Inset) Logarithmic scale plot of relative permeance (Bdye/BAlexa 350) across cytoplasmic bridges versus calculated Stokes-Einstein radii for each of the dyes used in the size-selectivity measurements (symbols as in main figure). Also plotted here is the radius of Lucifer yellow predicted by its relative permeance to Alexa 350 (gray inverted triangle). Dashed line is a simple line graph connecting the Alexa series.
The assumptions involved in applying such a continuum hydrodynamic model (Eq. 13) to gap junction channels, and the appropriateness of these assumptions, are well described by Nitsche et al. (34). Briefly, the assumptions are that 1), concentrations of permeant molecules (modeled as hard spheres) are assumed to be low enough that permeant molecule movements are independent (42); 2), permeant molecules are treated as being localized to the center of the pore (radially) during transit (43); and 3), the aqueous environment in the channel is assumed to represent a continuum relative to the permeant where the only effect of the channel wall on mobility is through the boundary condition that the velocity of water at the wall is zero (42). Continuum hydrodynamic theory can be applied only approximately to pores as small as gap junction channels (particularly as α approaches 1) (42,44), thus the pore size estimated from Eq. 13 should only be considered as approximate. The fit of the relative dye permeance data to a single pore size, however, does suggest that dye selectivities of Cx43 channels can be well described based solely on the sizes of the dye permeants.
Cx43 channel radius has also been estimated from channel conductance values (6). Conductance of channels modeled as simple cylindrical pores can be calculated from the following equation (32):
| (14) |
where γj is the channel conductance; l is the channel length; r is the channel radius; and c is the conductivity of the salt solution. If the length of the channel is assumed to be 160 Å (6,34), the channel conductances from this study (Fig. 1 A) were best fit by a channel with an average radius of ∼6 Å using Eq. 14. This is clearly different from the ∼10-Å radius estimated from the relative dye permeances (Fig. 7). It is worth noting, however, that a channel radius of 6 Å would in fact be too small to accommodate passage of Alexa 594 (7.4 Å) and would also essentially eliminate passage of Alexa 488 (5.8 Å). It is clear from this study and others, however, that these dyes permeate at least some configurations of Cx43 channels.
The discrepancy between pore radii estimates by relative dye permeance and those by channel conductance could be due to assumptions that are inherent to the estimation of channel radius from channel conductance using Eq. 14. The first assumption is that the diffusion constant for the ions in the channel is equal to that in bulk solution. For a channel as long as a gap junction channel, this is likely not a valid assumption (41,45). In fact, the estimates of pore size in Fig. 7 using Eq. 13 are based on the extent to which the effective diffusion constant is expected to decrease in the channel compared to bulk solution as a function of the ratio of permeant to pore radii. The resultant correction factor from Eq. 12 can be applied to the solution conductivity in Eq. (13)13 to incorporate the predicted decrease in effective diffusion constant in the channel into the conductance estimate, since ion conductivity is directly dependent on the diffusion constant of the ion (Stokes-Einstein relation) (25,26,32). When the expected change in diffusion constant was taken into account, single-channel conductances from this study were best fit by a radius of ∼9 Å, which is similar to the ∼10-Å radius predicted from the relative dye permeances. Another assumption inherent to Eq. 14 is that ion movement through the channel is independent. If movement of ions is not entirely independent, as could be the case for a channel as long as a gap junction channel, the estimated channel radius based on channel conductance could increase further still to reach the radius estimated by relative dye permeances. Thus, channel conductance and dye permeance data are consistent with a channel pore radius of ∼10 Å.
The channel conductance and dye permeance data are also consistent with a channel pore of reasonably uniform diameter along its length. In a non-charge-selective channel, single-channel conductance to small inorganic ions is dominated by average cross-sectional area of the pore, whereas relative permeances of larger dye molecules could be dominated by a brief constriction along the length of the pore (46). A significant constriction along an otherwise wider pore would then be expected to yield a pore size estimate from relative dye permeances that would be smaller than that estimated from channel conductance to smaller ions. The fact that channel conductance and relative dye permeance yield a similar pore-size estimate indicates the lack of a significant constriction along the length of dye-permeable Cx43 channels. If such a constriction were present as a selectivity filter in other connexin channels, yet absent in Cx43 channels, it could help explain how Cx43 channels have higher permeabilities to larger molecules compared to other, more selective connexins with higher unitary conductance (6,7). The combined Cx43 dye selectivity and single-channel conductance data are well described by simple hindered diffusion through an aqueous channel pore with a radius of ∼10 Å that is devoid of significant electrostatic influences and reasonably uniform in geometry along its length. In such a pore, the selectivity of the channel would be primarily determined by permeant size, as was seen here.
Although the Cx43 dye selectivity and unitary conductance data reported herein are well described by hindered diffusion through an aqueous pore (∼10 Å in radius and 160 Å in length), other investigators (7,17,18) have reported Cx43 single-channel dye permeances much higher than those predicted using unitary conductance as an estimator of pore size. These higher permeances would require pore radii of ≥20 Å, which is inconsistent with structural data (47,48). Consequently, these high permeances have been ascribed to favorable permeant pore interactions that result in increased permeant concentration in the pore and therefore enhanced flux rates. Determining absolute per-channel flux rates or single-channel permeances for each dye was not the focus of this study; however, the junctional permeance values found here are similar to those reported by Ek-Vitorin et al. (17) for the same cell types. If we assume that channel numbers per junction in the two studies are similar, it is likely that the absolute dye permeances of the channels comprising the junctions studied herein are also higher than predicted by hindered diffusion through an aqueous pore of 10-Å radius. If favorable permeant pore interactions occur, our selectivity data suggest that 1), mobility of larger permeants must still be hindered by all or a portion of the channel pore that has a radius of ∼10 Å; and 2), permeant pore interactions must be independent of permeant charge polarity and, (to the extent that the dyes NBD-M-TMA, Lucifer yellow, Alexa 350, Alexa 488, and Alexa 594 represent variability in permeant structure and composition (see Supplementary Material)), independent of permeant structure and composition as well. Such interactions would generally be consistent with the van der Waals-type interactions that were initially proposed for this affinity (7,34).
Variable permselectivity cannot be explained by variable charge or size dye selectivity
Recently published data show a very poor correlation between dye permeance and electrical conductance across Cx43 junctions (17,18). One aim of this study was to determine whether heterogeneity in the selectivity of Cx43 junctions to dye charge or size could explain heterogeneity in permselectivity of Cx43 junctions. The dual dye technique used here is ideal for addressing this issue. The strong correlations (r ≥ 0.93) between permeance of Cx43 junctions to dyes of either similar size and opposing charge (Fig. 3) or similar charge and differing size (Fig. 5) from many junctions, for each dye combination, indicated that charge and size selectivity are fixed parameters for dye-permeable Cx43 channels. The approximately two- to threefold range in junctional charge and size selectivity measured herein was similar to that found for cytoplasmic bridges, and presumably represents the variability in the dual dye measurement approach. These data suggest that the >2 orders of magnitude variability seen for permselectivity of Cx43 junctions cannot be explained by variable charge or size dye selectivity of the comprising channels.
A dye-impermeable open state could lead to independence of conductance and dye permeance
The data from this study showing that the size and charge dye selectivities of Cx43 junctions were essentially fixed parameters seem at odds with recently published data showing a large range in junctional permselectivities (17,18). These seemingly disparate results can be reconciled by the variable presence of a conductive yet dye-impermeable open state of Cx43 channels (Fig. 8). In this model, Cx43 channels are proposed to exist in one of two open-state configurations, dye-permeable or dye-impermeable, with both states being conductive to smaller ions. Junctional dye permeance would then be mediated by a single channel state with constant selectivity properties, leading to constant junctional dye selectivities. If the proportion of dye-permeable and dye-impermeable channels contributing to junctional conductance varied between junctions, this would produce the reported variable relationship between junctional dye permeance and junctional conductance (permselectivity) despite a constant relationship between relative dye permeances (dye selectivity). Fig. 8 shows how variable contribution of these two conductive states to a junction would provide a mechanism by which cells independently regulate electrical and chemical communication via Cx43 gap junctions. It is noteworthy that some studies of Cx43 permselectivity have found a consistent relationship between dye permeance and electrical conductance (7,8,39,49). A lack of variable permselectivity could also be consistent with the model proposed above if, in some cell types or under certain conditions, the proportion of channels occupying dye-permeable versus dye-impermeable open states was consistent.
Figure 8.
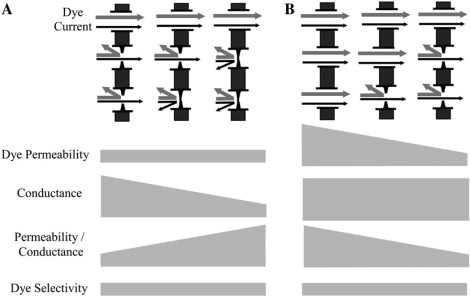
Model for independent regulation of conductance (A) and permeance (B) for Cx43 gap junctions. (A) A model for regulation of conductance independent of permeance by changing the number of dye-impermeable conductive channels without changing the number of dye-permeable conductive channels. (B) A model for regulation of permeance independent of conductance by conversion of channels between dye-permeable and dye-impermeable conductive states. In both A and B, the lower diagrams indicate the resulting changes in each parameter of junctional function that would occur as a result of the gradual shift in channel populations shown above.
Although it is clear that permeance of channels must change between permselective states, it is worth noting that conductance of channels need not change in parallel with changes in dye permeance, or significantly change at all. In fact, channel conductance has been shown to be a poor predictor of permeability for a number of connexins (6,7,50). An excellent example is recent work (39) showing that substitution of the N-terminus of chick Cx45.6 with that of Cx43 confers permeability to Alexa 594, the largest of the Alexa dyes in these studies, through Cx45.6 channels that is absent in wtCx45.6 channels, at the same time decreasing channel conductance from ∼200 pS to ∼100 pS. The apparent disconnection between conductance and dye permeance could be due in large part to the relative sizes of the dye molecules, the current-carrying ions, and the Cx channel pores. For smaller molecules (K+ or Cl−), passage through gap junction channels is likely dominated by the average cross section of the channel, whereas larger molecules (dyes) may be more affected by interactions with the channel wall or brief points of constriction along the length of the channel. By this mechanism, the approximate shape of the dye-impermeable open state in Fig. 8 could represent a configuration change resulting in an alteration of dye permeance without a significant accompanying change in channel conductance.
Cx43 can gate to a conductive but dye-impermeable open state
Partial closure of Cx43 channels to the voltage-induced “residual” conductance state significantly increases size selectivity of the channel. Indeed, whereas the conductance decreases by ∼65% (from ∼100 to ∼35 pS), permeability to larger molecules, such as fluorescent tracers and cAMP, decreases to undetectable levels (36,46). The absence of an applied transjunctional voltage in our dual dye experiments makes the presence of a voltage-induced residual state unlikely; thus, our results suggest the existence of a gating mechanism that alters the size selectivity of Cx43-comprised junctions to a state that becomes dye-impermeable but remains conductive. It is possible that a similar mechanism could be induced by events other than large transjunctional voltages, such as phosphorylation of the channel's subunits, which has indeed been shown to alter communicative properties of both single channels and junctions of Cx43 (17,51). In fact, recently published data demonstrate that phosphorylation of Cx43 results in a significant increase in size selectivity of Cx43 hemichannels (52). In the latter study, reconstituted Cx43 hemichannels were permeated by both ethylene glycol and sucrose (hydrodynamic radii ∼2.2 Å and 4.6 Å, respectively) when not phosphorylated at S368 but were permeated only by ethylene glycol, not sucrose, when phosphorylated at S368. A similar mechanism could be involved in regulation of Cx43 junctional channels as well, resulting in a channel that is permeated by small inorganic ions such as K+ and Cl− (hydrodynamic radii ∼1.3 Å), but not by the dyes used in this study or in the permselectivity studies (hydrodynamic radii ≥4.3 Å) (17,18). These channel configurations could represent the dye-permeable and dye-impermeable open states proposed here.
Significance
Based on the rate at which Lucifer yellow traverses Cx43 channels, calculated by Valiunas et al. (8), the effective ability to diffuse intercellularly across Cx43 junctions of short-lived signaling molecules such as cyclic nucleotides, calcium, and inositol tris phosphate, which are generally present at very low (micromolar) concentrations, was challenged. In fact, Valiunas calculated that the per-channel flux rate for the dye Lucifer yellow was ∼90 molecules/s at a 120-μM gradient. Recent data (7,17,18) and the data from this study, however, indicate that the flux rates for diffusion of larger solutes across junctions can vary by several orders of magnitude and display flux rates orders of magnitude higher than those initially described (8). Indeed, the average single-channel permeance determined by Weber et al. (7) for Alexa 488 (similar in size and charge to Lucifer yellow) yields a per-channel flux rate of 35,000 molecules/s at a 120-μM gradient. Given the likely possibility for effective communication of even short-lived signals via gap-junction-mediated intercellular diffusion, the ability to regulate the effective permeability to diffusion of chemical signals largely independently of effects on electrical communication could be of physiological benefit in a number of situations. This independence of regulation of chemical and electrical communication could be of particular benefit for tissues that require constant electrical communication for proper functioning, such as the heart, but may also require variable control of permeability to chemicals and second messengers. Unique properties of regulation of these communication types could provide insight into connexin-specific roles in physiological and pathophysiological situations. Further study is required to ascertain the regulatory mechanisms involved in conversion of channels between permeance states and to further characterize the specific permeance, selectivity, and conductive properties of Cx43 channels in each of these states.
Supplementary material
To view all of the supplemental files associated with this article, visit www.biophysj.org.
Appendix A.
Supplement
Acknowledgments
We thank Drs. Jose Ek-Vitorin, David Kurjiaka, and Tim Secomb for helpful discussions, and Tasha Nelson for excellent technical assistance.
This work was supported by National Institutes of Health grant HL58732 (to J.M.B.) and predoctoral support to N.S.H. from Institutional Training Grant HL007249 (to J.M.B.).
Footnotes
Editor: David S. Weiss.
References
- 1.Sohl G., Willecke K. Gap junctions and the connexin protein family. Cardiovasc. Res. 2004;62:228–232. doi: 10.1016/j.cardiores.2003.11.013. [DOI] [PubMed] [Google Scholar]
- 2.Evans W.H., Martin P.E. Gap junctions: structure and function. Mol. Membr. Biol. 2002;19:121–136. doi: 10.1080/09687680210139839. [DOI] [PubMed] [Google Scholar]
- 3.Delorme B., Dahl E., Jarry-Guichard T., Briand J.P., Willecke K., Gros D., Theveniau-Ruissy M. Expression pattern of connexin gene products at the early developmental stages of the mouse cardiovascular system. Circ. Res. 1997;81:423–437. doi: 10.1161/01.res.81.3.423. [DOI] [PubMed] [Google Scholar]
- 4.Haefliger J.A., Castillo E., Waeber G., Bergonzelli G.E., Aubert J.F., Sutter E., Nicod P., Waeber B., Meda P. Hypertension increases connexin43 in a tissue-specific manner. Circulation. 1997;95:1007–1014. doi: 10.1161/01.cir.95.4.1007. [DOI] [PubMed] [Google Scholar]
- 5.Elfgang C., Eckert R., Lichtenberg-Frate H., Butterweck A., Traub O., Klein R.A., Hulser D., Willecke K. Specific permeability and selective formation of gap junction channels in connexin-transfected HeLa cells. J. Cell Biol. 1995;129:805–817. doi: 10.1083/jcb.129.3.805. [DOI] [PMC free article] [PubMed] [Google Scholar]
- 6.Veenstra R.D., Wang H.Z., Beblo D.A., Chilton M.G., Harris A.L., Beyer E.C., Brink P.R. Selectivity of connexin-specific gap junctions does not correlate with channel conductance. Circ. Res. 1995;77:1156–1165. doi: 10.1161/01.res.77.6.1156. [DOI] [PubMed] [Google Scholar]
- 7.Weber P.A., Chang H.C., Spaeth K.E., Nitsche J.M., Nicholson B.J. The permeability of gap junction channels to probes of different size is dependent on connexin composition and permeant-pore affinities. Biophys. J. 2004;87:958–973. doi: 10.1529/biophysj.103.036350. [DOI] [PMC free article] [PubMed] [Google Scholar]
- 8.Valiunas V., Beyer E.C., Brink P.R. Cardiac gap junction channels show quantitative differences in selectivity. Circ. Res. 2002;91:104–111. doi: 10.1161/01.res.0000025638.24255.aa. [DOI] [PubMed] [Google Scholar]
- 9.Nicholson B.J., Weber P.A., Cao F., Chang H., Lampe P., Goldberg G.S. The molecular basis of selective permeability of connexins is complex and includes both size and charge. Braz. J. Med. Biol. Res. 2000;33:369–378. doi: 10.1590/s0100-879x2000000400002. [DOI] [PubMed] [Google Scholar]
- 10.Beblo D.A., Veenstra R.D. Monovalent cation permeation through the connexin40 gap junction channel Cs, Rb, K, Na, Li, TEA, TMA, TBA, and effects of anions Br, Cl, F, acetate, aspartate, glutamate, and NO3. J. Gen. Physiol. 1997;109:509–522. doi: 10.1085/jgp.109.4.509. [DOI] [PMC free article] [PubMed] [Google Scholar]
- 11.Wang H.-Z., Veenstra R.D. Monovalent ion selectivity sequences of the rat connexin43 gap junction channel. J. Gen. Physiol. 1997;109:491–507. doi: 10.1085/jgp.109.4.491. [DOI] [PMC free article] [PubMed] [Google Scholar]
- 12.Trexler E.B., Bukauskas F.F., Kronengold J., Bargiello T.A., Verselis V.K. The first extracellular loop domain is a major determinant of charge selectivity in connexin46 channels. Biophys. J. 2000;79:3036–3051. doi: 10.1016/S0006-3495(00)76539-8. [DOI] [PMC free article] [PubMed] [Google Scholar]
- 13.Goldberg G.S., Valiunas V., Brink P.R. Selective permeability of gap junction channels. Biochim. Biophys. Acta. 2004;1662:96–101. doi: 10.1016/j.bbamem.2003.11.022. [DOI] [PubMed] [Google Scholar]
- 14.Goldberg G.S., Lampe P.D., Nicholson B.J. Selective transfer of endogenous metabolites through gap junctions composed of different connexins. Nat. Cell Biol. 1999;1:457–459. doi: 10.1038/15693. [DOI] [PubMed] [Google Scholar]
- 15.Harris A.L. Connexin channel permeability to cytoplasmic molecules. Prog. Biophys. Mol. Biol. 2007;94:120–143. doi: 10.1016/j.pbiomolbio.2007.03.011. [DOI] [PMC free article] [PubMed] [Google Scholar]
- 16.Ek-Vitorin J.F., Burt J.M. Quantification of gap junction selectivity. Am. J. Physiol. Cell Physiol. 2005;289:C1535–C1546. doi: 10.1152/ajpcell.00182.2005. [DOI] [PubMed] [Google Scholar]
- 17.Ek-Vitorin J.F., King T.J., Heyman N.S., Lampe P.D., Burt J.M. Selectivity of connexin 43 channels is regulated through protein kinase C-dependent phosphorylation. Circ. Res. 2006;98:1498–1505. doi: 10.1161/01.RES.0000227572.45891.2c. [DOI] [PMC free article] [PubMed] [Google Scholar]
- 18.Eckert R. Gap-junctional single-channel permeability for fluorescent tracers in mammalian cell cultures. Biophys. J. 2006;91:565–579. doi: 10.1529/biophysj.105.072306. [DOI] [PMC free article] [PubMed] [Google Scholar]
- 19.Vozzi C., Ullrich S., Charollais A., Philippe J., Orci L., Meda P. Adequate connexin-mediated coupling is required for proper insulin production. J. Cell Biol. 1995;131:1561–1572. doi: 10.1083/jcb.131.6.1561. [DOI] [PMC free article] [PubMed] [Google Scholar]
- 20.Gustafson T.A., Bahl J.J., Markham B.E., Roeske W.R., Morkin E. Hormonal regulation of myosin heavy chain and α-actin gene expression in cultured fetal rat heart myocytes. J. Biol. Chem. 1987;262:13316–13322. [PubMed] [Google Scholar]
- 21.Cottrell G.T., Burt J.M. Heterotypic gap junction channel formation between heteromeric and homomeric Cx40 and Cx43 connexons. Am. J. Physiol. Cell Physiol. 2001;281:C1559–C1567. doi: 10.1152/ajpcell.2001.281.5.C1559. [DOI] [PubMed] [Google Scholar]
- 22.Kurjiaka D.T., Steele T.D., Olsen M.V., Burt J.M. Gap junction permeability is diminished in proliferating vascular smooth muscle cells. Am. J. Physiol. 1998;275:C1674–C1682. doi: 10.1152/ajpcell.1998.275.6.C1674. [DOI] [PubMed] [Google Scholar]
- 23.Aavula B.R., Ahad M., Mash E.A., Bednarczyk D., Wright S.H. Synthesis and fluorescence of N,N,N-trimethyl-2-[methyl(7-nitrobenzo[c][1,2,5]oxadiazol-4-yl)amino]ethaminium iodide, a pH-insensitive reporter of organic cation transport. Synthetic Commun. 2006;36:701–705. [Google Scholar]
- 24.Wilke C.R., Chang P. Correlation of diffusion coefficients in dilute solutions. AIChE J. 1955;1:264–270. [Google Scholar]
- 25.Miller C.C. The Stokes-Einstein law for diffusion in solution. Proc. Roy. Soc. Lond. 1924;106:724–749. [Google Scholar]
- 26.Einstein A. Uber die von der molekularkinetischen Theorie der Warme geforderte Bewegung von in ruhenden Flussigkeiten suspendiertin Teilchen. Annalen der Physik. 1905;322:549–560. [Google Scholar]
- 27.Reid R.C., Prausnitz J.M., Sherwood T.K. McGraw-Hill; New York: 1977. The Properties of Gases and Liquids. [Google Scholar]
- 28.Dakin K., Zhao Y., Li W.H. LAMP, a new imaging assay of gap junctional communication unveils that Ca2+ influx inhibits cell coupling. Nat. Methods. 2005;2:55–62. doi: 10.1038/nmeth730. [DOI] [PubMed] [Google Scholar]
- 29.Wade M.H., Trosko J.E., Schindler M. A fluorescence photobleaching assay of gap junction-mediated communication between human cells. Science. 1986;232:525–528. doi: 10.1126/science.3961495. [DOI] [PubMed] [Google Scholar]
- 30.Cottrell G.T., Wu Y., Burt J.M. Cx40 and Cx43 expression ratio influences heteromeric/heterotypic gap junction channel properties. Am. J. Physiol. 2002;282:C1469–C1482. doi: 10.1152/ajpcell.00484.2001. [DOI] [PubMed] [Google Scholar]
- 31.Lin X., Fenn E., Veenstra R.D. An amino-terminal lysine residue of rat connexin40 that is required for spermine block. J. Physiol. 2006;570:251–269. doi: 10.1113/jphysiol.2005.097188. [DOI] [PMC free article] [PubMed] [Google Scholar]
- 32.Hille B. Sinauer Associates; Sunderland, MA: 1992. Ionic Channels of Excitable Membranes. [Google Scholar]
- 33.Biegon R.P., Atkinson M.M., Liu T.F., Kam E.Y., Sheridan J.D. Permeance of Novikoff hepatoma gap junctions: quantitative video analysis of dye transfer. J. Membr. Biol. 1987;96:225–233. doi: 10.1007/BF01869304. [DOI] [PubMed] [Google Scholar]
- 34.Nitsche J.M., Chang H.C., Weber P.A., Nicholson B.J. A transient diffusion model yields unitary gap junctional permeabilities from images of cell-to-cell fluorescent dye transfer between Xenopus oocytes. Biophys. J. 2004;86:2058–2077. doi: 10.1016/S0006-3495(04)74267-8. [DOI] [PMC free article] [PubMed] [Google Scholar]
- 35.Valiunas V., Bukauskas F., Weingart R. Conductances and selective permeability of connexin43 gap junction channels examined in neonatal rat heart cells. Circ. Res. 1997;80:708–719. doi: 10.1161/01.res.80.5.708. [DOI] [PubMed] [Google Scholar]
- 36.Bukauskas F.F., Bukauskiene A., Verselis V.K. Conductance and permeability of the residual state of connexin43 gap junction channels. J. Gen. Physiol. 2002;119:171–186. doi: 10.1085/jgp.119.2.171. [DOI] [PMC free article] [PubMed] [Google Scholar]
- 37.Mastro A.M., Keith A.D. Diffusion in the aqueous compartment. J. Cell Biol. 1984;99:180s–187s. doi: 10.1083/jcb.99.1.180s. [DOI] [PMC free article] [PubMed] [Google Scholar]
- 38.Unger V.M., Kumar N.M., Gilula N.B., Yeager M. Projection structure of a gap junction membrane channel at 7Å resolution. Nat. Struct. Biol. 1997;4:39–43. doi: 10.1038/nsb0197-39. [DOI] [PubMed] [Google Scholar]
- 39.Dong L., Liu X., Li H., Vertel B.M., Ebihara L. Role of the N-terminus in permeability of chicken connexin45.6 gap junctional channels. J. Physiol. 2006;576:787–799. doi: 10.1113/jphysiol.2006.113837. [DOI] [PMC free article] [PubMed] [Google Scholar]
- 40.Cottrell G.T., Wu Y., Burt J.M. Functional characteristics of heteromeric Cx40-Cx43 gap junction channel formation. Cell Commun. Adhes. 2001;8:193–197. doi: 10.3109/15419060109080722. [DOI] [PubMed] [Google Scholar]
- 41.Dwyer T.M., Adams D.J., Hille B. The permeability of the endplate channel to organic cations in frog muscle. J. Gen. Physiol. 1980;75:469–492. doi: 10.1085/jgp.75.5.469. [DOI] [PMC free article] [PubMed] [Google Scholar]
- 42.Levitt D.G. General continuum analysis of transport through pores. I. Proof of Onsager's reciprocity postulate for uniform pore. Biophys. J. 1975;15:533–551. doi: 10.1016/S0006-3495(75)85836-X. [DOI] [PMC free article] [PubMed] [Google Scholar]
- 43.Deen W.M. Hindered transport of large molecules in liquid filled pores. AIChE J. 1987;33:1409–1425. [Google Scholar]
- 44.Adams D.J., Dwyer T.M., Hille B. The permeability of endplate channels to monovalent and divalent metal cations. J. Gen. Physiol. 1980;75:493–510. doi: 10.1085/jgp.75.5.493. [DOI] [PMC free article] [PubMed] [Google Scholar]
- 45.Levitt D.G. General continuum theory for multiion channel. II. Application to acetylcholine channel. Biophys. J. 1991;59:278–288. doi: 10.1016/S0006-3495(91)82221-4. [DOI] [PMC free article] [PubMed] [Google Scholar]
- 46.Qu Y., Dahl G. Function of the voltage gate of gap junction channels: selective exclusion of molecules. Proc. Natl. Acad. Sci. USA. 2002;99:697–702. doi: 10.1073/pnas.022324499. [DOI] [PMC free article] [PubMed] [Google Scholar]
- 47.Yeager M., Unger V.M., Falk M.M. Synthesis, assembly and structure of gap junction intercellular channels. Curr. Opin. Struct. Biol. 1998;8:517–524. doi: 10.1016/s0959-440x(98)80131-0. [DOI] [PubMed] [Google Scholar]
- 48.Unger V.M., Kumar N.M., Gilula N.B., Yeager M. Three-dimensional structure of a recombinant gap junction membrane channel. Science. 1999;283:1176–1180. doi: 10.1126/science.283.5405.1176. [DOI] [PubMed] [Google Scholar]
- 49.Ma M., Dahl G. Cosegregation of permeability and single-channel conductance in chimeric connexins. Biophys. J. 2006;90:151–163. doi: 10.1529/biophysj.105.066381. [DOI] [PMC free article] [PubMed] [Google Scholar]
- 50.Gong X.Q., Nicholson B.J. Size selectivity between gap junction channels composed of different connexins. Cell Commun. Adhes. 2001;8:187–192. doi: 10.3109/15419060109080721. [DOI] [PubMed] [Google Scholar]
- 51.Burt J.M., Steele T.D. Selective effect of PDGF on connexin43 versus connexin40 comprised gap junction channels gap junction channels. Cell Commun. Adhes. 2003;10:287–291. doi: 10.1080/cac.10.4-6.287.291. [DOI] [PubMed] [Google Scholar]
- 52.Bao X., Lee S.C., Reuss L., Altenberg G.A. Change in permeant size selectivity by phosphorylation of connexin 43 gap-junctional hemichannels by PKC. Proc. Natl. Acad. Sci. USA. 2007;104:4919–4924. doi: 10.1073/pnas.0603154104. [DOI] [PMC free article] [PubMed] [Google Scholar]
Associated Data
This section collects any data citations, data availability statements, or supplementary materials included in this article.
Supplementary Materials
Supplement