

Abstract
The open reading frame PSPTO2896 from the plant pathogen Pseudomonas syringae pv. tomato encodes a protein of 534 amino acids showing all salient features of a blue light-driven two-component system. The N-terminal LOV (light, oxygen, voltage) domain, potentially binding a flavin chromophore, is followed by a histidine kinase (HK) motif and a response regulator (RR). The full-length protein (PST-LOV) and, separately, the RR and the LOV+HK part (PST-LOVΔRR) were heterologously expressed and functionally characterized. The two LOV proteins showed typical LOV-like spectra and photochemical reactions, with the blue light-driven, reversible formation of a covalent flavin-cysteine bond. The fluorescence changes in the lit state of full-length PST-LOV, but not in PST-LOVΔRR, indicating a direct interaction between the LOV core and the RR module. Experiments performed with radioactive ATP uncover the light-driven kinase activity. For both PST-LOV and PST-LOVΔRR, much more radioactivity is incorporated when the protein is in the lit state. Furthermore, addition of the RR domain to the fully phosphorylated PST-LOVΔRR leads to a very fast transfer of radioactivity, indicating a highly efficient HK activity and a tight interaction between PST-LOVΔRR and RR, possibly facilitated by the LOV core itself.
Introduction
Light is an energy source and an ever present stimulus on earth. The short wavelength region, i.e., the ultraviolet (UV) and blue light range, however, can be harmful to organisms because of the deleterious effects on DNA (UV range) (1) or the capability to excite, with high yield, ubiquitously present photosensitizing compounds, e.g., porphyrins and flavins (blue light effects) (2). Photoexcitation converts such compounds with high efficiency into the triplet state, which in the presence of oxygen generates the highly oxidative oxygen singlet state and other reactive oxygen containing species (3). Blue light detecting photosensors are thus of the utmost importance for any organism, allowing the development of repair systems (4), the formation of protective (shielding) substances, or—for motile organisms—the escape from regions with high UV/blue light intensity (5). At least three systems have been identified recently that fulfill this function. All are based on flavin derivatives that serve as chromophores in these photoreceptors. They were named cryptochromes; light, oxygen, voltage (LOV) proteins; and blue-light-sensing using flavins (BLUF) proteins (6). The most widely spread of these flavin-based photoreceptors are the LOV domain-containing proteins (LOV) (7). They are assumed to be present in all plants, and prokaryotic genome analysis revealed the presence of LOV proteins in ∼15% of all sequenced genomes (6). In prokaryotes the light-sensing LOV module is coupled to diverse effectors domains, such as kinases (similar to the plant phototropins), phosphodiesterases, response regulators (RRs), DNA-binding transcription factors, and regulators of stress σ factors (7,8). The majority of LOV domains is found together with histidine kinase (HK) motifs or with transcription factors in the same open reading frame (ORF) or arranged in a single operon, allowing an efficient physiological response of the cell to a light pulse. This relatively simple, stereotypical structure of photoreceptors, together with their instantaneous (=light triggered) activation or deactivation makes these sensory proteins excellent candidates to study signal transduction mechanisms.
A considerably large percentage of the bacterial LOV proteins are members of the histidine protein kinase (HPK) kinase superfamily (6,8). In bacteria, signal transducing HPKs, together with phosphoaspartyl RRs, are the key elements of two-component signal transduction systems (9). The HPKs generally contain an N-terminal sensing domain (e.g., LOV) and a C-terminal kinase core, but additional domains may be present. The kinase core of HPK features the phosphoaccepting histidine box (H-box) within the homodimerization domain and, downstream to it, the highly conserved homology boxes of the nucleotide-binding, catalytic domain (N-, D-, F-, and G-boxes) (10). In response to a signal, HPKs autophosphorylate the H-box histidine residue from which the phosphoryl group is transferred to a conserved aspartic acid residue in the receiver domain of an RR (9). HPKs can be further divided into subfamilies according to their sequence similarity (10). The hybrid HPK-RR LOV proteins from Pseudomonadales and Xanthomonadales (γ-proteobacteria) are highly homologous and form a distinct family (6,8). The kinase domain is characteristic of the HPK4 class: besides a typical H-box, these proteins exhibit the PF-TTK signature in the so-called F-box. Furthermore, their LOV domains are among those that are most homologous to (plant) phot-LOVs. Given these features, namely, the association of an “ideal” phot-like LOV domain with prototypical kinase and RR motifs, they are good candidates to test the molecular properties of this novel, putatively a blue light-driven two-component signaling system in bacteria. Additionally, although there is no report on light-elicited responses in these organisms, a few links have been established among plant defense systems, plant photosensors, and bacterial pathogens belonging to Pseudomonales (11–13), prompting an investigation of bacterial photosensors in view of their potential role during the infectivity process.
We present studies on the molecular and spectroscopic properties of the LOV-HPK-RR hybrid protein (gene name PSPTO2896) from P. syringae pv. tomato DC3000 (Pst DC3000), an important plant pathogen whose genome was recently sequenced (14). The recombinant protein from ORF PSPTO2896 will be named PST-LOV. To this purpose three protein constructs were built: i), the full protein PST-LOV2896 encompassing the LOV, HPK, and RR domains; ii), the truncated PST-LOV2896ΔRR (comprising the LOV and HPK domain); and iii), the separated RR.
Pseudomonas syringae has gained remarkable interest due to its capability to infect a wide variety of plants, exhibiting strain-to-host specificity with ∼50 known pathovars (pv.) (15). Three strains, P. syringae pv. syringae B728a, P. syringae pv. tomato DC3000, and P. syringae pv. phaseolicola 1448A have been genome sequenced (14,16,17). An inspection revealed ORFs with strong homology to LOV domains. The ORF PSPTO2896 from the genome of P. syringae pv. tomato DC3000 encodes a LOV protein of 534 amino acids (PST-LOV), corresponding to a molecular mass of 58.9 kDa. Sequence alignment reveals a domain architecture with a typical LOV domain (aa 33–136) containing all salient amino acids required for flavin-mononucleotide (FMN) binding, followed by a HK motif and an ATP-binding domain (aa 154–389). The final part of PST-LOV is built as an RR domain (aa 409–534), making this protein a typical two-component system, in this case the HPK activity being fused to the RR domain (Fig. 1). The HK domain is characteristic of the HPK4 class (8,10). Although generally RRs contain one or more output domains downstream of the receiver domain, in some cases, as in the here investigated protein, only the receiver domain is present, often fused with the cognate HPK (hybrid HPK-RR) (10). In this case, no RR-output domain was identified in the vicinity of this encoding gene.
Figure 1.
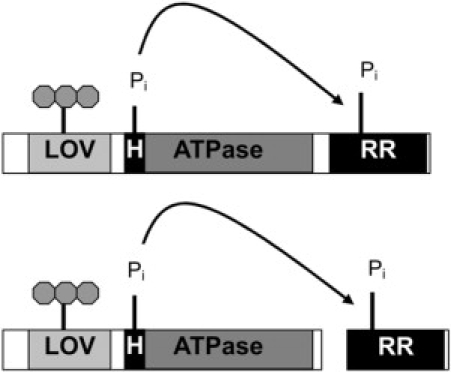
Principal architecture of two-component systems. Both arrangements that have been used in this study, i.e., the HK and RR as a fusion protein and as two separate proteins, are shown.
Analysis of this protein and the demonstration of light-induced signal transduction between the two domains would add blue light as a stimulus to the two-component system, which is present in many prokaryotic microorganisms.
Materials and methods
Cloning and biochemistry
Pst DC3000 was grown in Luria-Bertani medium overnight at 37°C. Genomic DNA was isolated with Qiagen DNeasy Tissue kit (Qiagen, Duesseldorf, Germany). i) Full-length protein: The ORF PSPTO2896 was amplified by polymerase chain reaction (PCR) from genomic P. syringae DNA, using the primers 5′-TCCAGTACATATGTCGGAAAACAAGACCCGTGTCG (forward) and 5′-TACAATCTCGAGTCAGGCAATGCCGTTGGGAC (reverse); PCR conditions: 95°C 2 min, 25 times (95°C 30 s, 58°C 45 s, 72°C 2 min), 72°C 10 min, 4°C hold. Both primers contained restriction sites (shown in bold) for insertion of the PCR product into the plasmid pET28a (Novagen-Merck, Darmstadt, Germany), which is furnished at its 5′-end with an octadecanucleotide encoding for a His6 tag. Heterologous expression in Escherichia coli BL21 DE3 (Stratagene, Amsterdam, The Netherlands) was induced by IPTG (30°C, 1 mM, for 6 h). PST-LOV was isolated from the lysed E. coli cells (lysis was by an Ultra-turrax, IKA, Staufen, Germany, in liquid nitrogen) by passage of the crude lysate (separated from the cell debris by ultracentrifugation, 368,000 × g, 1 h, 4°C) over a Ni+-resin affinity chromatography column (Prochem, Englewood, CO). Such obtained protein was practically pure and was used for further studies without additional purifications. Matrix-assisted laser desorption ionization (MALDI) spectra were measured with an ABI Voyager DE Pro MALDI-time-of-flight (TOF), using Sina and 2,5-dihydroxybenzoic acid as matrix. ii) Truncated proteins: For generation of protein fragments holding the LOV domain and the HPK motif (aa 1–402), and separately the RR (aa 403–534), the two parts of PST-LOV were amplified by PCR from the full-length encoding DNA, using the primers 5′-TCCAGTACATATGTCGGAAAACAAGACCCGTGTCG (LOV and HPK forward), 5′-CTCGAGTCACGATCCCTGAGGTGA (LOV and HPK reverse), and 5′-CCATGGATAGACGCCTGGGCAGCA (RR forward), 5′-TACAATCTCGAGGGCAATGCCGT (RR reverse); again, the restriction site motifs used from cloning into pET28a are shown in bold. The front part of PST-LOV was furnished with an N-terminal His6 tag, whereas the RR domain was followed by a C-terminal His6 tag. Further procedures, i.e., cell growth, IPTG-induction, harvest, and purification were performed as for the full-length protein (see above).
Chromophore composition
The protein-bound chromophore was released by heat denaturation. The sample was kept at 100°C for 10 min, after which time the sample was centrifuged to remove denatured protein (14,000 rpm, 20 min). The supernatant was passed through a Microcon YM3 centrifugal concentrator (13,000 rpm, 1 h, Millipore, Billerica, MA, molecular weight cutoff 3′000) and directly used for high performance liquid chromatography (HPLC) analysis. Each injection was repeated two times to follow statistical errors. HPLC: A HPLC system from Shimadzu (LC10Ai; Shimadzu Deutschland, Duisburg, Germany) was used, employing a 250/4 C18-RP column (Macherey and Nagel, Düren, Germany). The column was equipped with a precolumn of the same material, and 50 mM ammonium acetate, pH 6 (eluent B) and 70% acetonitrile in B (eluent A) were used as solvents. Authentic FMN, flavin-adenine dinucleotide (FAD), and riboflavin (purchased from Sigma-Aldrich, St. Louis, MO) were used as reference compounds. Besides that, spectra of the eluted samples were recorded during the separation by a diode array detection system. A solvent gradient (t = 0, 5:95 A:B, t = 20 min, 40:60 A:B, t = 22 min, 40:60 A:B, t = 29 min, 5:95 A:B) was applied.
Spectroscopy
All measurements were carried out in phosphate buffer 10 mM, pH = 8, NaCl 10 mM. Absorption spectra and kinetic traces were recorded at 20°C with a temperature-controlled Shimadzu UV-2401PC spectrophotometer. Origin 7.5 (OriginLab, Northampton, MA) was employed for data treatment and kinetic fitting. Photoequilibrium conditions, with accumulation of the photoactivated state, were achieved illuminating the sample with a blue light emitting Led-LenserV8 lamp (Zweibrüder Optoelectronics, Solingen, Germany). Steady-state fluorescence spectra have been recorded with a temperature-controlled Perkin-Elmer LS-50 luminescence spectrometer (Perkin-Elmer, Beaconsfield, England). To measure the fluorescence quantum yield (ΦF) of the bound flavin chromophore, FMN (Fluka, Neu-Ulm, Germany) was used as a standard (ΦF = 0.26) (18), and measurements were carried out at 10°C with 450 nm excitation to achieve conditions similar to the laser-induced optoacoustic spectroscopy (LIOAS) experiments (vide infra). Other fluorescence measurements (excitation at 295 and 280 nm) were carried out at 20°C.
Laser-induced optoacoustic spectroscopy
For the LIOAS experiments, excitation at 450 nm was achieved by pumping the frequency-tripled pulse of a neodymium-doped yttrium aluminum garnet laser (SL 456G, 6-ns pulse duration, 355 nm, Spectron Laser System, Rugby, Great Britain) into a β-barium borate optical parametric oscillator (OPO-C-355, bandwidth 420–515 nm, Laser Technik Vertriebs, Ertestadt-Friesheim, Germany) as previously described (19). The cuvette holder FLASH 100 (Quantum Northwest, Spokane, WA) was temperature controlled to ±0.02°C. The signal was detected by a V103-RM ultrasonic transducer and fed into a 5662 preamplifier (Panametrics, Waltham, MA). The pulse fluence was varied with a neutral density filter and measured with a pyroelectric energy meter (RJP735 head connected to a meter RJ7620 from Laser Precision, Libertyville, IL). The beam was shaped by a 1 × 12 mm slit, allowing a time resolution of ∼60 ns by employing deconvolution techniques (20). The experiments were performed in the linear regime of amplitude versus laser fluence, and the total incident energy normally used was ∼20 μJ/pulse (this corresponds to 7.5 × 10⁻¹¹ einstein for 450 nm excitation, photon energy 265.82 kJ/mol). The sample concentration was ∼7.5 μM, corresponding to 0.9 × 10⁻⁹ mol in the excitation volume V0 = 0.12 mL. These conditions correspond to 0.08 photon per protein molecule. New coccine (Fluka) was used as calorimetric reference (21). The time evolution of the pressure wave was assumed to be a sum of monoexponential functions. The deconvolution analysis yielded the fractional amplitudes (φi) and the lifetimes (τi) of the transients (Sound Analysis 3000, Quantum Northwest). The time window was between 20 ns and 5 μs. At a given temperature and for each resolved ith step, the fractional amplitude φi is the sum of the fraction of absorbed energy released as heat (αi) and the structural volume change per absorbed einstein (ΔVi), according to Eq. 1 (22,23)
| (1) |
Eλ is the molar excitation energy, β = (∂V/∂T)P/V is the volume expansion coefficient, cp is the heat capacity at constant pressure, and ρ is the mass density of the solvent. In this work we used the so-called “two temperature” (TT) method to separate αi from ΔVi (24). The sample waveform was acquired at a temperature for which heat transport is zero, Tβ=0 = 3.7°C and at a slightly higher temperature Tβ>0 = 10°C. At Tβ=0 the LIOAS signal is only due to ΔVi. The reference for deconvolution was recorded at Tβ>0, and Eqs. 2a and 2b were then used to derive αi and ΔVi:
| (2a) |
| (2b) |
To minimize the photoconversion of the dark state and to avoid experimental artifacts related to the long recovery kinetics of the adduct, we used low repetition rates for the excitation (1/25 Hz). Under the conditions employed the absorption decrease at 450 nm was <5% at the end of each experiment. Two sets of experiments were carried out for each protein, and a total of eight deconvolution fittings at each temperature.
Size exclusion chromatography
Gel filtration chromatography experiments were performed on a Pharmacia (Piscataway, NJ) fast protein liquid chromatography apparatus, using a Superdex 75 HR 10/30 column (Amersham Biosciences, Buckinghamshire, UK), equilibrated with a Na-phosphate buffer, 10 mM, pH = 8, NaCl = 0.15 M, as previously described (25). Bovine serum albumin (69 kDa), ovalbumin (42.7 kDa), α-chymotrypsin (25 kDa), myoglobin (16.9 kDa), and ribonuclease (13.7 kDa) (low Mw calibration kit, Amersham Biosciences) were used for calibration of the column. The proteins were loaded on the column at a concentration between 1 and 50 μM to give a final concentration ranging from 0.05 to 2.5 μM at the detection peak, due to dilution through the column.
Radioactivity experiments
Auto- and transphosphorylation experiments were performed using 32P-γ-ATP (37 mBq 100 μl, Hartmann Analytik, Braunschweig, Germany). A 100 μl reaction buffer (26) contains 20 μg PST-LOV or LOV-HK fragment. The reactions were performed at room temperature in dark and light separately. At given time points, 10 μl of the reaction mixture was extracted and quenched with 10 μl sodium dodecylsulfate (SDS) stop buffer (26). For transphosphorylation experiments, a 10× excess (m/m) of the RR domain was added into the reaction tube. Again, 10 μl of the new mixture was withdrawn at different time points and quenched with 10 μl SDS stop buffer. After heating at 55°C for 5 min, radioactive proteins were separated on SDS-polyacrylamide-gel electrophoresis (PAGE) gels, which were kept in a BAS cassette 2025 (Fujifilm, Tokyo, Japan) for detection of radioactivity. Autoradiograms were obtained from a fluorescence image analyzer FLA-3000 (Fujifilm). Spot intensity is read as PSL mm−2 (PSL, photostimulated luminescence). Pixel size was 50 × 50 μm2.
Results and discussion
Steady-state absorption measurements and kinetics of the dark recovery reaction
Heterologous expression of PSPTO2896 and PSPTO2896ΔRR in E. coli BL21 DE3, followed by His tag mediated affinity purification yielded recombinant proteins of expected size (MALDI- mass spectrometry: 61,049.2 and 46,299.3, expected mass: 61,098.4 and 46,367.4, respectively, including the 20 aa long His tag) with an absorbance spectrum typical for an oxidized flavin species (λmax = 447 nm, Fig. 2) under dark conditions. Blue light irradiation produced bleaching in the visible region, with concomitant loss of flavin fluorescence and appearance of a species absorbing maximally at ∼390 nm, all features characterizing the formation of the covalent adduct in LOV proteins (27,28). The absorption spectra of purified PST-LOVΔRR in the dark- and light-adapted state are shown in Fig. 2, together with the light-dark difference spectrum. Similar spectra are obtained for PST-LOV, albeit with a slightly larger scattering (not shown).
Figure 2.
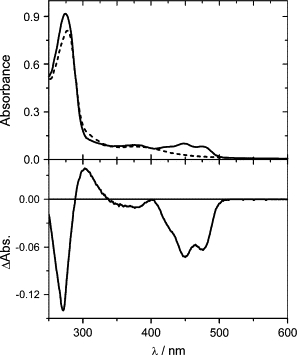
(Top) Absorption and (bottom) absorption difference spectra (light-dark) of PST-LOVΔRR before and after blue light irradiation.
The high UV/Visible ratio in the dark state (Abs280/Abs447 = 8.6) indicates that a certain amount of apoprotein is present (29). The calculated absorption coefficient of apo-PST-LOVΔRR at 280 nm is 22,015 M−1cm−1 (ProtParam tool at the ExPASy Proteomics Server http://expasy.org), whereas for bound FMN it is ∼26,250 M−1cm−1 (29). From these data we can estimate that Abs280/Abs447 = ∼4 for a 1:1 protein/FMN ratio (no apoprotein present). Therefore, in the sample shown in Fig. 2 we may estimate that the protein/FMN ratio is ∼3.5. The full-length PST-LOV protein shows an even larger amount of apoprotein, as the protein/FMN ratio is ∼4.5 for the measured Abs280/Abs447 = 12.5 (ideal ratio Abs280/Abs447 = 4.5 for a 1:1 complex). The full-length protein was subjected to a chromophore extraction to determine the chromophore composition (which could influence the spectroscopic properties). HPLC analysis showed preferentially FMN as chromophore (86%), accompanied by some FAD (13.3%), and a small amount of riboflavin (0.7%). It should be mentioned that especially older samples show a change of the latter two flavin derivatives due to decomposition of FAD: a 6-month-old sample, kept at −40°C and identically prepared, showed a composition of 86:4:10 for FMN/FAD/riboflavin.
The absorption spectrum in the visible region is typical for FMN-binding LOV proteins, showing the three vibrational bands of the S0→S1 transition (29,30). In the ultraviolet-A (UVA) range (S0→S2 transition), the absorption maximum is red shifted (381 nm) with respect to YtvA (376 nm) and to Cr-phot-LOV1 and PpSB2-LOV (both showing a broad band centered at ∼360 nm). In riboflavin derivatives this band is the most sensitive to the polarity of the microenvironment (31), and it is characteristically different between phot-LOV1 and LOV2 (shifted more to the red in LOV2) (28). The light-dark difference spectrum resembles the formation of the covalent adduct in LOV domains, generating the characteristic bleaching of the S0→S1 transition (Fig. 2).
In the dark, the photoadduct slowly reverts to the dark state, as can be followed by recording the recovery of absorbance at 447 nm, the full-length PST-LOV being slightly faster than the truncated protein (Fig. 3). The kinetic trace can best be fitted with a double exponential decay function, yielding an average life time of 5650 s for the full-length protein and 6210 s for the truncated protein. We can, however, not exclude that the biexponential behavior is an artifact due to a slight change in the scattering during the long-lasting measurements.
Figure 3.
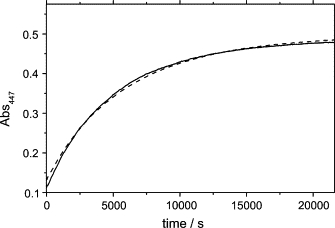
Dark-recovery time course (20°C) for full-length PST-LOV (solid line) and for the truncated protein PST-LOVΔRR (dashed line), obtained by measuring the absorbance at 447 nm. Experimental data were fitted by a two-exponential decay function.
The average lifetime for the dark recovery reaction, 〈τrec〉, is extremely long for both constructs (Table 1), even when compared to other bacterial LOV proteins (τrec = 3200 s for YtvA, at 20°C) (19).
Table 1.
Kinetic and spectroscopic data of recombinant proteins PST-LOV and PST-LOVΔRR from P. syringae pv. tomato
| 20°C | LOV+kinase | Full-length protein |
|---|---|---|
| A1 | 27% ± 1% | 65% ± 2.5% |
| τ1/s | 3505 ± 33 | 3950 ± 55 |
| A2 | 73% ± 1% | 35% ± 2.5% |
| τ2/s | 7210 ± 24 | 8820 ± 36 |
| 〈τ〉/s* | 6210 | 5650 |
〈τrec〉 = ∑Aiτi/100.
Fluorescence of the conserved W111
Phot-LOV domains and the vast majority of bacterial LOV domains carry a single, conserved tryptophan residue localized on the Hβ strand (8). The specific function of this residue is unknown; in YtvA (W103), it is involved in intraprotein interactions (32), most probably via contacts with the N-terminal cap (A. Losi and V. Buttani, unpublished) and/or with the linker region C-terminal to the LOV core (29). The fluorescence of W103 in full-length YtvA is blue shifted with respect to the isolated YtvA-LOV (32), but no major changes are observed upon formation of the photoadduct. Conversely, in phot1-LOV2 W491 undergoes conformational changes upon formation of the photoadduct due to the unfolding of the linker region (33,34). In PpSB2-LOV the fluorescence of W97 slightly increases in the photoadduct with a concomitant broadening of the band, reverting to the original value after dark conversion of the protein (35).
In PST-LOVΔRR and PST-LOV, the fluorescence maximum of W111 (again the only tryptophan in the whole protein) is localized at ∼332 nm, slightly blue shifted with respect to YtvA (335 nm) (32). Only very small changes are detectable by selective excitation of the Trp residue with 295 nm light (not shown). Excitation at 280 nm, however, caused a reversible change for the full-length protein, namely a slight increase of the fluorescence intensity and a spectral broadening. This reversible, light-induced change is much smaller in the truncated PST-LOVΔRR (Fig. 4).
Figure 4.
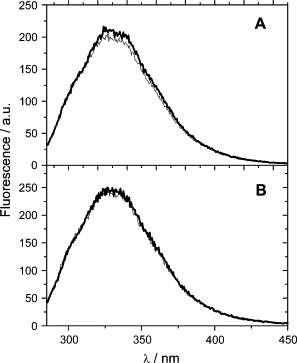
UVA fluorescence of (A) PST-LOV and (B) PST-LOVΔRR after 280 nm excitation in the dark- (thin line) and light- (thick line) adapted states.
The fluorescence change observed for PST-LOV may originate from conformational changes involving tyrosine(s) that increase energy transfer to W111 in the light state as suggested for YtvA (32), since these aromatic residues also are excited at 280 nm. This idea is supported by the fact that the change is not detected upon selective excitation of W111 at 295 nm. The important observation here is the difference between the truncated protein, PST-LOVΔRR, and the full-length protein, PST-LOV, the former one showing practically no change of the fluorescence in the dark or lit state, whereas the full-length protein exhibits an increase of fluorescence upon illumination. These data demonstrate an interaction between the LOV-HK and the RR domains that changes upon illumination. Most probably this involves one or more amino acids on the LOV core that change their conformation or environment upon formation of the photoproduct. A mutation of the tryptophan111 to identify its role in this process failed and produced only (misfolded) apoprotein void of any chromophore.
LIOAS measurements
The LIOAS signals at Tβ=0 = 3.70°C are similar to those recorded for other LOV proteins (19,30,35,36) with a transient species formed within 20 ns (time resolution of the measurement) showing a small contraction (ΔV1 = −0.8 ml/einstein), assigned to the FMN triplet state (PST-LOVT). The triplet decays with a lifetime of τ2 = ∼1.5 μs into a long-lived species, assigned to the covalent, blue-shifted photoadduct (PST-LOV390). Different from the LOV proteins previously analyzed, the formation of the adduct does not correspond to a further, larger contraction but to a very small expansion, ΔV2 < 0.5 ml/einstein (Table 2).
Table 2.
LIOAS data for the PST-LOV proteins
| α1 (τ1 < 20 ns) | ΔV1 (mL/mol) | α2(τ2/μs*) | ΔV2 (mL/mol) | |
|---|---|---|---|---|
| PSPTO2896ΔRR | 0.34 ± 0.03 | −1.57 ± 0.34 | 0.16 ± 0.02 (1.6 ± 0.27) | +0.22 ± 0.12 |
| PSPTO2896 | 0.44 ± 0.03 | −1.49 ± 0.15 | 0.13 ± 0.03 (1.4 ± 0.2) | +0.31 ± 0.18 |
The statistical error originates from an averaging of eight values for each temperature.
Average value at 3.70°C and 10°C.
With the knowledge that the FMN triplet state, both in solution and in LOV proteins, lies at ∼200 kJ/mol (30,36,37), it is possible to calculate the triplet formation quantum yield, ΦT, from Eq. 3:
| (3) |
where EF is the average energy for the fluorescence emission (232 kJ/mol, 515 nm).
ΦF = 0.25 is the flavin fluorescence quantum yield, and Eλ = 265.8 kJ/mol is the photon energy at 450 nm. The triplet quantum yield and also the yield of adduct formation is on the order of 0.45–0.5, typical for LOV proteins. The energy level of the adduct was calculated by means of Eq. 4 and requires the measure of Φ390. This was done relative to YtvA, as previously reported (19).
| (4) |
Finally, the molecular volume changes are evaluated by means of Eqs. 5a and 5b:
| (5a) |
| (5b) |
The results are reported in Table 3 and compared with other LOV proteins.
Table 3.
Photophysical and energetic parameters of PST-LOV proteins
| ΦT | E390/kJ/mol | Φ390 | ΔVT/mL/mol | ΔV390/mL/mol | |
|---|---|---|---|---|---|
| PST-LOVΔRR | 0.58 | 144 | 0.51 | −2.5 | −2.0 |
| PST-LOV | 0.47 | 149 | 0.41 | −2.9 | −2.1 |
| *PpSB2-LOV | 0.46 | 133 | 0.42 | −1.74 | −16.0 |
| †YtvA | 0.62 | 136 | 0.49 | −0.71 | −12.5 |
| †YtvA-LOV | 0.69 | 113 | 0.55 | −0.67 | −17.2 |
| ‡Cr-phot-LOV1 | 0.63 | 171 | 0.6 | −1.15 | −8.0 |
The values of E390, ΔVT, and ΔV390 are affected by the measurement error (<10%, see Table 2) and by the quantum yield determination, whose error depends on a variety of factors (e.g., absorption coefficients, reference standard values, and energy level of the triplet state). Repeated measurements (four) for Φ390 gave an experimental variation within 8%.
Full-length SB2 LOV protein from Pseudomonas putida(35).
Full-length YtvA from Bacillus subtilis and its isolated LOV domain, YtvA-LOV (19).
Isolated LOV1 domain of phototropin from Chlamydomonas reinhardtii(36).
The values of ΦT and Φ390 are, within experimental error (∼20%), very similar for all the proteins analyzed, as well as the high energy level for the adduct that stores ∼50% of the excitation energy. The latter aspect points to a strained conformation and small conformational changes with respect to the unphotolyzed state, a peculiar characteristic of LOV domains (19,35,36). The μs decay kinetics of the triplet state into the adduct indicates that the photocycle is similar to other LOV proteins (30,38,39). A notable difference is that the total structural volume change corresponding to the formation of the adduct, ΔV390, is very small and almost entirely derives from the formation of the triplet state (Table 3, Eqs. 5a and 5b). Actually, the formation of the adduct corresponds to a small expansion (ΔV2 in Table 2) instead of being a quite large contraction as in other LOV proteins (19,35,36). This does not necessarily imply that, as a whole, the protein conformational changes are smaller. In photoreceptors the light-induced ΔVs recorded by means of the LIOAS technique may receive different contributions, e.g., changes in the protein secondary structure, in hydrogen bonds (HBs) around the chromophore, or solvation/electrostriction effects (40). In LOV domains the negative ΔV2 originates mainly from a rearrangement of the HB network around the flavin chromophore, which results in an overall contraction as shown by means of mutagenesis studies on Cr-phot-LOV1 (36). In the relatively large PST-LOV and PST-LOVΔRR constructs, other conformational changes of opposite sign might compensate for this HB rearrangement, resulting in an overall small expansion. This hypothesis is supported by a comparison of the results obtained with full-length YtvA and the isolated YtvA-LOV in that the value of ΔV2 is more negative in the latter system (19).
Phosphorylation assay
Systems like the PST-LOV protein presented here—composed of input domains ready to detect a broad variety of incoming stimuli, thereby activating its HK domain, which in turn activates a signal-transducing RR protein (or protein domain)—are well known and precisely characterized in many other prokaryotic organisms (9). Whereas two-component signal transduction systems are furnished with highly variable input domains and also induce quite different physiological responses, the central building blocks, i.e., the HK activity and the RR (domain), show a remarkable sequential and structural conservation. The central reaction step is the transfer of a phosphate group, initially bound upon activation to a fully conserved histidine of the receptor, to an aspartate residue of the RR.
An analysis of this reaction with PST-LOV by addition of ATP would result in a phosphorylated full-length protein with no insight into the different steps. An attempt to dissect this reaction would be possible by separating both protein domains. This approach yielded the truncated LOV-HK protein (46 kDa) and the RR domain (16 kDa) as independently expressed proteins, as described above. For functional studies, the full-length protein as also a C-terminally truncated construct consisting only of the LOV domain and the HK motif was subjected to light-dependent phosphorylation assays. The separately expressed RR protein, added later in the course of the experiment, would allow us to identify the essential phosphate transfer from HK to RR in a separate experiment. In both full-length and C-terminally truncated PST-LOV, radioactive phosphate is incorporated, but in a much higher yield upon blue light irradiation than under dark conditions (Fig. 5).
Figure 5.
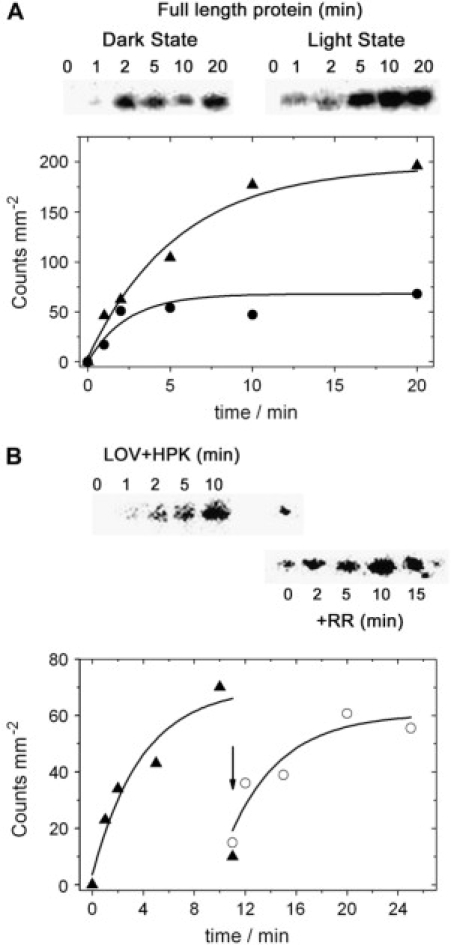
Assay of phosphorylation activity of PST-LOV. Full-length and C-terminally truncated protein were incubated with 32P-γ-ATP (see Materials and Methods), either in the dark or upon blue light irradiation. Aliquots were withdrawn at indicated time points and were separated on an SDS-PAGE electrophoresis gel. The gels were then covered with foil and the incorporated radioactivity was determined. (A) Full-length protein. From left to right: time course (0–20 min) of 32P-phosphate incorporation under blue light irradiation and in the dark. The time course of radioactivity incorporation is shown below. The slight downward deviation of the data point at 10 min might be due to an experimental (pipetting) error. (B) C-terminally truncated fragment containing solely the LOV and the HK domains. This autoradiogram also shows phosphate transfer to the RR after being added to the reaction mixture. Addition is indicated by an arrow. The time course of phosphate incorporation (and phosphate transfer) is shown below. Note that the final data point for the HK domain drops instantaneously upon RR addition (solid triangle at 10 min).
It should be taken into account that the very slow recovery rate of the dark state impedes the reaction such that any scattering light accumulates in the lit state and thus mimics apparent activity of the dark state. The reaction reaches a plateau for both constructs within ∼10 min, indicating that i), apparently the residual amount of illuminated sample is fully phosphorylated and ii), the removal of the RR domain does not impede the phosphorylation of the histidine residue in the HK domain. Addition of the RR to the fully phosphorylated LOV-HK fragment (Fig. 5 B, arrow) resulted in a practically instantaneous phosphate transfer to the RR. The apparently lower radioactivity in the samples of RR taken after very early time points (2 and 5 min) is due to the experimental conditions such that a large excess of the RR was added. The ongoing incorporation of radioactivity into the RR, even after the HK domain does not show any radioactivity, is due to 32P-γ-ATP, which is still present in the reaction mixture that is rapidly attached to the RR by the very active HK domain.
Implications from the P. syringae LOV protein for the transduction mechanism of LOV proteins
The experiments demonstrate a blue light-driven, flavin-bearing HK activity in prokaryotes, which thereby adds blue light to the large number of stimuli that are recorded by this bacterial two-component signal transduction system (41). A similarly built sensory protein, carrying a photoactive yellow protein (PYP)-domain has recently been described (42). The different chromophore structure in both types of proteins becomes immediately clear from an inspection of the absorption spectra: broad and unstructured in the PYP-case and fine structured for the flavin-protein.
A very similar reactivity was recently demonstrated for red light activated bacterial phytochromes, also furnished with an HK domain and a separate RR (26,43). These findings show the modular setup for many bacterial systems, where a broad variety of input signals induce an ensemble of output responses, mediated by a highly conserved signal processing mechanism.
The observation that W111 or a neighboring tyrosine (e.g., Y103) is probably in close vicinity to the RR domain implies the direct interaction of RR with the light-responsive LOV core. This agrees with the low resolution structure (4.2 Å) of ThKA from Thermotoga maritima, a PAS-HK kinase in complex with its RR, i.e., a similar architecture to PST-LOV (44) (the LOV domain is a PAS fold (45)). In this complex the RR is in direct contact with both the HK and the PAS domain, and it was suggested that RR not only acts as an efficient phosphoryl carrier but also exerts a regulative role on the PAS-sensing domain (e.g., by a feedback regulation of sensing) (44). It is also conceivable that the LOV core directly interacts with the HK domain, given the enhancement of the self-phosphorylation activity upon light-activation, again in agreement with the structure of ThKA. The highly conserved W111 and Y103 correspond to W103 and Y95 in YtvA (32) and are localized on strand Hβ and Gβ, respectively, neighboring K105 in the Gβ-Hβ loop. K105 in turn is involved in a salt bridge with E64, a feature of LOV domains suggested to be important in light-to-signal transduction (7). Molecular dynamics simulations suggest that light-induced modifications of the E-K salt bridge are typical for LOV1 activation and are triggered by a change in HBs between FMN and N99 (corresponding to N110 in PST-LOV). Note that this asparagine is directly adjacent to the conserved Trp (46). Conversely, LOV2 activation could be mostly related to conformational changes in the Hβ-Iβ loop (46). This preferential activation for LOV1 and LOV2 via distinct pathways might be related to their specific role within phototropins, with LOV being necessary and sufficient to elicit the majority of light-elicited phot responses and LOV1 probably playing a regulatory role (47,48). In bacterial LOV proteins, the LOV domain has intermediate characteristics between LOV1 and LOV2 (8), in agreement with the data presented here that point both to a light triggered activation of the kinase activity and to regulation via interactions with RR; this intermittent function probably even indicates its ancestry to the LOV proteins of eukaryotes.
Beyond the biochemical characterization presented here, a question on the biological role of this protein remains. Such an approach probably requires the generation of knockout mutants and investigations on modified pathogenicity of such constructs. A search of the locus of this gene (PSPTO_2896) revealed several ORFs encoding signaling or DNA-regulating proteins which could be involved in signal transduction: ORF 2901, DNA-binding protein; ORFs 2903, 2906, transcriptional regulators; and ORF 2907, GGDEF domain/EAL domain protein. However, no detailed investigation has yet been performed.
Conclusion
The results presented here add blue light as a stimulus to the large family of bacterial two-component signal transduction systems. The data demonstrate a functional system, showing light-regulated communication between the various domains of this protein. The aspect of blue light regulation, employing receptor structures in P. syringae very similar to those used by plants, points to a putative role of the bacterial photoreceptors in light-regulated host pathogen interactions, a research field with a strong scientific and potentially economic impact. Yet, only a few reports on that topic are available, clearly demanding much stronger research activity.
Note added in proof: During the time this manuscript was being processed, an exciting report from T. Swartz and co-workers showed that an LOV-kinase regulates infectivity in the animal pathogen Brucella abortus. In the same work they have characterized the kinase activity of a few other bacterial LOV proteins (49).
Acknowledgments
We kindly acknowledge the help of Dr. K. Ernst, University of Düsseldorf, during the radioactivity work, and the technical help of N. Dickmann (Max-Planck-Institut Mülheim) for the MALDI-TOF measurements, and the expert support of Ms. Astrid Wirtz, FZ Jülich, during the HPLC analysis of chromophore content. Robin Buell (The Institute for Genomic Research, 9712 Medical Center Drive, Rockville, MD 20850) kindly provided a cell culture of P. syringae pv. tomato DC3000.
This work was financially supported by the Deutsche Forschungsgemeinschaft (FOR526, project A1).
Footnotes
Editor: Janos K. Lanyi.
References
- 1.Pattison D.I., Davies M.J. Cancer: Cell Structures, Carcinogens and Genomic Instability. Birkhäuser; Basel, Switzerland: 2006. Actions of ultraviolet light on cellular structures. 131–157. [DOI] [PubMed] [Google Scholar]
- 2.Spikes J.D. Photosensitization. In: Smith K.C., editor. The Science of Photobiology. Plenum Press; New York and London: 1989. pp. 79–110. [Google Scholar]
- 3.Miranda M.A. Photosensitization by drugs. Pure Appl. Chem. 2001;73:481–486. [Google Scholar]
- 4.Weber S. Light-driven enzymatic catalysis of DNA repair: a review of recent biophysical studies on photolyase. Biochim. Biophys. Acta. 2005;1707:1–23. doi: 10.1016/j.bbabio.2004.02.010. [DOI] [PubMed] [Google Scholar]
- 5.Armitage J.P., Hellingwerf K. Light-induced behavioral responses (‘phototaxis’) in prokaryotes. Photosynth. Res. 2003;76:145–155. doi: 10.1023/A:1024974111818. [DOI] [PubMed] [Google Scholar]
- 6.Losi A. Flavin Photochemistry and Photobiology. Elsevier; Amsterdam, The Netherlands: 2006. Flavin-based photoreceptors in bacteria. 223–276. [Google Scholar]
- 7.Crosson S., Rajagopal S., Moffat K. The LOV domain family: photoresponsive signaling modules coupled to diverse output domains. Biochemistry. 2003;42:2–10. doi: 10.1021/bi026978l. [DOI] [PubMed] [Google Scholar]
- 8.Losi A. The bacterial counterparts of plants phototropins. Photochem. Photobiol. Sci. 2004;3:566–574. doi: 10.1039/b400728j. [DOI] [PubMed] [Google Scholar]
- 9.West A.H., Stock A.M. Histidine kinases and response regulator proteins in two-component signaling systems. Trends Biochem. Sci. 2001;26:369–376. doi: 10.1016/s0968-0004(01)01852-7. [DOI] [PubMed] [Google Scholar]
- 10.Grebe T.W., Stock J.B. The histidine protein kinase superfamily. Adv. Microb. Physiol. 1999;41:139–227. doi: 10.1016/s0065-2911(08)60167-8. [DOI] [PubMed] [Google Scholar]
- 11.Genoud T., Buchala A.J., Chua N.H., Metraux J.P. Phytochrome signalling modulates the SA-perceptive pathway in Arabidopsis. Plant J. 2002;31:87–95. doi: 10.1046/j.1365-313x.2002.01338.x. [DOI] [PubMed] [Google Scholar]
- 12.Zeier J., Delledonne M., Mishina T., Severi E., Sonoda M., Lamb C. Genetic elucidation of nitric oxide signaling in incompatible plant-pathogen interactions. Plant Physiol. 2004;136:2875–2886. doi: 10.1104/pp.104.042499. [DOI] [PMC free article] [PubMed] [Google Scholar]
- 13.Delledonne M. NO news is good news for plants. Curr. Opin. Plant Biol. 2005;8:390–396. doi: 10.1016/j.pbi.2005.05.002. [DOI] [PubMed] [Google Scholar]
- 14.Buell C.R., Joardar V., Lindeberg M., Selengut J., Paulsen I.T., Gwinn M.L., Dodson R.J., Deboy R.T., Durkin A.S., Kolonay J.F., Madupu R., Daugherty S., Brinkac L., Beanan M.J., Haft D.H., Nelson W.C., Davidsen T., Zafar N., Zhou L., Liu J., Yuan Q., Khouri H., Fedorova N., Tran B., Russell D., Berry K., Utterback T., Van Aken S.E., Feldblyum T.V., D’Ascenzo M., Deng W.L., Ramos A.R., Alfano J.R., Cartinhour S., Chatterjee A.K., Delaney T.P., Lazarowitz S.G., Martin G.B., Schneider D.J., Tang X., Bender C.L., White O., Fraser C.M., Collmer A. The complete genome sequence of the Arabidopsis and tomato pathogen Pseudomonas syringae pv. tomato DC3000. Proc. Natl. Acad. Sci. USA. 2003;100:10181–10186. doi: 10.1073/pnas.1731982100. [DOI] [PMC free article] [PubMed] [Google Scholar]
- 15.Hirano S.S., Upper C.D. Bacteria in the leaf ecosystem with emphasis on Pseudomonas syringae—a pathogen, ice nucleus, and epiphyte. Microbiol. Mol. Biol. Rev. 2000;64:624–653. doi: 10.1128/mmbr.64.3.624-653.2000. [DOI] [PMC free article] [PubMed] [Google Scholar]
- 16.Joardar V., Lindeberg M., Jackson R.W., Selengut J., Dodson R., Brinkac L.M., Daugherty S.C., DeBoy R., Durkin A.S., Giglio M.G., Madupu R., Nelson W.C., Rosovitz M.J., Sullivan S., Crabtree J., Creasy T., Davidsen T., Haft D.H., Zafar N., Zhou L.W., Halpin R., Holley T., Khouri H., Feldblyum T., White O., Fraser C.M., Chatterjee A.K., Cartinhour S., Schneider D.J., Mansfield J., Collmer A., Buell C.R. Whole-genome sequence analysis of Pseudomonas syringae pv. phaseolicola 1448A reveals divergence among pathovars in genes involved in virulence and transposition. J. Bacteriol. 2005;187:6488–6498. doi: 10.1128/JB.187.18.6488-6498.2005. [DOI] [PMC free article] [PubMed] [Google Scholar]
- 17.Feil H., Feil W.S., Chain P., Larimer F., DiBartolo G., Copeland A., Lykidis A., Trong S., Nolan M., Goltsman E., Thiel J., Malfatti S., Loper J.E., Lapidus A., Detter J.C., Land M., Richardson P.M., Kyrpides N.C., Ivanova N., Lindow S.E. Comparison of the complete genome sequences of Pseudomonas syringae pv. syringae B728a and pv. tomato DC3000. Proc. Natl. Acad. Sci. USA. 2005;102:11064–11069. doi: 10.1073/pnas.0504930102. [DOI] [PMC free article] [PubMed] [Google Scholar]
- 18.van den Berg P.W., Widengren J., Hink M.A., Rigler R., Visser A.G. Fluorescence correlation spectroscopy of flavins and flavoenzymes: photochemical and photophysical aspects. Spectrochim. Acta [A] 2001;57:2135–2144. doi: 10.1016/s1386-1425(01)00494-2. [DOI] [PubMed] [Google Scholar]
- 19.Losi A., Quest B., Gärtner W. Listening to the blue: the time-resolved thermodynamics of the bacterial blue-light receptor YtvA and its isolated LOV domain. Photochem. Photobiol. Sci. 2003;2:759–766. doi: 10.1039/b301782f. [DOI] [PubMed] [Google Scholar]
- 20.Rudzki J.E., Goodman J.L., Peters K.S. Simultaneous determination of photoreaction dynamics and energetics using pulsed, time resolved photoacoustic calorimetry. J. Am. Chem. Soc. 1985;107:7849–7854. [Google Scholar]
- 21.Abbruzzetti S., Viappiani C., Murgida D.H., Erra-Balsells R., Bilmes G.M. Non-toxic, water-soluble photocalorimetric reference compounds for UV and visible excitation. Chem. Phys. Lett. 1999;304:167–172. [Google Scholar]
- 22.Small J.R., Libertini L.J., Small E.W. Analysis of photoacoustic waveforms using the nonlinear least squares method. Biophys. Chem. 1992;42:24–48. doi: 10.1016/0301-4622(92)80005-p. [DOI] [PubMed] [Google Scholar]
- 23.Rudzki-Small J., Libertini L.J., Small E.W. Analysis of photoacoustic waveforms using the nonlinear least square method. Biophys. Chem. 1992;41:29–48. doi: 10.1016/0301-4622(92)80005-p. [DOI] [PubMed] [Google Scholar]
- 24.Malkin S., Churio M.S., Shochat S., Braslavsky S.E. Photochemical energy storage and volume changes in the microsecond time range in bacterial photosynthesis—a laser induced optoacoustic study. J. Photochem. Photobiol. B. 1994;23:79–85. [Google Scholar]
- 25.Buttani V., Losi A., Eggert T., Krauss U., Jaeger K.-E., Cao Z., Gärtner W. Conformational analysis of the blue-light sensing protein YtvA reveals a competitive interface for LOV-LOV dimerization and interdomain interactions. Photochem. Photobiol. Sci. 2007;6:41–49. doi: 10.1039/b610375h. [DOI] [PubMed] [Google Scholar]
- 26.Hübschmann T., Jorissen H.J.M.M., Börner T., Gärtner W., deMarsac N.T. Phosphorylation of proteins in the light-dependent signalling pathway of a filamentous cyanobacterium. Eur. J. Biochem. 2001;268:3383–3389. doi: 10.1046/j.1432-1327.2001.02229.x. [DOI] [PubMed] [Google Scholar]
- 27.Briggs W.R., Tseng T.S., Cho H.Y., Swartz T.E., Sullivan S., Bogomolni R.A., Kaiserli E., Christie J.M. Phototropins and their LOV domains: versatile plant blue-light receptors. J. Integr. Plant Biol. 2007;49:4–10. [Google Scholar]
- 28.Kasahara M., Swartz T.E., Olney M.A., Onodera A., Mochizuki N., Fukuzawa H., Asamizu E., Tabata S., Kanegae H., Takano M., Christie J.M., Nagatani A., Briggs W.R. Photochemical properties of the flavin mononucleotide-binding domains of the phototropins from Arabidopsis, rice, and Chlamydomonas reinhardtii. Plant Physiol. 2002;129:762–773. doi: 10.1104/pp.002410. [DOI] [PMC free article] [PubMed] [Google Scholar]
- 29.Losi A., Ghiraldelli E., Jansen S., Gärtner W. Mutational effects on protein structural changes and interdomain interactions in the blue-light sensing LOV protein YtvA. Photochem. Photobiol. 2005;81:1145–1152. doi: 10.1562/2005-05-25-RA-541. [DOI] [PubMed] [Google Scholar]
- 30.Losi A., Polverini E., Quest B., Gärtner W. First evidence for phototropin-related blue-light receptors in prokaryotes. Biophys. J. 2002;82:2627–2634. doi: 10.1016/S0006-3495(02)75604-X. [DOI] [PMC free article] [PubMed] [Google Scholar]
- 31.Johansson L.B., Davidsson A., Lindblom G., Naqvi K.R. Electronic transitions in the isoalloxazine ring and orientation of flavins in model membranes studied by polarized light spectroscopy. Biochemistry. 1979;18:4249–4253. doi: 10.1021/bi00586a033. [DOI] [PubMed] [Google Scholar]
- 32.Losi A., Ternelli E., Gärtner W. Tryptophan fluorescence in the Bacillus subtilis phototropin-related protein YtvA as a marker of interdomain interaction. Photochem. Photobiol. 2004;80:150–153. doi: 10.1562/2004-03-17-RC-116.1. [DOI] [PubMed] [Google Scholar]
- 33.Harper S.M., Neil L.C., Gardner K.H. Structural basis of a phototropin light switch. Science. 2003;301:1541–1544. doi: 10.1126/science.1086810. [DOI] [PubMed] [Google Scholar]
- 34.Harper S.M., Neil L.C., Day I.J., Hore P.J., Gardner K.H. Conformational changes in a photosensory LOV domain monitored by time-resolved NMR spectroscopy. J. Am. Chem. Soc. 2004;126:3390–3391. doi: 10.1021/ja038224f. [DOI] [PubMed] [Google Scholar]
- 35.Krauss U., Losi A., Gärtner W., Jaeger K.-E., Eggert T. Initial characterization of a blue-light sensing, phototropin-related protein from Pseudomonas putida: a paradigm for an extended LOV construct. Phys. Chem. Chem. Phys. 2005;7:2229–2236. doi: 10.1039/b504554a. [DOI] [PubMed] [Google Scholar]
- 36.Losi A., Kottke T., Hegemann P. Recording of blue light-induced energy and volume changes within the wild-type and mutated phot-LOV1 domain from Chlamydomonas reinhardtii. Biophys. J. 2004;86:1051–1060. doi: 10.1016/S0006-3495(04)74180-6. [DOI] [PMC free article] [PubMed] [Google Scholar]
- 37.Gauden M., Crosson S., van Stokkum I.H.M., van Grondelle R., Moffat K., Kennis J.T.M. Low-temperature and time-resolved spectroscopic characterization of the LOV2 domain of Avena sativa phototropin. In: Avrilleir S., Tualle J.M., editors. Femtosecond Laser Applications in Biology. SPIE; Bellingham, WA: 2004. pp. 97–104. [Google Scholar]
- 38.Swartz T.E., Corchnoy S.B., Christie J.M., Lewis J.W., Szundi I., Briggs W.R., Bogomolni R.A. The photocycle of a flavin-binding domain of the blue light photoreceptor phototropin. J. Biol. Chem. 2001;276:36493–36500. doi: 10.1074/jbc.M103114200. [DOI] [PubMed] [Google Scholar]
- 39.Kottke T., Heberle J., Hehn D., Dick B., Hegemann P. Phot-LOV1: photocycle of a blue-light receptor domain from the green alga Chlamydomonas reinhardtii. Biophys. J. 2003;84:1192–1201. doi: 10.1016/S0006-3495(03)74933-9. [DOI] [PMC free article] [PubMed] [Google Scholar]
- 40.Losi A., Braslavsky S.E. The time-resolved thermodynamics of the chromophore-protein interactions in biological photosensors. Learning from photothermal measurements. Phys. Chem. Chem. Phys. 2003;5:2739–2750. [Google Scholar]
- 41.Alm E., Huang K., Arkin A. The evolution of two-component systems in bacteria reveals different strategies for niche adaptation. PLoS Comput. Biol. 2006;2:e143. doi: 10.1371/journal.pcbi.0020143. [DOI] [PMC free article] [PubMed] [Google Scholar]
- 42.Jiang Z.Y., Swem L.R., Rushing B.G., Devanathan S., Tollin G., Bauer C.E. Bacterial photoreceptor with similarity to photoactive yellow protein and plant phytochromes. Science. 1999;285:406–409. doi: 10.1126/science.285.5426.406. [DOI] [PubMed] [Google Scholar]
- 43.Yeh K.C., Wu S.H., Murphy J.T., Lagarias J.C. A cyanobacterial phytochrome two-component light sensory system. Science. 1997;277:1505–1508. doi: 10.1126/science.277.5331.1505. [DOI] [PubMed] [Google Scholar]
- 44.Yamada S., Akiyama S., Sugimoto H., Kumita H., Ito K., Fujisawa T., Nakamura H., Shiro Y. The signaling pathway in histidine kinase and the response regulator complex revealed by x-ray crystallography and solution scattering. J. Mol. Biol. 2006;362:123–139. doi: 10.1016/j.jmb.2006.07.012. [DOI] [PubMed] [Google Scholar]
- 45.Crosson S., Moffat K. Structure of a flavin-binding plant photoreceptor domain: insights into light-mediated signal transduction. Proc. Natl. Acad. Sci. USA. 2001;98:2995–3000. doi: 10.1073/pnas.051520298. [DOI] [PMC free article] [PubMed] [Google Scholar]
- 46.Freddolino P.L., Dittrich M., Schulten K. Dynamic switching mechanisms in LOV1 and LOV2 domains of plant phototropins. Biophys. J. 2006;91:3630–3639. doi: 10.1529/biophysj.106.088609. [DOI] [PMC free article] [PubMed] [Google Scholar]
- 47.Christie J.M., Swartz T.E., Bogomolni R.A., Briggs W.R. Phototropin LOV domains exhibit distinct roles in regulating photoreceptor function. Plant J. 2002;32:205–219. doi: 10.1046/j.1365-313x.2002.01415.x. [DOI] [PubMed] [Google Scholar]
- 48.Cho H.Y., Tseng T.S., Kaiserli E., Sullivan S., Christie J.M., Briggs W.R. Physiological roles of the light, oxygen, or voltage domains of phototropin 1 and phototropin 2 in arabidopsis. Plant Physiol. 2007;143:517–529. doi: 10.1104/pp.106.089839. [DOI] [PMC free article] [PubMed] [Google Scholar]
- 49.Swartz T.E., Tseng T.S., Frederickson M.A., Paris G., Comerci D.J., Rajashekara G., Kim J.G., Mudgett M.B., Splitter G.A., Ugalde R.A., Goldbaum F.A., Briggs W.R., Bogomolni R.A. Blue-light-activated histidine kinases: two-component sensors in bacteria. Science. 2007;317:1090–1093. doi: 10.1126/science.1144306. [DOI] [PubMed] [Google Scholar]