

Abstract
In a cell, it has been estimated that each protein on average interacts with roughly 10 others, resulting in tens of thousands of proteins known or suspected to have interaction partners; of these, only a tiny fraction have solved protein structures. To partially address this problem, we have developed M-TASSER, a hierarchical method to predict protein quaternary structure from sequence that involves template identification by multimeric threading, followed by multimer model assembly and refinement. The final models are selected by structure clustering. M-TASSER has been tested on a benchmark set comprising 241 dimers having templates with weak sequence similarity and 246 without multimeric templates in the dimer library. Of the total of 207 targets predicted to interact as dimers, 165 (80%) were correctly assigned as interacting with a true positive rate of 68% and a false positive rate of 17%. The initial best template structures have an average root mean-square deviation to native of 5.3, 6.7, and 7.4 Å for the monomer, interface, and dimer structures. The final model shows on average a root mean-square deviation improvement of 1.3, 1.3, and 1.5 Å over the initial template structure for the monomer, interface, and dimer structures, with refinement evident for 87% of the cases. Thus, we have developed a promising approach to predict full-length quaternary structure for proteins that have weak sequence similarity to proteins of solved quaternary structure.
Introduction
In a given proteome, it has been estimated that each protein interacts with ∼10 other proteins (1,2). Thus, in eukaryotes, tens of thousands of proteins are known or suspected to interact on the basis of yeast two-hybrid analysis, mass spectrometry or bioinformatics studies (3–6). Knowledge of the structure of these complexes is essential for understanding how the various proteins perform their function (7–9). However, experimental techniques for solving protein structures, x-ray crystallography and NMR spectroscopy, are costly and time-consuming. The development of suitable three-dimensional modeling tools to predict the quaternary structure of protein-protein complexes would be of significant utility (9,10). However, at present, reliable predictions are limited to pairs of proteins that are highly homologous to proteins with solved quaternary structures (11,12). Unfortunately, the number of such proteins is rather limited. To extend the methodology, it is important to be able to recognize complexes of proteins that are structurally similar but evolutionarily remotely related to proteins whose structures are already solved. Motivated by this goal, we have developed M-TASSER, a hierarchical approach to predict protein quaternary structure that includes template identification by multimeric threading, followed by multimer model assembly and refinement.
The structures of protein complexes deposited in the Protein Data Bank (PDB) (13) contain important information for predicting new complexes. As suggested in recent studies, close homologs with sequence identity above 30% tend to interact in a similar way (9,11,12,14). Thus, new protein-protein interactions can be predicted by aligning the pair of target sequences to an evolutionarily related complex structure (15–17). The quality of predicted models is dictated by the sequence identity between target and template proteins. At the high end of sequence identity (>60%), modeling of interactions can be expected to give quite accurate atomic details of the interface. In the medium sequence identity range (30–60%), the overall structural similarity will be conserved, although the molecular details of the interaction (e.g., interacting residue pairs) are often different. When the sequence identity drops below 30%, this is a twilight zone where interactions may or may not be similar; even if they are, the quality of the resulting model is likely to be low, e.g., many structural elements will be distorted or missing and only the rough relative orientation of the two proteins will be predicted (12).
A necessary precondition for the ultimate success of template identification is the completeness of the library of known protein-protein interactions in PDB. Recent studies suggest that the total number of unique interaction types in nature is limited to ∼6000–10,000, of which we currently know ∼2,000, with this number growing at the rate of 300–400 per year (18). With advances in experimental methods for solving protein structures and proposed protein complex structural genomics initiatives (19,20), a complete structural repertoire of interaction types could be realized in the relatively near future. Therefore, the structure prediction problem for protein-protein interactions could eventually be solved by using template-based methodologies. However, an effective algorithm is needed that can deal with proteins in the twilight zone of sequence identity so that related templates can be recognized and models constructed that are closer to their native structure than the starting template alignment.
The recently introduced multimeric threading method, MULTIPROSPECTOR (21–25), goes beyond homology modeling approaches by its ability to infer interactions in complex structures with weak sequence similarity. The method extends single-chain threading (24) to multiple chains and uses statistical interfacial pair potentials (22) to score how well interfaces interact to decide whether or not a protein-protein interaction is present. The approach is computationally inexpensive and has been applied in proteome-scale studies (23). The next logical continuation of this idea is to generate full-length models whose root mean-square-deviation (RMSD) from the corresponding native structures is better than that of the input template structures. Usually, a complex structure is predicted by first modeling the separate components and then structurally aligning the component models to the selected interaction template (12). The drawback of this approach is that: 1), it cannot handle significant conformational changes or large loop rearrangements upon binding, thus resulting in steric clashes in the interface region; and 2), it cannot adjust the relative orientation of the proteins to more accurately predict the structure of the interface.
Here, we describe a procedure that addresses these deficiencies by extending the single protein structure prediction and refinement procedure, TASSER (26–29), to multiple chains. TASSER constructs a full-length model by rearranging continuous template fragments as well as modeling the unaligned regions. TASSER employs an optimized Cα and side-chain center of mass (SG)-based potential driven by predicted tertiary restraints. To examine the feasibility of extending TASSER to dimer model refinement, previously we did a preliminary test by introducing a 30-residue flexible Gly linker between two chains because TASSER could at that time only handle single-chain proteins (25). In all three test cases, the final models showed clear improvement over the best templates, although the linker distorted the interface in one case. This preliminary result encouraged us to develop a more sophisticated method, M-TASSER, which generalizes TASSER to handle multichain proteins explicitly, thus removing the need for a linker. In addition, global moves of the individual chains, i.e., translation and rotation, are added into the Monte Carlo move sets. The relative orientation of the two proteins is adjusted by an interaction force field driven by interfacial contact restraints derived from the templates.
For the past 30 years (30), protein-protein docking methods have been developed that build a model of the complex structure from the known component structures. These docking procedures usually follow the same approach: one protein is fixed in space and the second is rotated and translated around the fixed one. For each new configuration, a score is calculated with the goal that the native complex will be the highest ranked (31). However, as shown in recent blind tests in the Critical Assessment of Predicted Interactions (CAPRI), current methods are still not reliable enough for routine use. There are two major challenges hampering progress: 1), the inability to describe the conformational changes that usually accompany complex formation and 2), an effective scoring function that identifies the correct solution from many false positives (32–34). Most docking approaches treat the component structures as rigid bodies. Thus, targets with backbone RMSD changes that are even as small as 2 Å upon binding can be extremely challenging (35). The most successful procedures use biochemical/biophysical information about the interface regions and predicted interaction sites to guide the docking process (36,37). Although progress in the treatment of flexibility in docking has occurred, this still remains a difficult problem. In addition, inclusion of flexibility can complicate the identification of the correct structures, thereby necessitating the development of better scoring functions (35). Unlike these docking approaches, M-TASSER treats backbone flexibility explicitly and selects the final model by structure clustering, thus circumventing the difficulties of the conformation change and scoring. With the aid of interface identification and prediction, M-TASSER may be applied to predict quaternary structures when there is no complex template available. Nevertheless, M-TASSER suffers from the disadvantage that an example of a structurally related complex must have already been solved, and if so, then it must be selected.
Methods
M-TASSER extends single-chain TASSER (threading/assembly/refinement) (26) to multiple chains. An overview of the M-TASSER methodology is illustrated in Fig. 1. Each query sequence first undergoes single-chain threading using the latest version of PROSPECTOR_3(24) as in TASSER to identify the monomer templates and to provide tertiary contact restraints. Those templates belonging to the same dimer are then identified and their interfaces are examined to assign dimer templates on the basis of an interfacial energy. When a dimer assignment is made, interfacial contact restraints for the pair of query sequences are extracted. The gapped threading model is submitted to the dimer model assembly and refinement procedure, which is driven by the tertiary and interfacial contact restraints. The final models are selected by structure clustering using the SPICKER algorithm (29). In the following sections, we describe each step in detail.
Figure 1.
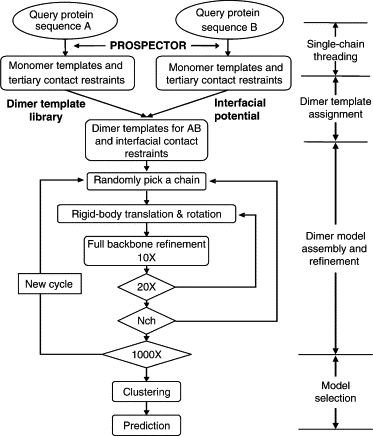
Overview of the M-TASSER methodology.
Single-chain threading
Each query sequence is individually threaded against a nonhomologous monomer template library (sequence identity <35% between any two members) using the previously described threading algorithm PROSPECTOR_3 (24). The purpose of threading is to identify appropriate local fragments for structural reassembly and to derive tertiary contact restraints to guide the model refinement process. To generate the monomer template library, all PDB protein sequences sharing >35% sequence identity are clustered together and one representative sequence is selected from each cluster (24). The monomer templates are single chains from monomeric and multimeric proteins. Templates sharing sequence identities above 30% to the query sequence are excluded. For each query-template alignment, a Z-score is calculated as:
| (1) |
where Ek is the energy of the query sequence in the kth template, 〈E〉 is the average energy of all templates, and σ is the standard deviation of the energies. The Z-score gives the number of standard deviations between the template and the average random energy. Templates with Z-score ≥9 have a good chance of being correct (24). The query sequence is then threaded against all the monomers in the dimer template library (described below) with the Z-score calculated using the values of 〈E〉 and σ derived from the monomer template library. The monomer template library can be found at http://cssb.biology.gatech.edu/skolnick/files/M-TASSER/MonomerLibrary.
Dimer template assignment
To differentiate those threading templates that are part of a complex from those that are not, a dimer template library is generated (described below). Dimer templates with both chains sharing sequence identities below 30% to the target are examined. All pairwise target-template alignment combinations with both single-chain templates originating from the same dimer are identified and then the interfacial energy is calculated (described below). A pair of targets is assumed to interact if their interfacial energy is below −12. The energy threshold was determined by the minimum score that separates the true dimers from those identified on the basis of crystallization artifacts (22). All predicted dimeric templates are ranked by the sum of single-chain Z-scores of both chains and the interfacial energy. The top 10 templates are used to derive the consensus interfacial contacts and also serve as starting structures in the dimer model refinement procedure.
Dimer model assembly and refinement
The single-chain model assembly and refinement approach in TASSER (26–29) was generalized and extended to multichain proteins. We first briefly describe the TASSER refinement procedure. Each residue in a protein is described by its Cα atom and side-chain center of mass (SG). Based on the threading alignment, the chain is divided into continuous aligned regions (more than five residues) that are off-lattice and gapped unaligned regions that are confined to a lattice. An initial full-length model is built by connecting the continuous aligned regions by a random walk of Cα-Cα bond vectors of variable lengths between 3.26 and 4.35 Å. Only geometric virtual Cα-Cα bond angle constraints (65°–165°) and excluded volume are considered during this initial model building procedure. Initial models are submitted to parallel hyperbolic Monte Carlo sampling for assembly and refinement (38). The off-lattice Cαs of the aligned residues excised from the threading template are subject to rigid fragment translations and rotations. The lattice confined Cαs of the unaligned residues are subject to two to six bond movements and multibond sequence shifts. All SGs are determined by a two-rotamer approximation (39) based on the Cα geometry. All movements are guided by the same force field.
TASSER was initially developed to predict protein tertiary structure; thus, it could only handle single-chain proteins. M-TASSER is a generalized version that can handle as many chains as needed by using a common parameter—the number of chains (Nch). All chains are treated separately without the need for a linker. Two global move types, rigid-body translation and rotation, are added to the Monte Carlo move set to adjust the relative orientation of each protein chain. The amplitude of the global moves has been optimized on a set of 16 nonhomologous training dimers different from the benchmark set used here (the training dimer set can be found at http://cssb.biology.gatech.edu/skolnick/files/M-TASSER/DimerTrain).
In the dimer model refinement procedure, the single-chain threading templates of both chains are first structurally aligned to a dimer template to create starting conformations with the two chains in contact. Each chain then undergoes tertiary structure refinement as in TASSER as well as position perturbations by random global translations and rotations. To avoid the chains moving away from each other, the global movement steps are kept small (mean 0.2 Å translation along all three axes and 6° rotation around the axis of the protein center). All movements are guided by the same force field, which is a combination of the TASSER force field that describes the intrachain interactions and a force field describing interchain interactions (described below). The interchain interactions consist of protein specific interfacial contact restraints derived from the dimer templates as well as statistical pairwise SG-SG, Cα-Cα, SG-Cα interactions and hydrogen bonding. The interfacial contact restraints allow the chains to adjust the interface around the initial template, as well as prevent them from moving too far away from each other. For statistical potentials, we use the same terms as in the TASSER monomer force field. That is, we assume that these interactions in the protein-protein interface are the same as in the protein interior (detailed below).
Model selection
Each Monte Carlo simulation employs 40 replicas at different temperatures. The multimer structures in the 16 lowest temperature replicas are submitted to the structural clustering program, SPICKER (29). Clustering is based on the global RMSD for all decoy pairs. A combined model is generated for each cluster and is ranked by cluster density. We use the best combined model of the top five clusters in this study.
The dimer template library and the benchmark set
We compiled a library of pairwise interacting proteins from multichain crystal structure entries in the PDB (13) using the following criteria:
-
1.
Protein chains with <40 residues, protein-protein complexes with <30 interfacial contacts, or an interfacial energy above −12, as well as DNA/RNA constructs, are excluded. Interfacial contact residues are defined as a pair of residues from different chains that have at least one pair of heavy atoms within 4.5 Å of each other. A pair of protein chains sharing an interface is called a dimer throughout this article.
-
2.
Dimers in the library should not have >35% sequence identity with each other (i.e., at most one chain in a dimer can have >35% sequence identity to any of the chains in another dimer). To generate the nonhomologous dimer library, we mapped all the dimers to the clusters of monomer templates (each member of the monomer template library has its own cluster that consists of PDB sequences sharing >35% identity). Of all dimers with one chain mapped to cluster i and the other chain mapped to cluster j, one representative dimer was chosen.
-
3.
The dimers should be verified to have a true protein-protein interaction instead of being assigned just on the basis of crystal packing. Here, we define a pair of chains as having a functional protein-protein interaction if they share an interface in a functional biological multimer (dimer or higher order oligomer). Strictly speaking, functional biological molecules can only be confirmed by direct experimental studies in solution. However, such experimental data are rather limited (21,40).
To assess the reliability of template-based modeling of protein-protein interactions, the false positive rate of proteins that are assigned as putative multimers must be estimated. Currently, there are two main sources of hypothetical biological units, the PDB and the Protein Quaternary Structure file server (PQS) (41). Crystal structures deposited in the PDB usually contain one asymmetric unit that does not necessarily represent the biologically functional molecule. The description of the biological unit and instructions for generating the biological unit from the asymmetric unit by symmetry operations are provided in REMARK 300 and 350 of the PDB files. For entries deposited before 1999, these data are either provided by the depositors or obtained from Swiss-Prot (42) or PQS. Since 1999, they are solely based on the details provided by the depositors (http://www.rcsb.org/). The PDB has provided separate coordinate files for the biological units. PQS generates the biological units for the PDB entries by recursively adding monomeric chains based on the number of interchain contacts, and then, it differentiates between a specific and nonspecific (crystal packing) interaction by using the difference in surface area upon binding and other parameters (41). The biological units of both the PDB and the PQS are often hypothetical, and it has been shown that they disagree for 18% of the entries (43).
To assess the performance of both classifications, a nonredundant set of 55 monomers and 88 dimers (21,40), for which the biological multimeric state is confirmed by experimental data in literature, are used to query the PDB and the PQS (http://pqs.ebi.ac.uk/). This list may be found at http://cssb.biology.gatech.edu/skolnick/files/M-TASSER/true_multimers. The PDB classifies 97 as dimers, among which 83 (86%) are correct; this covers 94% of the true dimers in the set. The PQS classifies 93 as dimers, among which 76 (82%) are correct; this covers 86% of true dimers. Taking the common predictions of both the PDB and the PQS, 83 are classified as dimers, among which 75 (90%) are correct, with a coverage of 85% of true dimers. The PDB surpasses the PQS in terms of both accuracy and coverage. The consensus classification by both predicts fewer dimers but with higher confidence. It is desirable to have a more certain interaction template library even though some true templates are missing. Thus, we only keep those dimers whose biological units are in both the PDB and the PQS and are in the same multimeric state. The resulting template library consists of 1838 dimers, among which 1220 are putative biological dimers, including 970 homodimers and 250 heterodimers. We use the same definition of homodimers and heterodimers as in the PQS. At this stage, we want to use biological dimers with both chains <200 residues in length (that are likely to adopt a single domain tertiary structures) to benchmark our methodology. There are 487 such dimers in the library, including 400 homodimers and 87 heterodimers. The list of dimer templates (DimerLibrary) and the benchmark set (DimerBench) can be found at http://cssb.biology.gatech.edu/skolnick/files/M-TASSER/.
Interfacial energy for dimer template assignment
To evaluate the strength of interfacial interactions to assign a protein pair as belonging to a dimer, we calculate the interfacial energy using the following formula:
| (2) |
where (i = 1,…20; j = 1,…,20) is the statistical interfacial pair potential between residues of type i and j (22) (which may be found at http://cssb.biology.gatech.edu/skolnick/files/potentials/) and nij is the number of interacting interfacial residue pairs of type i and j. Here, we have extended the interfacial energy by using multiple sequence (ms) information. Specifically, for each interfacial residue, a sequence-profile vector with components representing the occurrence probabilities for the 20 types of amino acids is used instead. The sequence profiles were extracted from the position-specific scoring matrices produced by three-iteration PSI-BLAST (44) using an e-value cutoff of 0.001. It has been shown that using PSI-BLAST profiles significantly improves the accuracy of secondary structure (45) and solvent accessibility predictions (46). We previously applied both single-sequence interfacial energy (Ess) and multiple-sequence interfacial energy (Ems) to predict dimeric templates by multimeric threading on a test set of 300 dimers (results not shown). Each dimeric target-template pair was given a two-state prediction (one-correct template, zero-incorrect template). The Ems achieved the best Matthew's correlation coefficient (MCC) between observed and predicted states of 0.63, whereas the best MCC of Ess is 0.57. Thus, Ems is used in this study.
Force field for dimer model refinement
The force field employed in the M-TASSER refinement procedure is a combination of the original TASSER force field describing the single molecular free energy and an intermolecular potential.
| (3) |
The TASSER force field has been described previously in detail (39). Here we give a brief summary. There are 26 energy terms. These can be divided into three classes: 1), statistical potentials derived from the PDB, including long-range SG-SG, Cα-Cα, SG-Cα interactions, local Cα correlations, and hydrogen bonding; 2), propensities for predicted secondary structures from PSIPRED (45) and hydrophobic burial interactions from a solvent accessibility prediction (46); and 3), protein-specific SG-pair potentials, tertiary contact restraints, and distance restraints extracted from the threading templates provided by PROSPECTOR_3 (24).
The interfacial force field consists of pairwise SG-SG, Cα-Cα, SG-Cα interactions, hydrogen-bonding, and interfacial contact restraints.
Pairwise interactions
The pairwise interactions between Cα-Cα and SG-Cα used here are the same as in the TASSER force field as applied to monomers. They essentially involve excluded volume interactions, which are represented by a hard-sphere potential plus a 1/r type of soft-core potential with a slightly larger range. The SG-SG interaction is written as
| (4) |
where Ems is the multiple-sequence interfacial energy calculated from the statistical interfacial pair potential (22) (Eq. 2); Edfire_scm is calculated from the DFIRE-SCM potential based on the distance-scaled, finite ideal-gas reference state (47,48). The DFIRE-SCM potential is a simplified residue-level DFIRE potential based on the side-chain center of mass that can be directly applied to the M-TASSER reduced model (48). We optimized the relative weights to minimize the average dimer RMSD of the best models on a 16-dimer training set (the training set can be found at http://cssb.biology.gatech.edu/skolnick/files/M-TASSER/DimerTrain). The optimization is done iteratively by fixing one value and changing the other in the range of 0–5 for w1 and 0–10 for w2. The values w1 = 1.8, w2 = 5.0 are found to be optimal.
Hydrogen bonds
The hydrogen bond (H-bond) interaction involves interactions between β-predicted residues.
Interfacial contact restraints
The function describing interfacial contact restraints is essentially the same as that describing the tertiary contact restraints used in TASSER. Consensus interfacial Cα-Cα and SG-SG contact predictions are collected from dimer templates. Residue pair (i,j) is predicted to be in contact if their contact probability in the set of dimeric templates is higher than 30%. The contact potential is calculated as
| (5) |
For each predicted Cα-Cα or SG-SG contact residue pair (i,j), the distance rij is calculated and compared to the distance cutoff dcutoff. The first term invokes a penalty when the predicted SG-SG contact pairs are farther apart than the distance cutoff. The second term applies an additional penalty when the total distance deviation of all predicted SG-SG contact pairs is larger than a threshold value Ncp The third term favors predicted Cα-Cα contact pairs that are within the distance cutoff. We use the same weights as in the TASSER force field.
Results
Template identification by multimeric threading
We are interested in the success rate of template identification by multimeric threading. First, we need to estimate the maximum number of targets that can find a template with weak sequence similarity in the dimer library. Structural alignment using native structures gives the optimal superposition between the target and the template. Thus, structural alignment defines which target proteins can be aligned in a template library and allows the assessment of the quality of any threading method. We use the structural alignment method, TM-align (49), to perform library search for each target dimer. Because TM-align is designed for single-chain proteins, it does not distinguish between different protein chains. Direct structural alignment of the dimers may result in one chain from the target structure aligned to both chains of the template. Thus, we use a two-step process similar to the multimeric threading procedure to create the structural alignment models for dimers. Each monomer is first individually aligned to the dimer template library, and then the two monomer alignment models belonging to the same dimer are then concatenated to form a dimer model. The dimer model is structurally compared to the native structure as an entity using the TM-score (50). The residue numbers of two chains in both native and model structures are reordered sequentially so that the comparison is based on the residue equivalency of the dimer. The difference between TM-align and the TM-score programs is that the TM-score is designed to compare two models of the same protein based on their residue equivalency, whereas TM-align is a structural alignment program that will first find the best equivalent residues of two proteins based on the structural similarity. The TM-score values in both programs have the same definition. We define a dimeric target-template pair to be correct if each monomer in the dimer as well as the dimer model have TM-scores ≥0.4 (a statistically significant threshold for structural similarity) and a fraction of native contacts (fnat) ≥10% (a threshold that separates an acceptable interaction prediction from an incorrect prediction (34)).
Table 1 shows the results for template identification by TM-align with a minimum TM-score 0.4. If we do an all-against-all comparison of the 487 dimers in our dimer library, and exclude templates sharing >30% sequence identity, only 241 (49%) dimers can find a correct template in the dimer library. This gives the total number of 241 positive targets and 246 negative targets in the benchmark set of 487 total dimers.
Table 1.
Template identification by threading in comparison to structural alignment results
| TMalign (TM-score ≥ 0.4) |
Prospector (Z-score ≥ 9.0) |
|||
|---|---|---|---|---|
| All | Heterodimer | All | Heterodimer | |
| N_monomer | 573 (100%)* | 174 (100%) | 380 (66%) | 117 (67%) |
| N_dimer (Ncta > 0) | 467 (96%) | 74 (85%) | 253 (52%) | 30 (34%) |
| N_dimer (Eintf < −12) | 407 (84%) | 45 (52%) | 207 (43%) | 15 (17%) |
| N_dimer (DTM > 0.4) | 343 (70%) | 37 (43%) | 185 (38%) | 14 (16%) |
| N_dimer (DTM > 0.4 and Fnat > 0) | 310 (64%) | 31 (36%) | 181 (37%) | 13 (15%) |
| N_dimer (DTM > 0.4 and Fnat ≥ 10%) | 241 (49%) | 21 (24%) | 165 (36%) | 12 (14%) |
The values shown are the number (fraction) of targets that can find a template in the dimer library. The total targets consist of 487 dimers including 87 heterodimers, belonging to 574 unique monomers. Ncta is the number of interfacial contacts; DTM is the dimer TM-score; and Fnat is the fraction of native interfacial contacts.
We then repeat the process but employ template identification by threading instead of structural alignments. The results are shown in Table 1 where a minimum single-chain Z-score of 9 is required. A total of 207 targets can find a dimer template with an interfacial energy below −12; these are predicted to interact as dimers. Among these predicted dimers, 165 (80%) have a correct template identified. The result shows a 68% true positive rate (fraction of true positive prediction over all (241) positive targets) and a 17% false positive rate (fraction of false positive prediction over all (246) negative targets) for the template identification by threading.
We are particularly interested in the percentage of heterodimers that can identify a dimer template. There are 87 heterodimers in the benchmark set. As shown in Table 1, although all the monomers can identify a correct fold with TM-score ≥0.4 in the dimer library, only 21(24%) of the heterodimers can find a correct dimer template by TM-align. The reason for the relatively low percentage of predictable heterodimers is probably because the number of heterodimers in the dimer template library is still limited. Threading predicts 15 heterodimers as interacting, of which 12 (80%) have a correct dimer template.
M-Tasser model refinement
All the 207 targets predicted as interacting are used to benchmark the dimer model refinement algorithm. Of these, 192 are homodimers and 15 are heterodimers, with a total of 222 unique chains. Because a dimer model is determined not only by the monomer structure but also by its quaternary structure, we will compare the refinement results on monomer, interface, and overall dimer structures, respectively, over the best initial templates. The best template is defined as the template with the highest dimer TM-score to native. The refinement results are summarized in Table 2.
Table 2.
Summary of comparison of M-TASSER models with the best initial templates
| All (N = 207) |
Heterodimer (N = 15) |
|||||||||
|---|---|---|---|---|---|---|---|---|---|---|
| Tali (Å) | Mali (Å) | Ment (Å) | Ttm | Mtm | Tali (Å) | Mali (Å) | Ment (Å) | Ttm | Mtm | |
| Coverage/sequence identity %* | 91/20 | 91/20 | ||||||||
| Monomer | 5.3 | 4.0 | 4.6 | 0.67 | 0.76 | 3.8 | 3.2 | 4.0 | 0.71 | 0.79 |
| Interface | 6.7 | 5.4 | 5.9 | 0.52 | 0.58 | 6.5 | 5.2 | 6.0 | 0.59 | 0.62 |
| Dimer | 7.4 | 5.9 | 6.5 | 0.66 | 0.73 | 6.7 | 5.7 | 6.7 | 0.69 | 0.75 |
Alignment coverage/sequence identity for the best template that has the highest dimer TM-score to native. Tali, RMSD to native for the best initial templates over aligned residues. Mali, RMSD to native for the best of top five models on the same aligned region as the best template. Ment, RMSD to native for the best of top five models over the entire chain. Ttm, TM-score for the best initial templates. Mtm, TM-score for the best of top five models.
Dimer structures
Fig. 2 A shows the RMSD to native of the best dimer model in the top five clusters versus that of the best initial template on the same aligned regions. About 87% of the models are closer to native than the best template as evidenced by their lower RMSD value. The average RMSD to native for the models and the templates are 5.9 and 7.4 Å, respectively. The improvement of the M-TASSER model over the best template is also shown in Fig. 2 B, where the TM-score to native of the model is plotted against that of the template. Most of the models have higher TM-score to native than the best templates. The average TM-score for the models and the templates are 0.73 and 0.66, respectively. Fig. 2 C shows the fraction of models (templates) below the given RMSD-to-native thresholds; 71% of the templates have a RMSD to native below 6.5 Å (a threshold for a foldable structure (51)). An additional 5% of the targets become foldable after M-TASSER refinement. If we define a medium resolution model as that with RMSD to native <4 Å, and a high resolution model as that with RMSD to native <2 Å, M-TASSER predicts 57% medium resolution models, among which 6% are high resolution models. The corresponding percentages for the best templates are 39% and 1%, respectively. Fig. 2 D shows the fraction of targets having a dimer RMSD improvement above the given threshold value, d, plotted as a function of the dimer RMSD of the initial template. For initial template structures with a 5–6 Å RMSD, 41% of targets improve the RMSD by at least 2 Å; 48% of targets with an initial RMSD of 4–5 Å improve the RMSD by at least 1 Å. For very good initial templates, 26% with an initial RMSD of 3–4 Å improve the RMSD by at least 1 Å and 24% with initial RMSD of 2–3 Å improve the RMSD by at least 0.5 Å.
Figure 2.
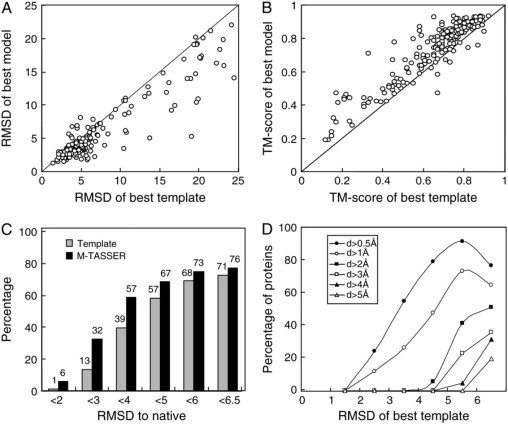
M-TASSER refinement of dimer structure compared to the best initial template. (A) RMSD to native. (B) TM-score to native. (C) Histogram of fraction of models at different RMSD to native thresholds. (D) Fraction of targets with an RMSD improvement by M-TASSER greater than the threshold value d. Here, d = “RMSD of template” - “RMSD of model”. Each point is calculated with a bin width of 1 Å; however, the last point includes all templates with an RMSD >6 Å.
Native interface region
Even if the monomer models are perfect, the RMSD in the interface may be bad if the monomers have incorrect interactions. Moreover, the effect of the RMSD change on interface refinement will be more significant when calculated on only interface residues than on the whole chain. Thus, here, we restrict the RMSD calculation to native interface residues only, and we use native interface residues for direct comparison of different models. Native interface residues are defined as the residues with at least one heavy atom within 4.5 Å of any heavy atom on the other chain in the native complex structure. In our data set, 26% of residues are in the interface region by this definition. Models with an interface RMSD >4 Å most likely have incorrect interaction (34).
Fig. 3 A shows the interface RMSD to native of the best dimer models versus that of the best initial template on the same aligned regions. Most of the models have interfaces closer to native than the best templates by showing a lower interface RMSD value. The average interface RMSD to native for the models and the templates are 5.4 and 6.7 Å, respectively. The improvement of the interface as assessed by the TM-score in M-TASSER model over the best template is also shown in Fig. 3 B. Again, most of the interfaces in the model have a higher TM-score to native than that in the best template. The average interface TM-score for the models and the templates are 0.58 and 0.52, respectively; 49% of the best templates have correct interactions in that their interfacial RMSD to native is below 4.0 Å (see Fig. 3 C). After M-TASSER refinement, 64% models have a correct interface; 15% of the best templates have an interface RMSD <2 Å. M-TASSER refines an additional 7% of models to have an interface RMSD below 2 Å. Fig. 3 D shows the fraction of targets with an interface RMSD improvement above the given threshold value, d, plotted as a function of the interface RMSD of the initial template. For initial templates with a 5- to 6-Å interface RMSD, 57% of targets improve the quality of the interface by at least 2 Å; 50% of targets with a 4- to 5-Å initial interface RMSD improve the RMSD of the interface by at least 1 Å. For initial templates with a good interface, 53% with a 3- to 4-Å interface RMSD improve the RMSD by at least 1 Å; 52% with a 2- to 3-Å interface RMSD improve the RMSD by at least 0.5 Å.
Figure 3.
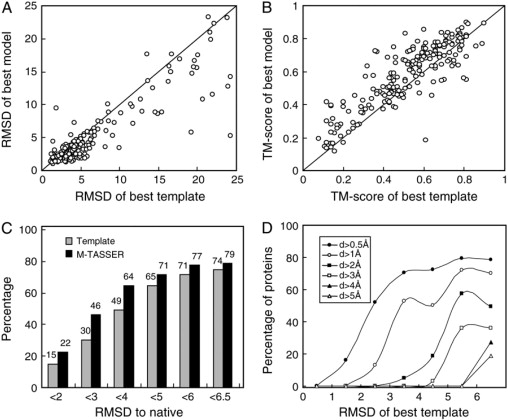
Extent of M-TASSER refinement of the interface structure compared to the best initial template. (A) RMSD to native. (B) TM-score to native. (C) Histogram of fraction of models at different RMSD to native thresholds. (D) Fraction of targets with a RMSD improvement by M-TASSER greater than the threshold value d. Here, d = “RMSD of template” - “RMSD of model”. Each point is calculated with a bin width of 1 Å; however, the last point includes all templates with an RMSD >6 Å.
Monomer structures
As shown in Table 2, the monomer structures of the initial templates have an average RMSD to native of 5.3 Å with an average coverage of 91%, and their average TM-score is 0.67. The sequence identity ranges from 6% to 30% with an average of 20%; 80% of the monomer structures are foldable (RMSD, <6.5 Å), 53% have medium resolution (<4 Å), and 4% have high resolution (<2 Å) (Fig. 4 C). The monomer structures of the M-TASSER models have an average RMSD to native of 4.0 Å on the same aligned regions and an average TM-score of 0.76. As shown in Fig. 4, A and B, the improvement is evident for most cases The percentages of foldable, medium, and high resolution models increases to 88%, 76%, and 20% from 80%, 53%, and 4% of the template structures, respectively. Fig. 4 D shows the fraction of targets with a monomer RMSD improvement above the given threshold value plotted as a function of the monomer RMSD of the initial template. For initial template structures with a 5- to 6-Å RMSD, 43% of targets improve the RMSD by at least 2 Å; 51% of targets with a 4- to 5-Å initial RMSD improve by at least 1 Å. For very good initial templates, 37% with a 3- to 4-Å initial RMSD improve the RMSD by at least 1 Å and 46% with a 2- to 3-Å initial RMSD improve the RMSD by at least 0.5 Å.
Figure 4.
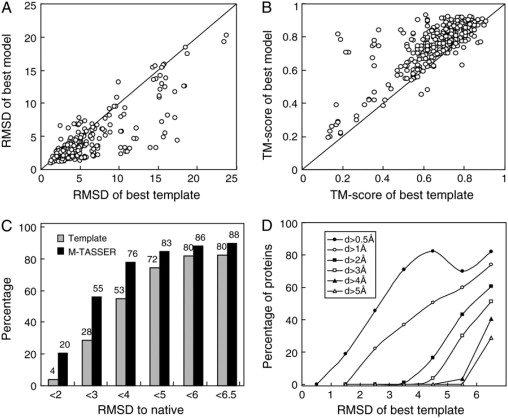
M-TASSER refinement on monomer structure compared to the best initial template. (A) RMSD to native. (B) TM-score to native. (C) Histogram of fraction of models at different RMSD to native thresholds. (D) Fraction of targets with a RMSD improvement by M-TASSER greater than the threshold value, d. Here, d = “RMSD of template” - “RMSD of model”. Each point is calculated with a bin width of 1 Å; however, the last point includes all templates with an RMSD >6 Å.
Representative examples
In Fig. 5, we show three representative examples showing the improvement of M-TASSER models over their best template. Target 2fur (homodimer, 188 residues each chain) has four templates. The best template (PDB code, 2arz) shares 10% sequence identity on 87% aligned residues. The fraction of native contacts is 20% and the dimer TM-score is 0.55. The template has a correctly aligned interface in its N-terminal domain, but the C-terminal domain, mainly composed of a large extended loop, is away from the interface. The other templates share consensus regions only in the N-terminal domain of the best template. This C-terminal loop region contributes significantly to the RMSD to native and gives values of 12.0, 19.2, and 13.8 Å for the monomer, interface, and dimer structures, respectively. After M-TASSER assembly and refinement, the extended loop is correctly rearranged to the interface. The final model has a RMSD to native of 4.7 (4.8) Å, 5.7 (5.8) Å, and 5.0 (5.0) Å on the same aligned residues (entire chain) for the monomer, interface, and dimer structures. The dimer TM-score is 0.79.
Figure 5.
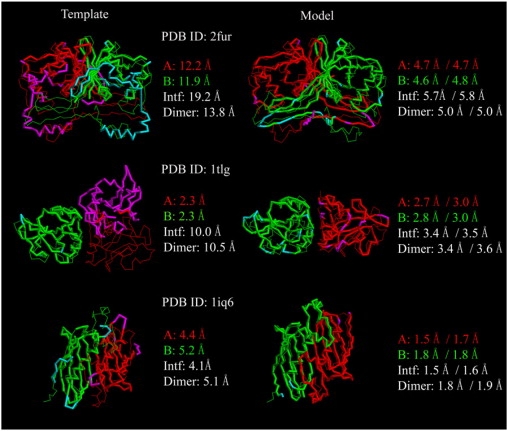
Representative examples of M-TASSER models compared to the best initial template. The left-hand column is the best template superimposed onto the native structure whereas the right-hand column shows the final model superimposed onto the native structure. The thin lines are native structures with monomer chain A colored in red and chain B colored in green. The thick lines are initial templates or final models with residues within 5 Å from native colored in red (chain A) or green (chain B). Residues that lie beyond this distance are in magenta (chain A) or cyan (chain B). For models, the numbers on the left are the RMSD to native over the same aligned residues as the best template; the numbers on the right are the RMSD to native of the entire chain.
Target 1tlg (homodimer, 123 residues each chain) has two templates without a consensus interface. The best template, 1rdi, shares 21% sequence identity on 90% aligned residues. The template has very good monomer structures whose RMSD to native is 2.3 Å, but the dimer has an incorrect relative orientation between the monomers. Superimposing the template and the native structures onto one monomer structure shows that the other monomer in template is rotated ∼90° relative to the native structure. The fraction of native contacts is 5%. The RMSD to native for the interface and dimer structures are 10.0 and 10.5 Å, respectively. The dimer TM-score is 0.46. M-TASSER refinement correctly adjusts the orientation of the monomers although a little bit of the quality of the monomer structures is sacrificed. The final model has a RMSD to native of 2.8 (3.0) Å, 3.4 (3.5) Å, and 3.4 (3.6) Å on the same aligned residues (entire chain) for the monomer, interface, and dimer structures. The dimer TM-score is 0.78.
Target 1iq6 (homodimer, 133 residues each chain) has 10 templates with a good consensus interface. The best template, 1q4t, shares 17% sequence identity with 78% aligned residues. The fraction of native contacts is 28%. The template has a RMSD to native of 4.8, 4.1, and 5.1 Å for the monomer, interface, and dimer structures. The dimer TM-score is 0.65. M-TASSER refines the template structures to high resolution models. The final model has a RMSD to native of 1.7 (1.8) Å, 1.5 (1.6) Å, and 1.8 (1.9) Å on the same aligned residues (entire chain) for the monomer, interface, and dimer structures. The dimer TM-score is 0.93.
Discussion
We have developed a hierarchical approach to predict full-length protein quaternary structure from amino acid sequence that includes template identification by multimeric threading followed by multimer model assembly and refinement; 207 target dimers are predicted as interacting by multimeric threading, of which 165 (80%) have a correct dimer template with weak sequence similarity identified. The true positive and false positive rates of template identification are 68% and 17%, respectively. The best threading templates have an average RMSD to native of 5.3, 6.7, and 7.4 Å for the monomer, interface, and dimer structures. The final models have an average RMSD to native of 4.0, 5.4, and 5.9 Å on the same aligned region for the monomer, interface, and dimer structures. The refinement is systematic with 87% of dimer models being closer to native than the best template structures.
The quality of the initial dimer templates is important for dictating the quality of the final model because: 1), the interfacial contact restraints used to guide the model refinement procedure are derived from the templates; 2), the dimer template provides the starting orientation of the individual chains; 3), our interfacial energy function is still far from perfect. Nevertheless, M-TASSER shows some ability to refine the interface and dimer structures when the best threading template has an interface RMSD >6.5 Å. Refinement is more significant for medium and high resolution models whose dimer templates are more likely to have an approximately correct interface. The M-TASSER monomer models are very similar to the TASSER single-chain models as shown by their monomer TM-score (Fig. 6). This is because we use the same tertiary contact and distance restraints in both simulations.
Figure 6.
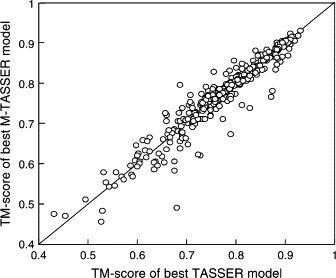
Comparison of the TM-scores of the M-TASSER full-length monomer model with the single chain TASSER model.
As noted in 1, the success of M-TASSER is partly dictated by the number of reasonably accurate tertiary and interfacial contact restraints. Since the tertiary restraints are predicted from monomer templates library by single-chain threading and because the monomer template library is much more complete than the dimer template library, the tertiary contact predictions are more reliable than the interfacial contact predictions. A better method for interfacial contact prediction will likely improve the results.
Since M-TASSER is fully automated, in the very near future, it will be applied to predict protein quaternary structure on a proteomic scale. Furthermore, a web-server version with shorter simulation times will also be developed for public use. In addition to predicting quaternary structure directly from sequences, M-TASSER may also be useful in the refinement of docked protein structures. We will explore this issue in the near future.
Acknowledgments
We thank Dr. Adrian Arakaki for his help in the preparation of the figures.
This research was supported in part by grant No. GM-48835 of the Division of General Medical Sciences of the National Institutes of Health.
Footnotes
Editor: José Onuchic.
References
- 1.von Mering C., Krause R., Snel B., Cornell M., Oliver S.G., Fields S., Bork P. Comparative assessment of large-scale data sets of protein-protein interactions. Nature. 2002;417:399–403. doi: 10.1038/nature750. [DOI] [PubMed] [Google Scholar]
- 2.Kumar A., Snyder M. Protein complexes take the bait. Nature. 2002;415:123–124. doi: 10.1038/415123a. [DOI] [PubMed] [Google Scholar]
- 3.Rain J., Selig L., De Reuse H., Battaglia V., Reverdy C., Simon S., Lenzen G., Petel F., Wojcik J., Schachter V. The protein-protein interaction map of Helicobacter pylori. Nature. 2001;409:211–215. doi: 10.1038/35051615. [DOI] [PubMed] [Google Scholar]
- 4.Hazbun T., Fields S. Networking proteins in yeast. Proc. Natl. Acad. Sci. USA. 2001;98:4277–4278. doi: 10.1073/pnas.091096398. [DOI] [PMC free article] [PubMed] [Google Scholar]
- 5.Uetz P., Giot L., Cagney G., Mansfield T., Judson R., Knight J., Lockshon D., Narayan V., Srinivasan M., Pochart P., Qureshi-Emili A., Li Y. A comprehensive analysis of protein-protein interactions in Saccharomyces cerevisiae. Nature. 2000;403:623–627. doi: 10.1038/35001009. [DOI] [PubMed] [Google Scholar]
- 6.Ito T., Chiba T., Osawa R., Yoshida M., Hattori M., Sasaki Y. A comprehensive two-hybrid analysis to explore the yeast protein interactome. Proc. Natl. Acad. Sci. USA. 2000;98:4569–4574. doi: 10.1073/pnas.061034498. [DOI] [PMC free article] [PubMed] [Google Scholar]
- 7.Edwards A.M., Kus B., Jansen R., Greenbaum D., Greenblatt J., Gerstein M. Bridging structural biology and genomics: assessing protein interaction data with known complexes. Trends Genet. 2002;18:529–536. doi: 10.1016/s0168-9525(02)02763-4. [DOI] [PubMed] [Google Scholar]
- 8.Sali A., Glaeser R., Earnest T., Baumeister W. From words to literature in structural proteomics. Nature. 2003;422:216–225. doi: 10.1038/nature01513. [DOI] [PubMed] [Google Scholar]
- 9.Russell R.B., Alber F., Aloy P., Davis F.P., Korkin D., Pichaud M., Topf M., Sali A. A structural perspective on protein-protein interactions. Curr. Opin. Struct. Biol. 2004;14:313–324. doi: 10.1016/j.sbi.2004.04.006. [DOI] [PubMed] [Google Scholar]
- 10.Abbott A. Proteomics: the society of proteins. Nature. 2002;417:894–896. doi: 10.1038/417894a. [DOI] [PubMed] [Google Scholar]
- 11.Aloy P., Ceulemans H., Stark A., Russell R.B. The relationship between sequence and interaction divergence in proteins. J. Mol. Biol. 2003;332:989–998. doi: 10.1016/j.jmb.2003.07.006. [DOI] [PubMed] [Google Scholar]
- 12.Aloy P., Pichaud M., Russell R.B. Protein complexes: structure prediction challenges for the 21st century. Curr. Opin. Struct. Biol. 2005;15:15–22. doi: 10.1016/j.sbi.2005.01.012. [DOI] [PubMed] [Google Scholar]
- 13.Berman H.M., Westbrook J., Feng Z., Gilliland G., Bhat T.N., Weissig H., Shindyalov I.N., Bourne P.E. The Protein Data Bank. Nucleic Acids Res. 2000;28:235–242. doi: 10.1093/nar/28.1.235. [DOI] [PMC free article] [PubMed] [Google Scholar]
- 14.Szilagyi A., Grimm V., Arakaki A.K., Skolnick J. Prediction of physical protein-protein interactions. Phys. Biol. 2005;2:S1–S16. doi: 10.1088/1478-3975/2/2/S01. [DOI] [PubMed] [Google Scholar]
- 15.Pieper U., Eswar N., Braberg H., Madhusudhan M.S., Davis F.P., Stuart A.C., Mirkovic N., Rossi A., Marti-Renom M.A., Fiser A., Webb B., Greenblatt D. MODBASE, a database of annotated comparative protein structure models, and associated resources. Nucleic Acids Res. 2004;32:D217–D222. doi: 10.1093/nar/gkh095. [DOI] [PMC free article] [PubMed] [Google Scholar]
- 16.Aloy P., Russell R.B. InterPreTS: protein interaction prediction through tertiary structure. Bioinformatics. 2003;19:161–162. doi: 10.1093/bioinformatics/19.1.161. [DOI] [PubMed] [Google Scholar]
- 17.Aloy P., Russell R.B. Interrogating protein interaction networks through structural biology. Proc. Natl. Acad. Sci. USA. 2002;99:5896–5901. doi: 10.1073/pnas.092147999. [DOI] [PMC free article] [PubMed] [Google Scholar]
- 18.Aloy P., Russell R.B. Ten thousand interactions for the molecular biologist. Nat. Biotechnol. 2004;22:1317–1321. doi: 10.1038/nbt1018. [DOI] [PubMed] [Google Scholar]
- 19.Apic G., Gough J., Teichmann S.A. Domain combinations in archaeal, eubacterial and eukaryotic proteomes. J. Mol. Biol. 2001;310:311–325. doi: 10.1006/jmbi.2001.4776. [DOI] [PubMed] [Google Scholar]
- 20.Sali A. NIH workshop on structural proteomics of biological complexes. Structure. 2003;11:1043–1047. doi: 10.1016/s0969-2126(03)00163-1. [DOI] [PubMed] [Google Scholar]
- 21.Lu L., Lu H., Skolnick J. MULTIPROSPECTOR: an algorithm for the prediction of protein-protein interactions by multimeric threading. Proteins. 2002;49:350–364. doi: 10.1002/prot.10222. [DOI] [PubMed] [Google Scholar]
- 22.Lu H., Lu L., Skolnick J. Development of unified statistical potentials describing protein-protein interactions. Biophys. J. 2003;84:1895–1901. doi: 10.1016/S0006-3495(03)74997-2. [DOI] [PMC free article] [PubMed] [Google Scholar]
- 23.Lu L., Arakaki A.K., Lu H., Skolnick J. Multimeric threading-based prediction of protein-protein interactions on a genomic scale: application to the Saccharomyces cerevisiae proteome. Genome Res. 2003;13:1146–1154. doi: 10.1101/gr.1145203. [DOI] [PMC free article] [PubMed] [Google Scholar]
- 24.Skolnick J., Kihara D., Zhang Y. Development and large scale benchmark testing of the PROSPECTOR_3 threading algorithm. Proteins. 2004;56:502–518. doi: 10.1002/prot.20106. [DOI] [PubMed] [Google Scholar]
- 25.Grimm V., Zhang Y., Skolnick J. Benchmarking of dimeric threading and structure refinement. Proteins. 2006;63:457–465. doi: 10.1002/prot.20878. [DOI] [PubMed] [Google Scholar]
- 26.Zhang Y., Skolnick J. Automated structure prediction of weakly homologous proteins on a genomic scale. Proc. Natl. Acad. Sci. USA. 2004;101:7594–7599. doi: 10.1073/pnas.0305695101. [DOI] [PMC free article] [PubMed] [Google Scholar]
- 27.Zhang Y., Arakaki A.K., Skolnick J. TASSER: an automated method for the prediction of protein tertiary structures in CASP6. Proteins. 2005;61(Suppl. 7):91–98. doi: 10.1002/prot.20724. [DOI] [PubMed] [Google Scholar]
- 28.Zhang Y., Skolnick J. Tertiary structure predictions on a comprehensive benchmark of medium to large size proteins. Biophys. J. 2004;87:2647–2655. doi: 10.1529/biophysj.104.045385. [DOI] [PMC free article] [PubMed] [Google Scholar]
- 29.Zhang Y., Skolnick J. SPICKER: a clustering approach to identify near-native protein folds. J. Comput. Chem. 2004;25:865–871. doi: 10.1002/jcc.20011. [DOI] [PubMed] [Google Scholar]
- 30.Wodak S., Janin J. Computer analysis of protein-protein interactions. J. Mol. Biol. 1978;124:323–342. doi: 10.1016/0022-2836(78)90302-9. [DOI] [PubMed] [Google Scholar]
- 31.Dominguez C., Boelens R., Bonvin A.M. HADDOCK: a protein-protein docking approach based on biochemical and/or biophysical information. J. Am. Chem. Soc. 2003;125:1731–1737. doi: 10.1021/ja026939x. [DOI] [PubMed] [Google Scholar]
- 32.Janin J., Henrick K., Moult J., Eyck L., Sternberg M., Vajda S., Vakser I., Wodak S. CAPRI: a critical assessment of predicted interactions. Proteins. 2003;52:2–9. doi: 10.1002/prot.10381. [DOI] [PubMed] [Google Scholar]
- 33.Mendez R., Leplae R., Lensink M.F., Wodak S.J. Assessment of CAPRI predictions in rounds 3–5 shows progress in docking procedures. Proteins. 2005;60:150–169. doi: 10.1002/prot.20551. [DOI] [PubMed] [Google Scholar]
- 34.Mendez R., Leplae R., De Maria L., Wodak S.J. Assessment of blind predictions of protein-protein interactions: current status of docking methods. Proteins. 2003;52:51–67. doi: 10.1002/prot.10393. [DOI] [PubMed] [Google Scholar]
- 35.Bonvin A.M. Flexible protein-protein docking. Curr. Opin. Struct. Biol. 2006;16:194–200. doi: 10.1016/j.sbi.2006.02.002. [DOI] [PubMed] [Google Scholar]
- 36.van Dijk A.D., de Vries S.J., Dominguez C., Chen H., Zhou H.X., Bonvin A.M. Data-driven docking: HADDOCK's adventures in CAPRI. Proteins. 2005;60:232–238. doi: 10.1002/prot.20563. [DOI] [PubMed] [Google Scholar]
- 37.Chen H., Zhou H.X. Prediction of interface residues in protein-protein complexes by a consensus neural network method: test against NMR data. Proteins. 2005;61:21–35. doi: 10.1002/prot.20514. [DOI] [PubMed] [Google Scholar]
- 38.Zhang Y., Kihara D., Skolnick J. Local energy landscape flattening: parallel hyperbolic Monte Carlo sampling of protein folding. Proteins. 2002;48:192–201. doi: 10.1002/prot.10141. [DOI] [PubMed] [Google Scholar]
- 39.Zhang Y., Kolinski A., Skolnick J. TOUCHSTONE II: a new approach to ab initio protein structure prediction. Biophys. J. 2003;85:1145–1164. doi: 10.1016/S0006-3495(03)74551-2. [DOI] [PMC free article] [PubMed] [Google Scholar]
- 40.Ponstingl H., Kabir T., Thornton J.M. Automatic inference of protein quaternary structure from crystals. J. Appl. Cryst. 2003;36:1116–1122. [Google Scholar]
- 41.Henrick K., Thornton J.M. PQS: a protein quaternary structure file server. Trends Biochem. Sci. 1998;23:358–361. doi: 10.1016/s0968-0004(98)01253-5. [DOI] [PubMed] [Google Scholar]
- 42.Boeckmann B., Bairoch A., Apweiler R., Blatter M.C., Estreicher A., Gasteiger E., Martin M.J., Michoud K., O’Donovan C., Phan I., Pilbout S., Schneider M. The SWISS-PROT protein knowledgebase and its supplement TrEMBL in 2003. Nucleic Acids Res. 2003;31:365–370. doi: 10.1093/nar/gkg095. [DOI] [PMC free article] [PubMed] [Google Scholar]
- 43.Xu Q., Canutescu A., Obradovic Z., Dunbrack R.L. ProtBuD: a database of biological unit structures of protein families and superfamilies. Bioinformatics. 2006;22:2876–2882. doi: 10.1093/bioinformatics/btl490. [DOI] [PubMed] [Google Scholar]
- 44.Altschul S.F., Madden T.L., Schaffer A.A., Zhang J., Zhang Z., Miller W., Lipman D.J. Gapped BLAST and PSI-BLAST: a new generation of protein database search programs. Nucleic Acids Res. 1997;25:3389–3402. doi: 10.1093/nar/25.17.3389. [DOI] [PMC free article] [PubMed] [Google Scholar]
- 45.Jones D. Protein secondary structure prediction based on position-specific scoring matrics. J. Mol. Biol. 1999;292:195–202. doi: 10.1006/jmbi.1999.3091. [DOI] [PubMed] [Google Scholar]
- 46.Chen H., Zhou H.X. Prediction of solvent accessibility and sites of deleterious mutations from protein sequence. Nucleic Acids Res. 2005;33:3193–3199. doi: 10.1093/nar/gki633. [DOI] [PMC free article] [PubMed] [Google Scholar]
- 47.Zhou H., Zhou Y. Distance-scaled, finite ideal-gas reference state improves structure-derived potentials of mean force for structure selection and stability prediction. Protein Sci. 2002;11:2714–2726. doi: 10.1110/ps.0217002. [DOI] [PMC free article] [PubMed] [Google Scholar]
- 48.Zhang C., Liu S., Zhou H., Zhou Y. An accurate, residue-level, pair potential of mean force for folding and binding based on the distance-scaled, ideal-gas reference state. Protein Sci. 2003;13:400–411. doi: 10.1110/ps.03348304. [DOI] [PMC free article] [PubMed] [Google Scholar]
- 49.Zhang Y., Skolnick J. TM-align: a protein structure alignment algorithm based on the TM-score. Nucleic Acids Res. 2005;33:2302–2309. doi: 10.1093/nar/gki524. [DOI] [PMC free article] [PubMed] [Google Scholar]
- 50.Zhang Y., Skolnick J. Scoring function for automated assessment of protein structure template quality. Proteins. 2004;57:702–710. doi: 10.1002/prot.20264. [DOI] [PubMed] [Google Scholar]
- 51.Reva B.A., Finkelstein A.V., Skolnick J. What is the probability of a chance prediction of a protein structure with an RMSD of 6 A? Fold. Des. 1998;3:141–147. doi: 10.1016/s1359-0278(98)00019-4. [DOI] [PubMed] [Google Scholar]